
Abstract
In order to prepare optimal platelet and extracellular vesicle (EV)-rich plasma for the treatment of chronic temporal bone inflammation, we studied effects of centrifugation parameters on redistribution of blood constituents in blood samples of 23 patients and 20 volunteers with no record of disease. Concentrations of blood cells and EVs were measured by flow cytometry. Sample content was inspected by scanning electron microscopy. A mathematical model was constructed to interpret the experimental results. The observed enrichment of plasma in platelets and EVs after a single spin of blood depended on the erythrocyte sedimentation rate, thereby indicating the presence of a flow of plasma that carried platelets and EVs in the direction opposite to settling of erythrocytes. Prolonged handling time correlated with the decrease of concentration of platelets and larger EVs in platelet and EV-rich plasma (PVRP), R = −0.538, p = 0.003, indicating cell fragmentation during the processing of samples. In further centrifugation of the obtained plasma, platelet and EV enrichment depended on the average distance of the sample from the centrifuge rotor axis. Based on the agreement of the model predictions with observations, we propose the centrifugation protocol optimal for platelet and EV enrichment and recovery in an individual sample, adjusted to the dimensions of the centrifuge rotor, volume of blood and erythrocyte sedimentation rate.
Introduction
Blood plasma enriched in platelets has been demonstrated to possess regenerative and angiogenic properties [Citation1–3] and has become a subject of increasing interest in different fields of medicine [Citation4–6]. Its impact on hemostasis and immune and inflammatory responses [Citation2,Citation3] has initially been ascribed to platelets. In attempts to understand and manipulate the mechanism, it has been found that when activated, platelets release growth factors and cytokines [Citation3,Citation7,Citation8] which are considered as potential vectors of the healing process. Various centrifugation protocols have been designed to obtain plasma preparations enriched in platelets [Citation8–13]. Comparison of the results is difficult as there are many parameters that influence the outcome [Citation14].
Lately, increasing attention is being paid to membrane-enclosed cellular fragments (extracellular vesicles – (EVs)) that have been found abundant in isolates from plasma [Citation15–19]. It has been indicated that EVs are being shed from platelets [Citation19] as well as from other cells [Citation18–20]. Considering the presence of EVs in the processed plasma, we refer to the preparation as “platelet and EV-rich plasma” (PVRP).
PVRP is simple to prepare (only requires a centrifuge and few basic laboratory tools), and with autologous application there is low risk of complications such as infection or immune rejection [Citation1]. However, the preparation procedure can significantly impact blood cells and EVs [Citation16,Citation17] and therefore also the composition of PVRP. Besides EVs that are already present in plasma in vivo, the preparation contains also EVs that are formed during the sample storage [Citation19–21] and processing due to the temperature change and shear stress imposed upon blood cells and their fragments [Citation16,Citation17]. The composition of PVRP that determines its biological activity is therefore influenced by the sample handling throughout the processing.
We believe that the estimation of optimal centrifugation time to recover platelets and EVs from plasma with high yield is important in the design of efficient experimental and therapeutic procedures. In this work, we studied some parameters of the processing (composition of blood, centrifugation pull and time, processing temperature and processing time) on the distribution of blood cells and EVs in the samples to optimize the enrichment of plasma in platelets and EVs in the therapeutic preparation of an individual sample. We report on a new perspective on dynamics of blood cells and EVs during the processing of samples.
Methods
The study was performed in companion to the clinical trial NCT04281901. It was approved by the Republic of Slovenia National Medical Ethics Committee, (approval number: 0120–146/2019/5) and performed in accordance with The Declaration of Helsinki. All participants were apprised about the aim of the study and the procedures to be used in it and have signed a written informed consent.
Nomenclature and abbreviation
Blood is described as a liquid base (plasma) with suspended blood cells, EVs and lipoprotein particles. Centrifugation is referred to as “Spin” with an index (e.g., SpinBlood) indicating the sample before centrifugation. Erythrocyte – poor plasma (EPP): The part of the sample after SpinBlood above the border formed by the majority of erythrocytes xERC (). Platelet and EV-rich plasma (PVRP): the part of the sample after SpinEPP with elevated concentration of platelets and EVs with respect to the initial sample. Platelet-poor plasma (PPP): the part of the sample after SpinEPP depleted in platelets. Centrifugal pull (CP): centripetal acceleration of the centrifuge rotor expressed in terms of the multiplication factor of the Earth gravity acceleration g. The term EVs defines sub-cellular-sized particles that are found in samples. Concentration of particles of the p-type: cp (p refers to the specific region in the scatter plot () or to the type of blood cells). Enrichment factor in particles of the p-type: Ep = cp,procedure/cp,baseline. Recovery of particles of the p-type: Rp = Np,procedure/Np,baseline, where N is the number of particles.
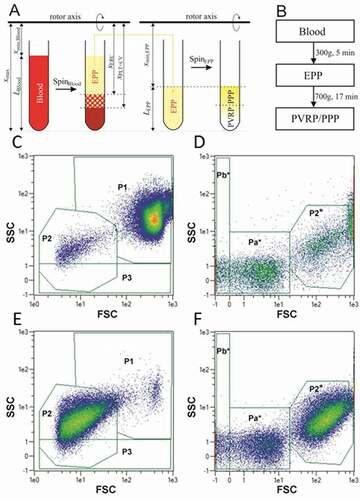
Figure 1. A: Scheme of preparation of EPP by SpinBlood, followed by preparation of PVRP/PPP by SpinEPP. Platelets in PVRP/PPP are represented by white color. B: Flow chart of the two-step centrifugation protocol used to prepare therapeutic plasma for treatment of patients with chronic ear wounds. C-F: Flow cytometry gating strategy. Blood (C, D) and plasma (E, F) are presented as acquired by two settings adapted to the size of analyzed particles (C, E: larger scale and D, F: smaller scale). Smaller scale is indicated by the asterisk. 5 populations of particles were followed – P1: attributed mainly to erythrocytes but containing also leukocytes, P2 and P2* (in larger and in smaller scale settings, respectively): attributed mainly to activated platelets and larger EVs, P3: subpopulation of particles with a weak side scattering signal, and Pa*+Pb*: attributed to smaller EVs and lipoproteins. Colored scale from blue to red corresponds to increasing event density.
Design of experiments
Appendixes (A1-A3) contain details on (A1): blood sampling, flow cytometry (FCM), scanning electron microscopy (SEM) and statistical analysis; (A2): mathematical model for interpretation of the experiments; and (A3): comparison of patients and healthy volunteers. Blood/plasma samples were processed in a centrifuge (Centric 400 R, Domel, Železniki, Slovenia, with a swinging rotor RS4/100).
Effect of CP on distribution of particles in EPP
Different CPs (100 g, 300 g, 400 g, and 500 g, brake 9) and temperatures (18°C or 37°C) were applied to blood samples of 3 volunteers with no record of disease. Centrifugation was stopped every 5 min and the position of the erythrocyte boundary (visible by eye) with respect to the surface level of the sample was measured by a ruler. Sedimentation was stopped when the volume of formed EPP reached 80% or more of the maximum volume expected if the erythrocytes were closely packed at the bottom of the tube
Vmax = (1-Ht)SLBlood (1)
where Ht is hematocrit, S is the cross sectional area of the sample and LBlood is the length of the blood sample.
Effects of sample processing on concentration of particles in EPP, PVRP and PPP
Blood samples from 23 patients with chronic temporal bone inflammation and from 20 volunteers without a record of disease were processed by a two-spin protocol [Citation8] (SpinBlood followed by SpinEPP). Autologous PVRP preparations from blood of patients were used for the treatment of temporal bone inflammation.
In SpinBlood, two tubes of blood were centrifuged at 18°C and 300 g for 5 min. Usually, buffy coat was not evidently formed after SpinBlood while the EPP border was well defined in all samples. EPP was collected down to 2–3 mm above the erythrocyte boundary. Care was taken not to aspirate the erythrocytes. The volume of collected EPP varied from blood sample to blood sample. Depending on the acquired quantity, EPP from the two blood tubes was transferred into one or into two sterile tubes (graduated culture tubes ref.: T405-1A, Simport Scientific, Canada) by a sterile pipette (ref.: 225–1S, Termofisher Scientific, USA).
In SpinEPP, the obtained supernatant was centrifuged at 18°C and 700 g for 17 min to concentrate platelets and EVs in the lower part of the tube. After the centrifugation, the sample was divided into two equal volume parts: the upper half (PPP) and the lower half with re-suspended pellet (PVRP) (). Whole blood and all plasmas: EPP, PPP and PVRP were subjected to further analyses.
Flow cytometry
Samples were analyzed by MACS QUANT flow cytometer (Miltenyi, Bergisch-Gladbach, Germany), and the related software. Particles were characterized based on forward (FSC) and side (SSC) scattering signals as shown on examples of blood (, D) and plasma (, F).
The gates were set in a preliminary study on the basis of experience with previously analyzed several blood samples. Identity of cells in the presented regions was confirmed by fluorescently labelled antibodies (CD41 was used to label platelets and CD45 to label leukocytes) and by SEM analysis. More details are given in Appendix A1.
Results
Visualization of centrifugation effects
After the two step protocol, activated platelets and EVs as well as residual erythrocytes and leukocytes could be observed in PVRP (–C). Erythrocytes and platelets underwent budding, leading to fragmentation (Panel B). The pellet obtained with centrifugation at higher speed consisted of erythrocytes in rouleaux, and amorphous aggregates (Panel D). Erythrocytes and the clot (probably consisting of coalesced platelets) were well segregated in the sediment (Panel D), indicating high level of separation of those cells already before settling. Platelets generally approached globular shape with tubular buds (Panels A-C), indicating their activated state and possible fragmentation into EVs, including tubular-shaped ones (Panel E).
Figure 2. The mechanism of EVs formation from blood cells. A: PVRP showing residual erythrocytes (fat white arrows), leukocytes (white arrows), activated platelets (fat black arrows) and EVs (white triangle is pointing to an example), B: budding platelet (white arrow) and erythrocyte (black arrow) in PVRP, C: smaller magnification image of PVRP, D: pellet after centrifugation of blood at 2000 g showing erythrocyte rouleaux (fat white arrow) and amorphous material probably derived from coalesced platelets (fat black arrow), E: EVs of different shapes including tubular EVs (white arrows) and a deformed fragmenting platelet (fat white arrow) in the isolate. PVRP (Panels A-C) was prepared with the two step protocol [Citation8] (first step: centrifugation of blood for t = 5 min, at CP = 300 g and T = 18°C, second step: centrifugation of EPP for t = 17 min at CP = 700 g and T = 18°C). EPP pellet (Panel D) was prepared by centrifugation for t = 5 min at CP = 2000 g and room temperature. EV isolate (Panel E) was prepared by centrifugation of blood for t = 30 min at CP = 2000 g and 22°C, followed by centrifugation of EPP for 20 min at 17570 g and 22°C with two repeats of washing with PBS and re-centrifugation of the pellet; isolate was visualized in the centrifuge tube in which it was prepared). The images were acquired by JSM-6500 F Field Emission Scanning Electron Microscope (JEOL Ltd., Tokyo, Japan). The figure was assembled by Corel Draw Software (Corel Corporation, Version X6).
![Figure 2. The mechanism of EVs formation from blood cells. A: PVRP showing residual erythrocytes (fat white arrows), leukocytes (white arrows), activated platelets (fat black arrows) and EVs (white triangle is pointing to an example), B: budding platelet (white arrow) and erythrocyte (black arrow) in PVRP, C: smaller magnification image of PVRP, D: pellet after centrifugation of blood at 2000 g showing erythrocyte rouleaux (fat white arrow) and amorphous material probably derived from coalesced platelets (fat black arrow), E: EVs of different shapes including tubular EVs (white arrows) and a deformed fragmenting platelet (fat white arrow) in the isolate. PVRP (Panels A-C) was prepared with the two step protocol [Citation8] (first step: centrifugation of blood for t = 5 min, at CP = 300 g and T = 18°C, second step: centrifugation of EPP for t = 17 min at CP = 700 g and T = 18°C). EPP pellet (Panel D) was prepared by centrifugation for t = 5 min at CP = 2000 g and room temperature. EV isolate (Panel E) was prepared by centrifugation of blood for t = 30 min at CP = 2000 g and 22°C, followed by centrifugation of EPP for 20 min at 17570 g and 22°C with two repeats of washing with PBS and re-centrifugation of the pellet; isolate was visualized in the centrifuge tube in which it was prepared). The images were acquired by JSM-6500 F Field Emission Scanning Electron Microscope (JEOL Ltd., Tokyo, Japan). The figure was assembled by Corel Draw Software (Corel Corporation, Version X6).](/cms/asset/857bda3d-0919-4849-8330-d698146540bc/iplt_a_1961716_f0002_b.gif)
Effect of CP on distribution of particles in EPP
Under certain centrifugation conditions (CPs, temperature) as well as in sedimentation in gravitational field (1 g) the concentrations of platelets and larger EVs (gated P2 in ) in EPP were found to be higher than the respective concentrations in blood, i.e., EP2 = cP2,EPP/cP2,Blood >1 (–C). The analytical error in FCM was excluded by assessment of diluted samples. In line with this, a considerably lower concentration of P2 particles than the blood baseline was detected in the erythrocyte pellet (data not shown). While the effect of the temperature on concentration of P2 particles was not strong, at 37°C the samples were depleted in P3 particles with respect to those at 18°C (, D).
Figure 3. Distribution of particles in plasma above the erythrocyte boundary. A-I: Concentration of particles (A-B: platelets and EVs (P2 particles), C-D: weakly side-scattering particles (P3 particles) and E-F: residual erythrocytes and leukocytes (P1 particles)) measured in layers of EPP (plasma was collected in fractions from the sample surface down to the erythrocyte boundary as indicated in the illustration of the tube). SpinBlood was performed at different CPs as indicated by differently shaded markings of the circles and at different temperatures. The samples were also allowed to sediment in gravitational field (1 g) (empty circles). Concentrations of P1, P2 and P3 particles are given normalized to their blood values (annotated by the dotted line in Panels A-D).
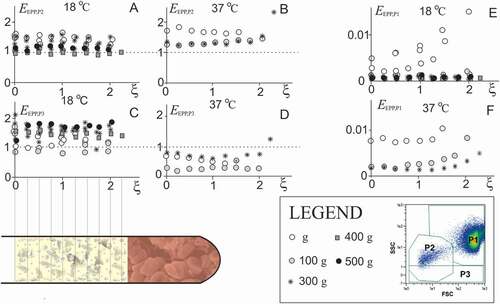
Hardly any trend was observed in the density profile of P2 and P3 particles (–D). There was also no qualitative difference in profiles of P2 particles between the donors, between different CPs or sedimentation in gravitational field, and between different temperatures, however, respective quantitative differences could be of importance. The portion of residual P1 particles (mostly erythrocytes and leukocytes) in EPP was smaller than 2% (–F).
Effect of sample processing on concentration of particles in EPP, PVRP and PPP
Blood samples from 23 patients and 20 volunteers without a record of disease were processed by the two-spin protocol [Citation8]: yellowish liquid above the visible border formed by the majority of sedimented erythrocytes (EPP) with the volume VEPP was redistributed into sample(s) with a given sedimentation path LEPP () and centrifuged within SpinEPP. EPP was further enriched in P2 particles in the bottom part of the tube (PVRP) while it was depleted in P2 particles in the top part of the tube (PPP) (), the border between the two parts being at xmin,EPP+LEPP/2, where xmin,EPP is the distance of the level of the sample from the rotor axis. Selected correlation coefficients between the measured parameters of the samples that we found most relevant are presented in . Raw data and the table of all correlation coefficients are given in the Appendix A3.
Table I. Average values of parameters relevant for EPP, PVRP and PPP, and correlation coefficients between these parameters with respective probabilities p, calculated by using the results of N samples
While it could be expected that the concentrations of P2 particles in samples would reflect the baseline concentration of P2 particles as well as concentration of platelets in blood, the explanation of the obtained significant correlations between VEPP and erythrocyte sedimentation rate (ESR), between cP2,PVRP and LEPP and between cP2,PPP and LEPP were not straightforward and were interpreted by using the mathematical model described in the Appendix (Part A2). The volume of EPP gathered after SpinBlood occupied the region between the erythrocyte boundary and the level of the sample Eq.(A2.25),
VEPP = S xmin,Blood(exp(ε ESR X tSpinBlood/xmax) - 1), (2)
where xmin,Blood is the distance of the level of the blood sample from the centrifuge rotor axis (Figure S1), ε is an adjustable constant, ESR is erythrocyte sedimentation rate; X is multiplication factor of Earth gravity acceleration g in CP, tSpinBlood is the time of centrifugation of SpinBlood and xmax is the distance of the tube bottom from the rotor axis (Figure S1). The ratio between the volume of EPP gathered after SpinBlood and the maximal volume of plasma that could be formed according to the hematocrit VEPP/Vmax (Eq.(1)) was on the average 0.37 (measured) and 0.34 (calculated by using Eq.(2)) while the measured and the calculated dependencies of VEPP on ESR are given in .
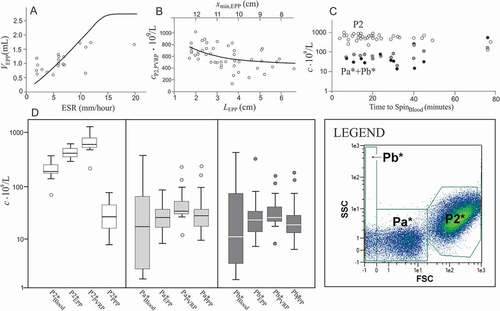
Figure 4. The main factors affecting PVRP obtained by a two-step centrifugation protocol. A: Volume of EPP, VEPP, (gathered at 300 g for 5 min) in dependence on erythrocyte sedimentation rate ESR; in theoretical curve (Eq.(2)), ε = 0.13, xmin,Blood = 8 cm and xmax = 14 cm. The saturation level denotes the average of the maximal volume of EPP that could be obtained if the erythrocytes were closely packed in the pellet Vmax,EPP (Eq.(1)). B: Concentration of platelets and EVs (P2 particles) in PVRP in dependence on the distance of the sample level from the rotor axis (xmin)/sedimentation path (LEPP); in the theoretical curve (Eq.(3)), cP2,EPP = 399.109/L and τPLT,EPP = 0.06. C: concentration of P2 particles (empty circles), Pa*+Pb* particles in PVRP (crosses) and Pa*+Pb* particles in PPP (black circles), in dependence on time from blood sampling to SpinBlood. The statistical outliers are presented as circles outside the boxplots. D: Concentration of platelets and larger EVs (P2* particles), and smaller EVs (Pa* and Pb* particles) in blood, EPP, PVRP and PPP. FCM measurements were made in small scale settings (, D).
As VEPP differed between donors, the samples had different sedimentation paths LEPP (Figure S1). Since the centrifugal force on the particles is proportional to the distance of the particle from the rotor axis xmin,EPP, the samples with larger xmin,EPP (and hence smaller LEPP) were on the average subjected to a stronger force. shows the measured and the calculated concentrations of P2 particles in PVRP in dependence on LEPP. As expected, cP2,PVRP negatively correlated with LEPP (−0.506, N = 38, p = 0.001) while the correlation in PPP was positive (0.713, N = 37, p < 0.001) (). Following expression (A2.29) for total number of particles in the pellet, considering that lower boundary separating PVRP from PPP was at xmin,EPP+LEPP/2, that the volume of the PVRP was SLEPP/2 and that xmax-xmin,EPP = LEPP, the concentration of P2 particles in PVRP reads
cP2,PVRP = 2* cP2, EPP (1- exp(-τP2,SpinEPP)/2+ (1-exp(-τP2,SpinEPP)) xmin,EPP /(xmax-xmin,EPP)).(3)
A finite time passed between blood collection and centrifugation, in particular in patients, since samples had to be carried from the outpatient department to the laboratory. We have observed a trend of lower concentrations of P2 particles in PVRP related to higher concentrations of Pa* and Pb* particles in PVRP and PPP with longer sample handling time (). EVs are continuously produced by cells in vivo, therefore some EVs are expected to be naturally present in blood. However, besides these, blood cells shed vesicles also ex vivo, during the sample processing and assessment [Citation16,Citation17]. In all samples, the concentration of platelets and larger EVs (P2* particles) was higher in EPP than in blood, and it further increased in PVRP while it was substantially lower in PPP (). In contrast, concentration of smaller EVs (Pa* and Pb* particles) was on the average lowest in blood with respect to EPP, PVRP, and PPP (). It appears that EVs are gradually forming from cells that are present in the sample. Due to their small size, such particles sediment slowly and are not very efficiently cleared from PPP in SpinEPP. Besides, chylomicrons and low density lipoproteins, which are also present in the sample and can be detected in the Pa* and Pb* FCM regions, are expected to accumulate in PPP.
Enrichment and recovery of P2 particles in PVRP
presents the average values of the enrichment and recovery of P2 particles EP2 and RP2, respectively). It can be seen () that each step increased EP2 and decreased RP2. SpinBlood was key for increase of EP2 of the whole procedure while both spins contributed more or less equally to the decrease of RP2.
Table II. Average Enrichment factor (E) and Recovery (R) of platelets and CVs (P2 particles) in SpinBlood, SpinEPP and in whole 2-step processing
Discussion
We have analyzed processing of blood by an acknowledged two-step centrifugation protocol [Citation8], which was used to treat chronic ear wounds. We found that the first step (centrifugation of blood) is crucial because settling of erythrocyte creates a counterflow of plasma which carries platelets and EVs in the direction opposite to the centrifugation force. With appropriate choice of CPs and centrifugation times this leads to enrichment of plasma in the upper part of the centrifugation tube (EPP) with platelets and EVs. We found that the protocol could be further improved by optimization of the time of centrifugation according to the physical properties of the sample (in our case represented by ESR). Centrifugation should be stopped at an appropriate time to allow the increase of concentration of platelets and EVs above the baseline blood level but prevent sedimentation of platelets from the plasma already cleared from erythrocytes. In the second step, EPP was centrifuged to sediment the platelets into the lower part of the tube and in this way further enrich that part in platelets. We have constructed a mathematical model to describe the redistribution of particles during both centrifugation steps and adjusted it with measurements on a population of blood samples. Using the model, we predicted an optimal centrifugation time for the first step which would yield maximal enrichment in EPP and full recovery of platelets and EVs for a blood sample with a given ESR. By using the model, the centrifugation time could be estimated for each patient individually to utilize particular blood sample better than by using a common protocol. We have shown that in the second centrifugation step (of EPP), the enrichment of the plasma in the lower part of the centrifugation tube (PVRP) in platelets and EVs depends on the volume of the inserted EPP, as it influences the strength of the centrifugation force that depends on the distance of the sample parts from the centrifuge rotor axis. Furthermore, we found evidence in support of the hypothesis that EVs may be generated during the processing of blood and its preparations.
Enrichment of EPP in P2 particles and recovery of P2 particles after spinBlood
In an analysis of SpinBlood we found that for certain choices of CPs, centrifugation times and temperatures, platelets and EVs do not settle due to the centrifugal force as expected - but move in the opposite direction. This flow causes an increase of their concentration in the part of the tube above the erythrocyte boundary (, ). A similar phenomenon was previously observed in concentrated inorganic multi-particle-type suspensions where the creeping flow considerably hindered sedimentation of particles [Citation22]. If species of particles in suspension greatly differ in density and size, the lighter and smaller particles are withdrawn into the flow opposite to the flow of the heavier and larger ones [Citation23].
The respective flows of erythrocytes and of platelets and EVs are mutually connected and depend on time and on the sedimentation path in a complex way () that is unique for a given sample. However, interdependence between VEPP and ESR () suggests that a sample-specific separation of particles in blood upon centrifugation can be predicted for an individual sample and that the time of centrifugation can be suitably adjusted based on the data on ESR. According to the model, this would be the time when the boundary of the sedimenting erythrocytes xb,ERC = xmin,Blood exp(τERC) (Eq.(SM2.25)) would meet the lower boundary of counter-flowing P2 particles xb,P2 = xmax.exp(-τERC) (Eq.(A2.26)) (see ). Taking into account the expression for τERC (Eq.(A2.15)) we obtain
Figure 5. The effect of centrifugation time on redistribution of blood constituents. A: Calculated positions of the upper boundary of erythrocytes xERC, upper boundary of P2 particles xupper b,P2 and lower boundary of P2 particles xlower b,P2 in dependence on centrifugation time (Eqs. (A2.25) and (A2.26), respectively). The model parameters were, xmax = 14 cm, LBlood = 6 cm, Ht = 0.4, αERC = 3.9 × 10⁻⁴ /s, αPLT = 2.5 × 10⁻⁵ /s. At time 0, xupper b,P2 and xb,ERC are at xmin,Blood and xlower b,P2 is at xmax. Due to the centrifugal force, erythrocytes move relatively fast compared to much smaller and lighter platelets and EVs. Erythrocyte boundary xb,ERC moves toward the bottom of the tube and eventually stops at the level determined by the Ht (dotted red line). The counterflow of fluid carries P2 particles in the direction opposite to the flow of erythrocytes. Starting from the bottom of the tube, the lower boundary of P2 particles (xlower b,P2) proceeds toward the erythrocyte boundary (xb,ERC). There is time interval in which enrichment of plasma in P2 particles EP2 is very high (indicated by the high EP2 window). xupper b,P2 moves toward the bottom of the tube at the rate determined by the size and shape of smaller particles. B: Enrichment of homogenized EPP in P2 particles EP2 and their recovery RP2 increases with time as long as platelets and EVs are pushed up by the settling erythrocytes. However, when erythrocytes eventually pack in the pellet and their movement ceases, platelets and EVs are no longer subjected to the drag of the erythrocyte counterflow. The centrifugal pull reverses their direction toward the bottom of the tube and their concentration in EPP decreases. EP2 and RP2 reach their maximum at optimal time TSpinBlood,opt. There is a relatively narrow time interval in which EP2 is very high (larger than 2). Recovery RP2 stays close to 1 in a relatively large time interval due to slow clearance of platelets and EVs from EPP. C: Scheme of the blood cell and EVs dynamics during centrifugation. Due to high concentration in blood, erythrocytes are subjected to direct interactions between each other, resulting in accelerated formation of erythrocyte- and plasma channels. Formation of roleaux increases erythrocyte sedimentation velocity. The arrows indicate the velocity vectors of erythrocytes, platelets and EVs. Erythrocytes closely pack at the bottom of the tube.
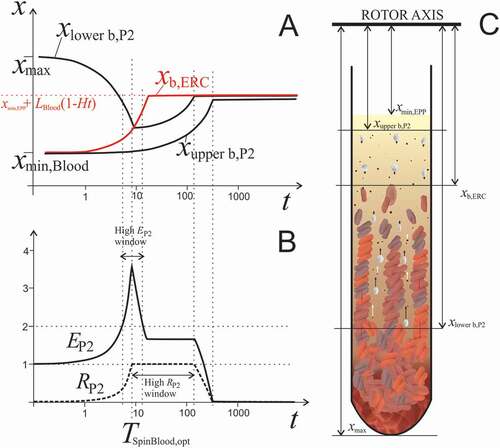
TSpinBlood,opt = xmax /(2 ε ESR X) ln(xmax/xmin,Blood) . (4)
TSpinBlood,opt estimated by the model for our cohort varied between 2.1 minutes and 58.8 minutes (15.3 minutes on average). Inserting the optimal time (Eq.(4)) into (Eq.(2)) yields
VEPP,opt = S((xmax xmin,Blood)1/2-xmin,Blood) (5)
which depends solely on the dimensions of the sample and the centrifuge rotor. In our case, VEPP was 2.1 mL, which was about twice the average volume of EPP obtained in experiment (VEPP = .98 mL, ). The respective optimal concentration of P2 particles is obtained by inserting the optimal time (Eq.(4)) into Eq.(3),
cP2,EPP,opt = cP2,Blood /(1-xmax/LBlood+(xmax xmin,Blood)1/2/LBlood) . (6)
Average calculated cP2,EPP,opt for our cohort was 463.109/L, which is about 15% more than obtained in experiment (399.109/L, ).
For a theoretical sample represented by parameters given in , EP2 and RP2 recovery at t = 5 min are smaller than the ones corresponding to the optimal time (around 9 minutes). In all samples but one, the time of centrifugation set by the protocol (5 min) was shorter than the optimal, so the volume of EPP was smaller than the predicted optimal one. The enrichment factor at TSpinBlood,opt is Eopt = 1/(1-xmax/LBlood+(xmax xmin,EPP)1/2/LBlood) and depends solely on the dimensions of the sample and centrifuge rotor. In our case EP2,opt = 2.33. Recovery in this case is predicted to be 100% since all platelets and EVs should accumulate in the department above the erythrocyte boundary that constitutes EPP. As the velocities of platelets and erythrocytes differ considerably, the window allowing very high RP2 is fairly wide (e.g., several minutes at CP of few hundred g). The time window allowing for gathering the plasma with very high EP2 (larger than 2) is considerably shorter. As up to 500 g centrifugation was found not to impair high platelet recovery, moderate increase of speed could be beneficially employed to decrease the processing time, with respect to the shorter and therefore more easily missed high EP2 time window.
Although the model is simple, it indicates that EP2 and RP2 of the particles could be significantly increased by adjusting the time of centrifugation to the individual sample. These indications however need to be validated in further studies considering variances in ESR and centrifugation setup.
Enrichment of EPP in P2 particles and recovery of P2 particles in spinEPP
In SpinEPP, platelets and EVs are pulled in the direction of the centrifugation force. In our samples, VEPP largely determined the volume of the final PVRP preparation (one half of the EPP) and the concentration of platelets and EVs in it. The concentration of platelets and EVs after SpinEPP (cP2,PVRP) depended on the distance of the sample from the rotor axis (xmin,EPP), that was imposed by the sample volume (). Smaller xmin,EPP meant smaller average centrifugal force acting on particles and in the given time, less of them reached the bottom half of the plasma sample to be included in PVRP.
Platelet activation and their possible pressing to the bottom of the tube may result in their aggregation. Flocculent PVRP was regularly observed in our samples. Impact of aggregation of platelets and EVs on the healing capacity of the preparation is not clear, but might be altered due to the loss of migration ability of particles and premature release of soluble active compounds discarded into PPP.
Concentrations of P2* particles in PVRP were found to decrease with longer processing time, while the concentrations of smaller particles Pa*+Pb* increased (). This is in agreement with previous results [Citation24] showing that prolonged handling time between blood collection and processing leads to an increase in the number of EVs, mostly of platelet-derived ones. Cooling of samples below the body temperature can be one of the causes for vesicle formation [Citation16]. The centrifugation – induced EVs formation can be deduced from higher generation of EVs in case of smaller sample volumes, where a larger portion of cells is exposed to a stronger centrifugation force as well as to the shear stress at the bottom of the tube. The experimental evidence on activated platelets and damaged erythrocytes observed by SEM () present arguments in favor of the hypothesis that EVs are formed from cells during the processing, mainly due to fragmentation of platelets [Citation16].
Effect of temperature on EPP
We have observed that temperature had considerable effect on concentration of P3 particles in EPP (, D). Lower temperature induces an increase of viscosity of the medium (which decreases velocities of all particles), platelet branching [Citation25] and affects erythrocyte association in rouleaux. If blood is diluted, ESR is reduced despite lower viscosity of the suspension, mainly because the direct interactions between erythrocytes are hindered [Citation26,Citation27]. Furthermore, previous studies have shown that platelet activation at room temperature does not trigger the release of α-granules [Citation26] meaning that such treatment does not cause premature release of growth factors. Concomitantly, platelet activation induces serotonin uptake from plasma and its storage in dense granules [Citation25], which may contribute to the regenerative effects of PVRP [Citation28].
Our analysis has shown that PVRP (prepared by the acknowledged protocol [Citation8]) that was administered to the patients, contained a considerable proportion of activated platelets ( and Figure A1.2.1 in the Appendix) that were likely the source of EVs produced during the processing of the samples. As the purpose of our work was an immediate use of the preparations for therapeutic purposes [Citation29], activation of platelets was considered favorable and its avoidance was not indicated. The results of accompanying clinical trial including 25 patients have shown favorable effects of PVRP prepared by the method used in our work, as regards remission of the size of the wounds and the quality of life of the patients (assessed by a questionnaire) comparing with the results of a classical treatment with the antibiotics [Citation29].
In studies of EV morphology, Arraud et al. (2014) reported that in cryo-EM images of plasma, platelets presented homogenously distributed organelles and no pseudopod extension [Citation30], which is characteristic of non-activated platelets [Citation31,Citation32]. These authors suggested that the procedures they used in preparing the samples for cryo-EM preparation did not induce platelet activation, and therefore that the various types of EVs observed in thus prepared platelet free plasma do not originate from artefactually activated cells [Citation30]. However, cryo-EM images have shown that platelet activation induced formation of EVs with tubular morphology which was not observed in samples with non-activated platelets [Citation33]. Appearance of tubular vesicles in our SEM images of PVRP (), therefore presents further evidence that the platelets in our blood preparations were activated.
As concentration of platelets and EVs in EPP can be higher than in blood and in order to keep the possibility of contamination of samples during processing as low as possible, one-step procedure may be considered as the more favorable for preparation of therapeutic plasma than a two-step procedure.
Limitations of the study
The study was performed as a companion to the clinical trial and was therefore based upon an acknowledged protocol from the clinical practice [Citation8]. SpinBlood yielded different volumes of EPP for different patients which had to be considered in SpinEPP. The samples were not leveled, as blood and PVRP were considered precious for treatment. Neither collection of excessive volumes of blood, nor division of plasma into several tubes seemed rational, as the latter could result in higher loss of platelets and EVs due to the sticking to the surface of the tubes and pipette tips.
Following the dynamics of patient admission, the study took place in the time interval of about two years. Change of some logistics and availability of material is reflected in different numbers of measurements of the parameters (see the table of raw data in the Appendix, part A4). Therefore, in , we show only the results of the correlations in which the number of samples N was larger than 20. N is reported for each correlation coefficient.
In our study, particles were evaluated based on their light scattering properties. However, it was shown that a significantly larger amount of EVs was detected when fluorescence triggering was used instead of light-scatter triggering [Citation34–37]. The limit of detection of EVs in FCM can be substantially lowered using fluorescent probes, which can also be employed to provide additional information about particle phenotype.
The FCM measurement of particle concentration encounters events and cannot account for aggregation of particles. Furthermore, the number of P2 particles in samples is not conserved due to fragmentation of cells and EVs ex vivo. The number of P2 particles in PVRP therefore did not equal the difference between the number of P2 particles in EPP and the number of P2 particles in PPP.
pH and therefrom the effect of different anticoagulants has been shown to impact on the yield of EVs from blood derived products [Citation24,Citation38–40]. However, in the present study only citrated samples of blood were included. Possible impacts of different anticoagulants on the principles presented should be given attention in further optimization of the procedures.
Mathematical model is an important tool for interpretation of measurements. It provides insight into the mechanism why and how parameters influence the quantities of interest. For example, based on the model, the CP and the time of centrifugation can be estimated for an individual sample (Equation (4)) for which the highest yield of platelets and/or EVs can be expected (Equation (6)). The model was constructed based on the experimental part of this study, which was set by a previously used protocol that was equal for all samples [Citation8]. It was however observed during the study that the volumes of EPP obtained by the same CP and time of centrifugation of blood differed considerably although the hematocrit values of the samples did not vary much. This indicated that the efficiency of centrifugation could be increased by individualization of the centrifuge setting. To achieve the optimal setting, the model is necessary. In the future, a prospective clinical study should be made to validate the prediction and possibly imply improvements in the model to finally get to a practical advice (a formula or a computer application) how to determine CP and the centrifugation time in clinical practice for a given sample, based on the results of the standard laboratory blood test.
The phenomena taking place during centrifugation of blood are complex [Citation41,Citation42]. The prediction of particle concentration change with space and time in the final preparation is further complicated by the lack of precision in separation of PPP from PVRP (relevant when cells are not completely sedimented), by retention of platelets and EVs on the walls of the tube, and floatation of platelets in lipemic samples [Citation43]. Platelets in particular exhibit wide size and density distribution and can adopt heterogeneous topology changing with various factors e.g. temperature. Their shape is not spherical as assumed in the Stokes resistance law. Blood plasma viscosity is rarely examined as a part of standard blood tests and its variance was neglected also in this work. In acceleration and deceleration of the centrifugation, the tubes are in general not in the horizontal position, therefore, the actual path of the cells is not a straight line and its shape is not the same for cells in different initial positions. Describing these phenomena by formalism of continuous media would lead to a system of nonlinear partial differential equations which could be solved by numerical methods. However, as the material constants and detailed features on individual samples that should be included are inaccessible, a compromise was sought to put forward the most relevant general features and keep the model simple enough to be transparent. The model is phenomenological in its essence and cannot account for phenomena that were not observed in experiments. However, it enables focusing at the features which would otherwise remain obscure due to large scattering of the experimental data.
The interval of estimated optimal times for centrifugation (Eq. (4)) for the patients that were involved in the study was between 2 minutes and 1 hour which seems rather large. The next step in the study would be to validate this prediction with respect to EP2 and RP2 and strive to apply the model in preparing an individualized and optimized medicine. The results are expected to be applicable in different fields of medicine.
Conclusions
We have found that a single spin of blood at conveniently set CP and centrifugation time can induce an increase of the concentration of platelets and EVs in EPP that is high enough to merit the criteria for moderately concentrated PVRP by the PAW classification [Citation44]. Based on the model description and our experimental data, we suggest the expression for the optimal time of centrifugation of blood (depending on the data on ESR) that would give highest enrichment of plasma in platelets and extracellular vesicles and their full recovery for an individual sample, and produce PVRP by a single centrifugation. We provide further evidence that EVs are being produced during the processing of samples. Monitoring of EVs in the samples could be used also as an indicator of cell activation/degradation. The impact of EVs on healing power of PVRP preparations would need further examination as it was indicated that they exhibit significant biological activity [Citation29,Citation45,Citation46] and might be even more potent in healing than the intact platelets [Citation47].
Author contributions
D.B., D.V., M.H., M.J., Z.J., M.P., and L.P. performed experiments; V.K.I., D.B. and A.I. developed and elaborated the mathematical model; D.B, V.K.I., M.H., M.J., Z.J., M.P., S.B. and L.P. analyzed results; D.B., V.K.I., D.V., S.B. and A.I. designed the research; D.B. and V.K.I. wrote the paper, all authors critically read and edited the manuscript. The weight of the contributions of V.K.I and S.B. are considered equal.
Revised_Graphical_abstract_Bozic.jpg
Download JPEG Image (735.5 KB)
Revised_Appendix_Bozic.pdf
Download PDF (592.8 KB)Revised_SM_data_Bozic.pdf
Download PDF (502.5 KB)Supplemental data
Supplemental data for this article can be accessed on the publisher’s website.
Disclosure statement
The authors report no conflict of interest.
Additional information
Funding
Related Research Data
References
- De Pascale MR, Sommese L, Casamassimi A, Napoli C. Platelet derivatives in regenerative medicine: an update. Transfus Med Rev 2015;29(1):52–61. DOI:10.1016/j.tmrv.2014.11.001.
- Arora NS, Ramanayake T, Ren Y-F, Romanos GE. Platelet-rich plasma: a literature review. Implant Dent 2009;18(4):303–310. DOI:10.1097/ID.0b013e31819e8ec6.
- Etulain J, Mena HA, Meiss RP, Frechtel G, Gutt S, Negrotto S, Schattner M. An optimised protocol for platelet-rich plasma preparation to improve its angiogenic and regenerative properties. Sci Rep 2018;8(1):1513. DOI:10.1038/s41598-018-19419-6.
- Jean-François Kaux JF, Emonds-Alt T. The use of platelet-rich plasma to treat chronic tendinopathies: a technical analysis. Platelets 2018;29(3):213–227. DOI:10.1080/09537104.2017.1336211.
- Anitua E, Fernández-de-Retana S, Alkhraisat MH. Platelet rich plasma in oral and maxillofacial surgery from the perspective of composition. Platelets 2021;32(2):174–182. DOI:10.1080/09537104.2020.1856361.
- Everts PA, van Erp A, DeSimone A, Cohen DS, Gardner RD. Platelet rich plasma in orthopedic surgical medicine. Platelets 2021;32(2):163–174. DOI:10.1080/09537104.2020.1869717.
- Lim L, Bui H, Farrelly O, Yang J, Li L, Enis D, Ma W, Chen M, Oliver G, Welsh JD, et al. Hemostasis stimulates lymphangiogenesis through release and activation of VEGFC. Blood 2019;134(20):1764–1775. DOI:10.1182/blood.2019001736.
- Amable P, Carias RB, Teixeira MV, da Cruz Pacheco Í, Corrêa do Amaral RJ, Granjeiro J, Borojevic R. Platelet-rich plasma preparation for regenerative medicine: optimization and quantification of cytokines and growth factors. Stem Cell Res Ther 2013;4(3):67. DOI:10.1186/scrt218.
- Jo CH, Roh YH, Kim JE, Shin S, Yoon KS. Optimizing platelet-rich plasma gel formation by varying time and gravitational forces during centrifugation. J Oral Implantol 2013;39(5):525–532. DOI:10.1563/AAID-JOI-D-10-00155.
- Perez AGM, Lana JFSD, Rodrigues AA, Luzo AC, Belangero WD, Santana MH. Relevant aspects of centrifugation step in the preparation of platelet-rich plasma. ISRN Hematol 2014;2014:1–8. DOI:10.1155/2014/176060.
- Yin W, Xu H, Sheng J, Sheng J, Zhu Z, Jin D, Hsu P, Xie X, Zhanget C. Optimization of pure platelet-rich plasma preparation: a comparative study of pure platelet-rich plasma obtained using different centrifugal conditions in a single-donor model. Exp Ther Med 2017;14(3):2060–2070. DOI:10.3892/etm.2017.4726.
- Araki J, Jona M, Eto H, Aoi N, Kato H, Suga H, Doi K, Yatomi Y, Yoshimura K. Optimized preparation method of platelet-concentrated plasma and noncoagulating platelet-derived factor concentrates: maximization of platelet concentration and removal of fibrinogen. Tissue Eng Part C Methods 2012;18(3):176–185. DOI:10.1089/ten.TEC.2011.0308.
- Harrison TE, Bowler J, Levins TN, Cheng AL, Reeves KD. Platelet yield and yield consistency for six single-spin methods of platelet rich plasma preparation. Platelets 2020;31(5):661–666. DOI:10.1080/09537104.2019.1663808.
- Harrison P, Alsousou J. Studies on platelet rich plasma - new editorial policy for “Platelets.” Platelets 2020;31(3):281–282. DOI:10.1080/09537104.2020.1729013.
- Melki I, Tessandier N, Zufferey A, Boilard E. Platelet microvesicles in health and disease. Platelets 2017;28(3):214–221. DOI:10.1080/09537104.2016.1265924.
- Sustar B-Z, Stukelj FM, Bobojevic G, Jansa R, Ogorevc E, Kruljc P, Mam K, Simunic B, Mancek-Keber M, Jerala R, et al. Nanoparticles isolated from blood: a reflection of vesiculability of blood cells during the isolation process. Int J Nanomedicine 2011:2737. DOI:10.2147/IJN.S24537.
- Bozic D, Hocevar M, Kononenko V, Jeran M, Stibler U, Fiume I, Pajnic M, Paden L, Kogej K, Drobne D, et al. Pursuing mechanisms of extracellular vesicle formation. Effects of sample processing. Adv Biomembr Lipid Self-Assembly 2020;32:113–155. DOI:10.1016/bs.abl.2020.09.003.
- Sustar V, Bedina-Zavec A, Stukelj R, Frank M, Ogorevc E, Jansa R, Mam K, Veranic P, Kralj-Iglič K-IV. Post - prandial rise of microvesicles in peripheral blood of healthy human donors. Lipids Health Dis 2011;10(1):47. DOI:10.1186/1476-511X-10-47.
- Fedorov A, Kondratov K, Kishenko V, Mikhailovskii V, Kudryavtsev I, Belyakova M, Sidorkevich S, Vavilova T, Kostareva A, Sirotkina O, et al. Application of high-sensitivity flow cytometry in combination with low-voltage scanning electron microscopy for characterization of nanosized objects during platelet concentrate storage. Platelets 2020;31(2):226–235. DOI:10.1080/09537104.2019.1599337.
- Horstman L. Platelet microparticles: a wide-angle perspective. Crit Rev Oncol Hematol 1999;30(2):111–142. DOI:10.1016/s1040-8428(98)00044-4.
- Gamonet C, Desmarets M, Mourey G, Biichle S, Aupet S, Laheurte C, François A, Resch E, Bigey F, Binda D, et al. Processing methods and storage duration impact extracellular vesicle counts in red blood cell units. Blood Advances 2020;4(21):5527–5539. DOI:10.1182/bloodadvances.2020001658.
- Major JJ. Hindered settling. In: Middleton G, Church MJ, Coniglio M, Hardie JK, Longstaffe FJ, editors. Encyclopedia of sediments and sedimentary rocks. Springer, Netherlands, 2003:358–360.
- Phillips CR, Smith TN. Modes of settling and relative settling velocities in two-species suspensions. Ind Eng Chem Fundam 1971;10(4):581–587. DOI:10.1021/i160040a007.
- Lacroix R, Judicone C, Poncelet P, Robert S, Arnaud L, Sampol J, Dignat-George F. Impact of pre-analytical parameters on the measurement of circulating microparticles: towards standardization of protocol. J Thromb Haemost 2012;10(3):437–446. DOI:10.1111/j.1538-7836.2011.04610.x.
- Maurer-Spurej E, Pfeiler G, Maurer N, Lindner H, Glatter O, Devine DV. Room temperature activates human blood platelets. Lab Invest 2001;81(4):581–592. DOI:10.1038/labinvest.3780267.
- Taye MA. Sedimentation rate of erythrocyte from physics prospective. Eur Phys J E 2020;43(3):19. DOI:10.1140/epje/i2020-11943-2.
- Pribush A, Meyerstein D, Meyerstein N. The mechanism of erythrocyte sedimentation. Part 1: channeling in sedimenting blood. Colloids Surf B Biointerfaces 2010;75(1):214–223. DOI:10.1016/j.colsurfb.2009.08.036.
- Sadiq A, Shah A, Jeschke MG, Belo C, Qasim Hayat M, Murad S, Amini-Nik S. The role of serotonin during skin healing in post-thermal injury. Int J Mol Sci 2018;19(4):1034. DOI:10.3390/ijms19041034.
- Vozel D, Božič D, Jeran M, Jan Z, Pajnič M, Pađen L, Kralj-Iglič V, Battelino S. The role of platelet-and extracellular vesicle-rich plasma in the treatment of temporal bone cavity inflammation: a randomized controlled trial. Proceedings of the 3.rd International Symposium Socratic Lectures, Ljubljana, Slovenia; 2020; 41–52. Available from: https://www.zf.uni-lj.si/si/publikacije-avtorji/zore-anamarija/sokratska-predavanja-2020
- Arraud N, Linares R, Tan S, Gounou C, Pasquet JM, Mornet S, Brisson AR. Extracellular vesicles from blood plasma: determination of their morphology, size, phenotype and concentration. J Thromb Haemost 2014;12(5):614–627. DOI:10.1111/jth.12554.
- Morgenstern E. Human platelet morphology/ultrastructure. In: von Bruchhausen F, Walter U, editors. Platelets and their factors. Berlin Heidelberg: Springer; 1997:27–60.
- White JG. Chapter 3 – platelet structure. In: Alan D, Michelson MD, editors. Platelets. 2nd ed. Burlington: Academic Press; 2007:45–73.
- Brisson AR, Tan S, Linares R, Gounou C, Arraud N. Extracellular vesicles from activated platelets: a semiquantitative cryo-electron microscopy and immuno-gold labeling study. Platelets 2017;28(3):263–271. DOI:10.1080/09537104.2016.1268255.
- Nolan JP, Stoner SA. A trigger channel threshold artifact in nanoparticle analysis. Cytometry A 2013;83(3):301–305. DOI:10.1002/cyto.a.22255.
- Stoner SA, Duggan E, Condello D, Guerrero A, Turk JR, Narayanan PK, Nolan JP. High sensitivity flow cytometry of membrane vesicles. Cytometry A 2016;89(2):196–206. DOI:10.1002/cyto.a.22787.
- Arraud N, Gounou C, Linares R, Brisson AR. A simple flow cytometry method improves the detection of phosphatidylserine-exposing extracellular vesicles. J Thromb Haemost 2015;13(2):237–247. DOI:10.1111/jth.12767.
- Arraud N, Gounou C, Turpin D, Brisson AR. Fluorescence triggering: a general strategy for enumerating and phenotyping extracellular vesicles by flow cytometry. Cytometry A 2016;89(2):184–195. DOI:10.1002/cyto.a.22669.
- Piccin A, Murphy WG, Smith OP. Circulating microparticles: pathophysiology and clinical implications. Blood Rev 2007;21(3):157–171. DOI:10.1016/j.blre.2006.09.001.
- Palviainen M, Saraswat M, Varga Z, Kitka D, Neuvonen M, Puhka M, Joenväärä S, Renkonen R, Nieuwland R, Takatalo M, et al. Extracellular vesicles from human plasma and serum are carriers of extravesicular cargo-Implications for biomarker discovery. PLoS One 2020;15(8):e0236439. DOI:10.1371/journal.pone.0236439.
- Getaneh Z, Ayelgn F, Asemahegn G, Geleta H, Yalew A, Melak T. A comparison of erythrocyte sedimentation rates of bloods anticoagulated with trisodium citrate and EDTA among TB presumptive patients at the University of Gondar comprehensive specialized hospital, northwest Ethiopia. BMC Res Notes 2020;13(1):113. DOI:10.1186/s13104-020-04963-0.
- Piao L, Park H, Jo CH. Theoretical prediction and validation of cell recovery rates in preparing platelet-rich plasma through a centrifugation. PLOS ONE 2017;12(11):e0187509. DOI:10.1371/journal.pone.0187509.
- Rikkert LG, Coumans FAW, Hau CM, Terstappen LWMM, Nieuwland R. Platelet removal by single-step centrifugation. Platelets 2020:1–4. DOI:10.1080/09537104.2020.1779924.
- Saleh JW, Hashim SA. Altered sedimentation behavior and ultrastructure of platelets in hyperlipidemia. Circulation 1974;50(5):880–886. DOI:10.1161/01.cir.50.5.880.
- DeLong JM, Russell RP, Mazzocca AD. Platelet-rich plasma: the PAW classification system. J Arthrosc Relat Surg 2012;28(7):998–1009. DOI:10.1016/j.arthro.2012.04.148.
- Campanella C, Caruso Bavisotto C, Logozzi M, Marino Gammazza A, Mizzoni D, Cappello F, Fais S. On the choice of the extracellular vesicles for therapeutic purposes. Int J Mol Sci 2019;20(2):236. DOI:10.3390/ijms20020236.
- Van Der Pol E, Harrison P. From platelet dust to gold dust: physiological importance and detection of platelet microvesicles. Platelets 2017;28(3):211–213. DOI:10.1080/09537104.2017.1282781.
- Tao S-C, Guo S-C, Zhang C-Q. Platelet-derived extracellular vesicles: an emerging therapeutic approach. Int J Biol Sci 2017;13(7):828–834. DOI:10.7150/ijbs.19776.