
Abstract
Citrate is the recommended anticoagulant for studies on plasma extracellular vesicles (EVs). Because citrate incompletely blocks platelet activation and the release of platelet-derived EVs, we compared EDTA and citrate in that regard. Blood from healthy individuals (n = 7) was collected and incubated with thrombin receptor-activating peptide-6 (TRAP-6) to activate platelets, subjected to pneumatic tube transportation (n = 6), a freeze-thaw cycle (n = 10), and stored before plasma preparation (n = 6). Concentrations of EVs from platelets (CD61+), activated platelets (P-selectin+), erythrocytes (CD235a+), and leukocytes (CD45+) were measured by flow cytometry. Concentrations of EVs from platelets and activated platelets increased 1.4-fold and 1.9-fold in EDTA blood upon platelet activation, and 4.2-fold and 9.6-fold in citrate blood. Platelet EV concentrations were unaffected by pneumatic tube transport in EDTA blood but increased in citrate blood, and EV concentrations of erythrocytes and leukocytes were comparable. The stability of EVs during a freeze-thaw cycle was comparable for both anticoagulants. Finally, the concentration of platelet EVs was stable during storage of EDTA blood for six hours, whereas this concentration increased 1.5-fold for citrate blood. Thus, EDTA improves the robustness of studies on plasma EVs.
Introduction
Extracellular vesicles (EV) are membrane-enclosed cell-derived particles released from various cells to body fluids, including blood [Citation1,Citation2]. EVs have become a subject of increasing interest in the last decade due to their role in physiological and pathological processes including thrombosis, inflammation and vascular injury [Citation3]. To develop blood EV-based biomarkers, reliable and reproducible protocols for blood collection and handling are essential. Current guidelines recommend the use of citrate as an anticoagulant to measure the concentrations of blood-derived EVs [Citation4–6], and citrate was also the anticoagulant of choice in interlaboratory comparison studies in which the concentration of platelet EVs was measured in provided plasma samples by flow cytometry [Citation7,Citation8]. Citrate incompletely suppresses platelet activation, aggregation and the release of platelet EVs during blood collection and handling, and, consequently, the concentration of platelet EVs measured in citrate-anticoagulated blood and plasma derived from this blood does not reflect their true in vivo concentration [Citation1,Citation9]. Hence, an alternative “anticoagulant” is required that efficiently blocks platelet activation, aggregation and the release of platelet EVs, to enable the establishment of biobanks dedicated to unbiased EV-based biomarker research.
Ethylenadiaminetetraacetic acid (EDTA) inhibits both platelet aggregation and the release of platelet EVs [Citation9–11] and we therefore hypothesized that EDTA is a better anticoagulant than citrate to stabilize the concentration of platelet EVs during and after blood collection [Citation12–14]. We performed a head-to-head comparison study in which the efficacy of EDTA to stabilize the number of EVs was compared to citrate [Citation4,Citation6].
Materials and methods
To study the release of platelet EVs upon platelet activation, the EV concentrations were measured directly in blood to which thrombin receptor-activating peptide 6 (TRAP-6) was added to activate platelets. To mimic the conditions leading to platelet activation during blood collection and handling, blood was also subjected to pneumatic tube transport and prolonged storage time of collected blood on the lab bench before plasma preparation. EV concentrations were measured before and after a single freeze-thaw cycle to compare the stability of EVs in citrate and EDTA. Apart from the TRAP-6 stimulation experiment, all other EV measurements were performed in plasma.
Blood collection and plasma preparation
Blood from healthy individuals was collected in plastic vacuum tubes (2.7 mL trisodium citrate; final concentration 0.109 mol/L, and 4.0 mL K2EDTA 7.2 mg, BD Vacutainer®, US) via antecubital venipuncture using a 21-Gauge needle. The first 2 mL of blood were discarded. The Ethical Review Board of Amsterdam UMC, location AMC, has stated that collection of blood from healthy volunteers for preclinical research is not subjected to the WMO (the Medical Research Involving Human Subject Act). Hence, no additional approval was required from the Ethical Review Board. All procedures involving human participants were in accordance with the Declaration of Helsinki and with informed consent. Where indicated, (cell-depleted) plasma was prepared according to ISTH guidelines by double centrifugation (Rotina 380 R, Hettich Zentrifugen, Germany) at 2,500 g for 15 minutes at 20°C, acceleration speed 9, no brake [Citation5,Citation6]. The first centrifugation step was done in the blood collection tube, after which the plasma was collected by aspiration to 10 mm above the buffy coat, transferred to a new 13 mL plastic tube (Greiner Bio-One GmbH, Austria) and mixed by pipetting. After the second centrifugation step, plasma was collected to 10 mm above the bottom, transferred into a 1.5 mL Eppendorf (Thermo Fisher Scientific) and mixed by pipetting. If needed, plasma was transferred to 1.5 mL micro tubes (Sarstedt AG & Co. KG, Germany), frozen in liquid nitrogen and stored at −80°C until analysis.
EV concentration measurement
The concentrations of EVs derived from platelets (CD61+), activated platelets (P-selectin+), erythrocytes (CD235a+), and leukocytes (CD45+) were determined by flow cytometry (A60-Micro, Apogee Flow Systems, UK). EV concentrations show the number of particles (i) exceeding the side scatter or forward scatter threshold, (ii) having a diameter <1,000 nm, and (iii) exceeding the fluorescent threshold corresponding to the used labels, per mL of whole blood or plasma. EV concentrations were corrected for hemodilution by citrate. For labeling, 20 μL of sample, pre-diluted in Dulbecco’s phosphate buffered saline (DPBS), was incubated with 2.5 μL of antibodies or isotype controls and kept in the dark for 1 hour at room temperature. To decrease background fluorescence by unbound reagents upon measuring, we added 200 μL DPBS. Custom-build software (MATLAB R2018b, MathWorks, US) was applied to automate data calibration and processing. Fluorescence signals were calibrated and expressed as units of molecules of equivalent fluorochromes, side scattering was related to the diameter of EVs in nm using Rosetta Calibration (Exometry, The Netherlands) [Citation15], and the flow rate was calibrated using ApogeeMix (Apogee flow systems, UK). The experiments fulfill the criteria of the framework for standardized reporting of EV flow cytometry experiments, MIFlowCyt-EV, which incorporates the latest MISEV guidelines [Citation16,Citation17]. The MIFlowCyt-EV, containing all details required to reproduce the experiments, can be found in the online supplemental material and is, together with data files, available via Figshare (https://doi.org/10.6084/m9.figshare.c.4753676). Finally, it should be mentioned that although fluorescence-based triggering results in a higher sensitivity for some flow cytometers [Citation18,Citation19], for our flow cytometer and under the given measurement conditions, fluorescence and scatter-based triggering result in similar sensitivity [Citation20].
TRAP-induced platelet activation
Whole blood samples from healthy donors (n = 7) were incubated at room temperature for 30 minutes with TRAP-6 (SFLLRN; Bachem, Switzerland; final concentration 30 μmol/L) to activate platelets. Flow cytometry measurements were performed in diluted blood samples as described in the previous paragraph.
Pneumatic tube transport
Four blood tubes (2x citrate and 2x K2EDTA) were collected from healthy donors (n = 6). From each donor, a citrate-anticoagulated and an EDTA-anticoagulated blood sample were transported manually to the lab in vertical position, while the other tubes were transported by a pneumatic tube system. The blood collection tubes from each donor were centrifuged simultaneously and EV concentrations were measured in plasma.
Freeze-thaw cycle
To examine the stability of the EVs during a single freeze-thaw cycle, concentrations of EVs were measured in plasma samples (n = 10) before and after snap-freezing in liquid nitrogen, storage at −80°C, and thawing at 37°C.
Time between blood collection and centrifugation
Six healthy donors each donated 9 citrate and 9 EDTA blood tubes. Blood samples were stored for 6 hours, 24 hours, 48 hours or 168 hours at both room temperature and at 4°C until plasma preparation by centrifugation. Plasma was prepared after the aforementioned time intervals, and plasma aliquots were snap-frozen in liquid nitrogen and stored at −80°C until analysis.
Statistical analysis
IBM SPSS Statistics was used for statistical analysis (version 26.0 IBM, US). Data are presented as median and interquartile range. Wilcoxon Signed Rank tests were used to compare the concentrations of EVs. A p value < .05 was considered statistically significant. If measurements were performed in duplicate, the average value was taken for the analysis.
Results
TRAP-induced platelet activation
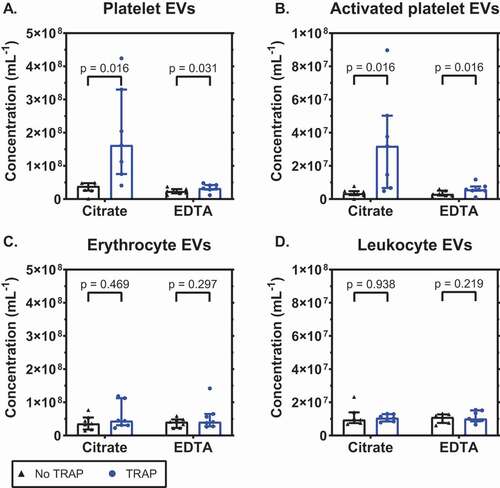
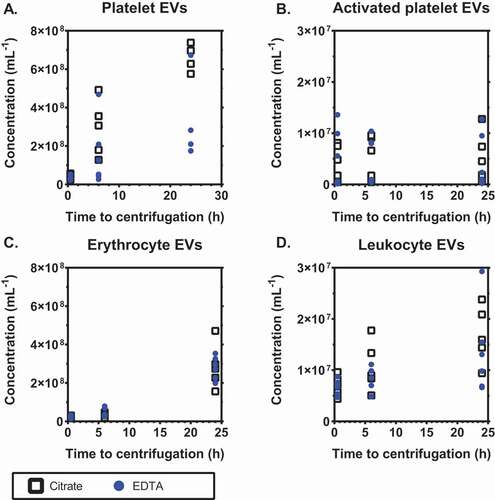
To compare the release of EVs from platelets in citrate- and EDTA-anticoagulated blood, platelets were activated using TRAP-6. After activation, concentrations of EVs were measured directly in blood. shows that the baseline concentrations of platelet EVs (CD61+) were comparable in citrate and EDTA (p = .109; 1A). Upon activation with TRAP-6, these concentrations increased 4.2-fold in citrate blood (p = .016) and 1.4-fold in EDTA blood (p = .031). Thus, the increase in the concentration of platelet EVs is reduced in EDTA compared to citrate (p = .016). Similarly, the concentrations of EVs from activated platelets (P-selectin+) were comparable at baseline (p = .469; 1B). Upon activation the concentration increased 9.6-fold in citrate (p = .016) and 1.9-fold in EDTA (p = .016), and again the concentration was lower in EDTA compared to citrate (p = .031). The ability of the anticoagulants to inhibit the release of EVs upon platelet activation is platelet-specific, because the concentrations of EVs from erythrocytes and leukocytes were comparable in citrate and EDTA, and unaffected upon activation by TRAP-6 (p > .05; 1C, 1D).
Figure 1. EDTA inhibits the release of extracellular vesicles from platelets upon platelet stimulation. Concentrations of extracellular vesicles (EVs) in whole blood anticoagulated with citrate or ethylenediaminetetraacetic acid (EDTA), with or without thrombin receptor-activating peptide 6 (TRAP-6; final concentration 30 μM), measured with flow cytometry, from A: platelets (CD61+); B: activated platelets (P-selectin+); C: erythrocytes (CD235a+); D: leukocytes (CD45+). Concentrations show the number of particles (i) exceeding the side scatter or forward scatter threshold (ii) having a diameter <1,000 nm, and (iii) exceeding the fluorescent threshold corresponding to the used labels, per mL of whole blood (n = 7).
Pneumatic tube transport
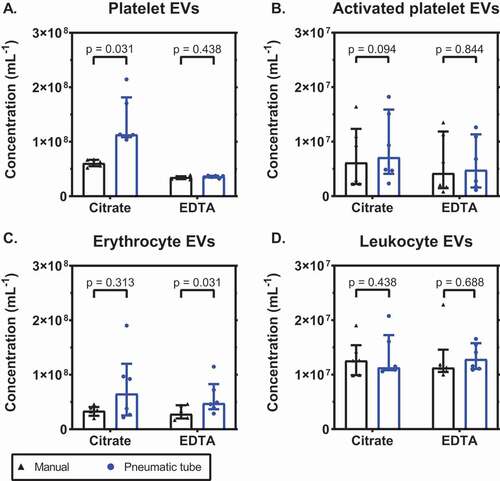
To investigate the influence of mechanical-induced platelet activation, we determined the plasma concentrations of EVs in citrate and EDTA-anticoagulated blood after both manual and pneumatic tube transport. shows that the plasma concentration of platelet EVs increased most in citrate for both manual and pneumatic tube transport (p = .031 for both; 2A). After pneumatic tube transport, the concentration of platelet EVs increased 1.9-fold compared to manual transport in citrate (p = .031), but was unaffected in EDTA (p = .438). The concentration of EVs from activated platelets was comparable in both anticoagulants (p = .063 for manual and p = .094 for pneumatic transport; 2B), and also between the two transportation methods (p = .094 for citrate and p = .844 for EDTA). Pneumatic tube transport did not affect the concentration of erythrocyte EVs in citrate-anticoagulated blood (p = .313; 2C), but in EDTA-anticoagulated blood the concentration increased (p = .031). The concentration of leukocyte EVs was comparable for both anticoagulants and unaffected by transportation (p > .05 for all; 2D).
Figure 2. EDTA inhibits the release of extracellular vesicles from platelets upon pneumatic tube transport. Concentrations of extracellular vesicles (EVs) in plasma anticoagulated with citrate or EDTA, after either manual or pneumatic tube transport, from A: platelets (CD61+); B: activated platelets (P-selectin+); C: erythrocytes (CD235a+); D: leukocytes (CD45+). Concentrations show the number of particles (i) exceeding the side scatter or forward scatter threshold (ii) having a diameter <1,000 nm, and (iii) exceeding the fluorescent threshold corresponding to the used labels, per mL of plasma (n = 6).
Freeze-thaw cycle
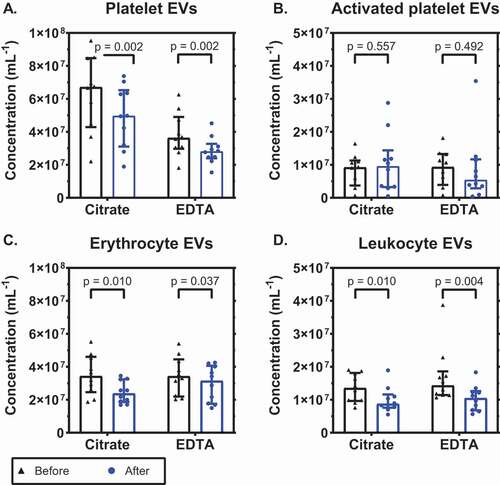
Next, we compared the stability of EVs in citrate plasma and EDTA plasma during a single freeze-thaw cycle. shows that there was a comparable decrease in the concentration of platelet EVs in both anticoagulants: 26% in citrate (p = .002; 3A) and 23% in EDTA (p = .002). The concentration of EVs from activated platelets after a freeze-thaw cycle was comparable in citrate and EDTA and did not change significantly (p = .557 and p = .492, respectively; 3B). The concentration of erythrocyte EVs decreased by 31% in citrate (p = .010; 3C) and with 8% in EDTA (p = .037). The concentration of leukocyte EVs decreased with 36% in citrate and with 27% in EDTA (p = .010 and p = .004, respectively; 3D). In conclusion, citrate and EDTA are comparable regarding the stability of EVs during a freeze-thaw cycle.
Figure 3. Concentrations of extracellular vesicles before and after a freeze-thaw cycle. Concentrations of extracellular vesicles (EVs) in citrate- and EDTA-anticoagulated plasma before and after a freeze-thaw cycle from A: platelets (CD61+); B: activated platelets (P-selectin+); C: erythrocytes (CD235a+); and D: leukocytes (CD45+). Concentrations show the number of particles (i) exceeding the side scatter or forward scatter threshold (ii) having a diameter <1,000 nm, and (iii) exceeding the fluorescent threshold corresponding to the used labels, per mL of plasma (n = 10).
Time between blood collection and centrifugation
Finally, we compared the effects of citrate and EDTA on the plasma EV concentrations during storage of blood at room temperature () or at 4°C (). At the indicated times, blood was centrifuged to prepare plasma, frozen and stored as described in Methods until measurement. When stored at room temperature for 6 hours, the concentration of platelet EVs increased 1.5-fold (p = .031) in citrate- and was fairly stable in EDTA-anticoagulated plasma with an increase of only 1.1-fold (p = .438; 4A). The concentration of platelet EVs increased in both anticoagulants when stored for 24 hours. In both anticoagulants, the concentrations of EVs from activated platelets and leukocytes were stable during 6 hours of storage (p > .05) but the concentration of erythrocyte EVs increased 1.3-fold (p = .031) in EDTA-anticoagulated plasma after 6 hours of storage ().
Figure 4. Stability of concentrations of extracellular vesicles upon storage of blood at room temperature. Concentrations of extracellular vesicles (EVs) in plasma prepared from blood stored for different time intervals at room temperature (i.e. before centrifugation to prepare plasma), from A: platelets (CD61+); B: activated platelets (P-selectin+); C: erythrocytes (CD235a+); D: leukocytes (CD45+). Tubes were standing in a vertical position at room temperature until centrifugation. Concentrations show the number of particles (i) exceeding the side scatter or forward scatter threshold (ii) having a diameter <1,000 nm, and (iii) exceeding the fluorescent threshold corresponding to the used labels, per mL of plasma (n = 6).
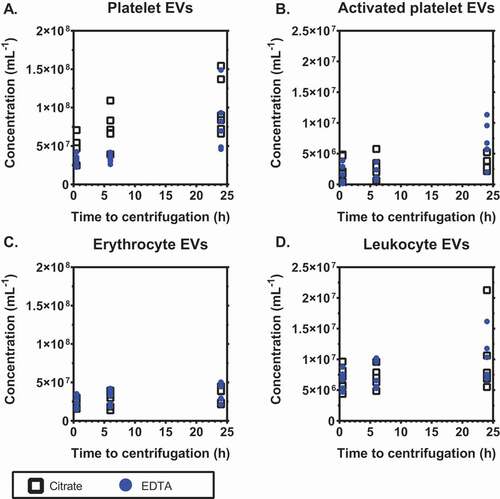
Figure 5. Stability of concentrations of extracellular vesicles upon storage of blood at 4°C. Concentrations of extracellular vesicles (EVs) in citrate- and EDTA-anticoagulated plasma when blood tubes were stored in a vertical position for different time intervals at 4°C (i.e. before centrifugation to prepare plasma), from A: platelets (CD61+); B: activated platelets (P-selectin+); C: erythrocytes (CD235a+); D: leukocytes (CD45+). Concentrations show the number of particles (i) exceeding the side scatter or forward scatter threshold (ii) having a diameter <1,000 nm, and (iii) exceeding the fluorescent threshold corresponding to the used labels, per mL of plasma (n = 6).
When blood samples were stored for 6 hours at 4°C, the concentration of platelet EVs increased 10.4-fold (p = .031) in citrate and 5.4-fold (p = .094) in EDTA, and these concentrations increased further during 24 hours of storage (p = .031 for both anticoagulants; 5A). The concentration of EVs from activated platelets was comparable at all timepoints in both anticoagulants (5B). When stored for 6 hours at 4°C, the concentration of erythrocyte EVs was fairly stable in citrate (1.5-fold increase, p = .094) but increased 2.3-fold in EDTA (p = .031; 5C). The concentration of leukocyte EVs increased 1.6-fold in citrate (p = .031) during 6 hours of storage at 4°C, but was fairly stable in EDTA (1.2-fold increase, p = .469; 5D).
Results of blood samples centrifuged after 48 and 168 hours are added to Supplement 1 (available via the online supplemental material).
Discussion
To establish reliable biorepositories for EV research in multicenter clinical studies, ideally the concentrations of EVs in collected plasma samples should be similar to their in vivo concentrations. In this study, we show that EDTA is superior to citrate as an anticoagulant with regard to stabilization of the concentration platelet EVs. Moreover, because the stability of platelet EVs is comparable for both anticoagulants during a single freeze-thaw cycle, we recommend EDTA as an anticoagulant to establish biorepositories for EV research.
Blood samples collected in hospitals are often transported by pneumatic tube transport. This transport is fast and does not affect routine blood tests [Citation21,Citation22]. Because the concentration of platelet EVs increases during pneumatic tube transport in citrate-anticoagulated blood, manual transport is recommended [Citation4,Citation5]. Manual transport on the other hand is often incompatible with clinical routine, for example in the emergency department, and such blood samples are likely to have concentrations of platelet EVs that no longer reflect the in vivo situation.
Although EDTA stabilizes the concentrations of (activated) platelet EVs during pneumatic tube transport, the concentration of erythrocyte EVs has a tendency to increase. This observation confirms earlier observations of hemolysis during pneumatic tube transport, regardless of the anticoagulant [Citation23,Citation24].
We observed a decrease in EV concentration after a single freeze-thaw cycle, although the stability of EVs was comparable for citrate- and EDTA anticoagulated plasma samples. In literature, both stable and decreased concentrations of EVs were reported after a single freeze thaw cycle [Citation5,Citation25,Citation26]. Why the concentration of EVs decreased is unknown, but damage due to liquid nitrogen freezing and membrane instability due to calcium chelation may play a role [Citation27]. Still, the observed decrease in EV concentration was comparable for citrate and EDTA.
In clinical routine, blood samples are also collected outside office hours and therefore cannot be processed immediately. EDTA stabilized the concentration of EVs in blood samples stored up to 6 hours at the lab bench and at room temperature, demonstrating that within this time interval the “storage” of blood is feasible for EV research. Although stable concentrations of platelet and erythrocyte EVs have been reported in EDTA-anticoagulated blood up to 48 hours of storage at room temperature [Citation28], the measured concentrations were an order of magnitude lower than the concentrations reported in the present study, suggesting that only larger EVs were detected, which are lower in concentration. When stored at 4°C, the increase in EV concentrations was larger compared to storage at room temperature, which is probably due to low-temperature induced platelet activation [Citation29–32].
Limitations
The major limitations of our study are (i) comparison of two anticoagulants only, (ii) the relatively small sample size, (iii) the low number of positive counts for EVs from activated platelets, and (iv) the detection limit of the flow cytometer. First, we chose citrate and EDTA because both are commonly used for routine measurements. Other anticoagulants such as acid-citrate dextrose are less commonly used in the clinics but also these are superior to citrate with regard to stabilization of the concentration of platelet EVs during blood collection and handling [Citation1]. Second, although the relatively small sample size hampers the statistical power of the performed analyses, it was sufficient to demonstrate the superiority of EDTA over citrate. Thirdly, the concentration of EVs from activated platelets was low (see also the MIFlowCyt-EV for the average number of counts), which most likely explains why differences in the concentration of EVs from activated platelets were not significant after pneumatic tube transportation or a freeze-thaw cycle. Finally, based on the scatter-based triggering used in this study, the aforementioned results only include EVs with an FSC cross section of ≥ 60 nm2 or an SSC cross section of ≥ 10 nm2. Using Mie theory, we related scatter signals to the diameter of EVs in nm, thereby taking into account the optical properties of EVs and the optical configuration our flow cytometer. In this, the refractive index of EVs has been generalized, thereby not taking into account variances in RI caused by differences in cargo composition [Citation33]. Based on the assumptions and optical configuration, we estimate that the flow cytometer used in this study detects (platelet-derived) EVs with a diameter larger than 157 ± 10 nm. Platelet-derived EVs with an FCS cross section < 60 nm2 or an SSC cross section < 10 nm2, indicating those having a diameter smaller than 157 ± 10 nm, were therefore not included in the analysis [Citation34]. Despite this limitation, clinical flow cytometry remains the only technology available to determine the number concentration of (platelet-derived) EVs directly in diluted whole blood and plasma and within a calibrated, known size and fluorescence range.
Conclusions
EDTA stabilizes the concentration of platelet EVs with a diameter larger than 157 ± 10 nm and smaller than 1,000 ± 10 nm during and after blood collection, without affecting the concentrations of EVs from leukocytes and erythrocytes. Stabilization of platelet EV concentrations by EDTA during and after blood collection, even in presence of a potent platelet activator such as TRAP-6 or with use of pneumatic tube transport, shows that EDTA outperforms citrate as an anticoagulant to determine the real in vivo concentrations of platelet EVs. Thus, EDTA reduces the pre-analytical variation, which improves EV flow cytometry standardization studies and the clinical compatibility of EV research including the establishment of EV biorepositories. With EDTA, EVs are likely to make their way from research tools to clinical applications.
Author contribution
N. Buntsma, A. Gasecka, E. van der Pol and R. Nieuwland designed the experiments; N. Buntsma performed the experiments; N. Buntsma and A. Gasecka drafted the manuscript; all authors contributed to concept and design, analysis and/or interpretation of data, critical writing or revising the intellectual content and final approval of the version to be published.
Acknowledgements
N. Buntsma acknowledges the Dutch Heart Foundation, research grant CINTICS 2018B031. A. Gasecka acknowledges funding from the Polish National Science Centre, research grant PRELUDIUM 2018/31/N/NZ7/02260. E. van der Pol acknowledges funding from the Netherlands Organisation for Scientific Research - Domain Applied and Engineering Sciences (NWO-TTW), research program VENI 15924.
Disclosure statement
E. van der Pol is co-founder and shareholder of Exometry BV. No potential conflict of interest was reported by the other author(s).
Additional information
Funding
References
- György B, Pálóczi K, Kovács A, Barabás E, Bekő G, Várnai K, Pállinger É, Szabó-Taylor K, Szabó TG, Kiss AA. Improved circulating microparticle analysis in acid-citrate dextrose (ACD) anticoagulant tube. Thromb Res 2014;133:285–292. 10.1016/j.thromres.2013.11.010.
- Peng MN, Liu XF, Xu GL. Extracellular vesicles as messengers in atherosclerosis. J Cardiovasc Transl Res 2020;13(2):121-130. 10.1007/s12265-019-09923-z
- van der Pol E, Böing AN, Harrison P, Sturk A, Nieuwland R. Classification, functions, and clinical relevance of extracellular vesicles. Pharmacol Rev 2012;64(3):676–705. 10.1124/pr.112.005983.
- Coumans FAW, Brisson AR, Buzas EI, Dignat-George F, Drees EEE, El-Andaloussi S, Emanueli C, Gasecka A, Hendrix A, Hill AF, et al. Methodological guidelines to study extracellular vesicles. Circ Res 2017;120:1632–1648. 10.1161/CIRCRESAHA.117.309417.
- Lacroix R, Judicone C, Poncelet P, Robert S, Arnaud L, Sampol J, Dignat-George F. Impact of pre-analytical parameters on the measurement of circulating microparticles: towards standardization of protocol. Journal of Thrombosis and Haemostasis 2012;10:437–446. 10.1111/j.1538-7836.2011.04610.x.
- Lacroix R, Judicone C, Mooberry M, Boucekine M, Key NS, Dignat-George F. Standardization of pre-analytical variables in plasma microparticle determination: results of the International Society on Thrombosis and Haemostasis SSC collaborative workshop. Journal of Thrombosis and Haemostasis 2013;11:1190–1193. 10.1111/jth.12207.
- Cointe S, Judicone C, Robert S, Mooberry MJ, Poncelet P, Wauben M, Nieuwland R, Key NS, Dignat-George F, Lacroix R, et al. Standardization of microparticle enumeration across different flow cytometry platforms: results of a multicenter collaborative workshop. Journal of Thrombosis and Haemostasis 2017;15(1):187–193. 10.1111/jth.13514.
- van der Pol E, Sturk A, van Leeuwen T, Nieuwland R, Coumans F, Mobarrez F, Arkesteijn G, Wauben M, Siljander PR-M, Sánchez‐López V, et al. Standardization of extracellular vesicle measurements by flow cytometry through vesicle diameter approximation. Journal of Thrombosis and Haemostasis 2018;16:1236–1245. 10.1111/jth.14009.
- Ramirez MI, Amorim MG, Gadelha C, Milic I, Welsh JA, Freitas VM, Nawaz M, Akbar N, Couch Y, Makin L, et al. Technical challenges of working with extracellular vesicles. Nanoscale 2018;10:881–906. 10.1039/C7NR08360B.
- Abrams CS, Ellison N, Budzynski Az, Shattil SJ. Direct detection of activated platelets and platelet-derived microparticles in humans. Blood 1990;75(1):128–138. 10.1182/blood.V75.1.128.128.
- Gemmell CH, Sefton MV, Yeo EL. Platelet-derived microparticle formation involves glycoprotein IIb-IIIa. J Biol Chem 1993;268(20):14586–14589. 10.1016/S0021-9258(18)82371-7.
- Clayton A, Bollard E, Buzas EI, Cheng L, Falcón-Perez JM, Gardiner C, Gustafson D, Gualerzi A, Hendrix A, Hoffman A, et al. Considerations towards a roadmap for collection, handling and storage of blood extracellular vesicles. 2019;8(1). 10.1080/20013078.2019.1647027.
- Venturella M, Caarpi FM, Zocco D. Standardization of blood collection and processing for the diagnostic use of extracellular vesicles. Curr Pathobiol Rep 2019;7:1–8. 10.1007/s40139-019-00189-3.
- Sun L, Meckes DG Jr. Methodological approaches to study extracellular vesicle miRNAs in Epstein(-)Barr virus-associated cancers. Int J Mol Sci 2018;19:9. 10.3390/ijms19092810.
- de Rond L, Coumans FAW, Nieuwland R, van Leeuwen TG, van der Pol E. Deriving extracellular vesicle size from scatter intensities measured by flow cytometry. Current Protocols in Cytometry 2018;86:e43. 10.1002/cpcy.43.
- Thery C, Witwer KW, Aikawa E, Alcaraz MJ, Anderson JD, Andriantsitohaina R, Antoniou A, Arab T, Archer F, Atkin‐Smith GK, Ayre DC. Minimal information for studies of extracellular vesicles 2018 (MISEV2018): a position statement of the International Society for Extracellular Vesicles and update of the MISEV2014 guidelines. J Extracell Vesicles 2018;7(1):1535750. 10.1080/20013078.2018.1535750.
- Welsh JA, van der Pol E, Arkesteijn GJA, Bremer M, Brisson A, Coumans F, Dignat‐George F, Duggan E, Ghiran I, Giebel B, Görgens A, et al. MIFlowCyt-EV: a framework for standardized reporting of extracellular vesicle flow cytometry experiments. Journal of Extracellular Vesicles 2019;9(1):1713526. 10.1080/20013078.2020.1713526.
- Stoner SA, Duggan E, Condello D, Guerrero A, Turk JR, Narayanan PK, Nolan JP. High sensitivity flow cytometry of membrane vesicles. Cytometry Part A 2016;89(2):196–206. 10.1002/cyto.a.22787.
- Arraud N, Gounou C, Turpin D, Brisson AR. Fluorescence triggering: a general strategy for enumerating and phenotyping extracellular vesicles by flow cytometry. Cytometry Part A 2016;89(2):184–195. 10.1002/cyto.a.22669.
- de Rond L, van der Pol E, Hau CM, Varga Z, Sturk A, van Leeuwen TG, Nieuwland R, Coumans FAW. Comparison of generic fluorescent markers for detection of extracellular vesicles by flow cytometry. Clin Chem 2018;64(4):680–689. 10.1373/clinchem.2017.278978.
- Kocak FE, Yöntem M, Yücel Ö, Çilo M, Genç Ö, Meral A. The effects of transport by pneumatic tube system on blood cell count, erythrocyte sedimentation and coagulation tests. Biochem Med (Zagreb) 2013;23(2):206–210. 10.11613/BM.2013.024.
- Pupek A, Matthewson B, Whitman E, Fullarton R, Chen Y. Comparison of pneumatic tube system with manual transport for routine chemistry, hematology, coagulation and blood gas tests. Clin Chem Lab Med 2017;55(10):1537–1544. 10.1515/cclm-2016-1157.
- Kara H, Bayir A, Ak A, Degirmenci S, Akinci M, Agacayak A, Marcil E, Azap M. Hemolysis associated with pneumatic tube system transport for blood samples. Pak J Med Sci 2014;30(1):50–58.
- Lippi G, Avanzini P, Musa R, Sandei F, Aloe R, Cervellin G. Evaluation of sample hemolysis in blood collected by S-Monovette® using vacuum or aspiration mode. Biochemica Medica 2013;23(1):64–69. 10.11613/BM.2013.008.
- Ýuana Y, Böing AN, Grootemaat AE, van der Pol E, Hau CM, Cizmar P, Buhr E, Sturk A, Nieuwland R. Handling and storage of human body fluids for analysis of extracellular vesicles. Journal of Extracellular Vesicles 2015;4:29260. 10.3402/jev,v4.29260.
- Wu J-Y, Li Y-J, Hu X-B, Huang S, Xiang D-X. Preservation of small extracellular vesicles for functional analysis and therapeutic applications: a comparative evaluation of storage conditions. Drug Deliv 2021;28(1):162–170. 10.1080/10717544.2020.1869866.
- Orlov SN, Aksentsev SL, Kotelevtsev SV. Extracellular calcium is required for the maintenance of plasma membrane integrity in nucleated cells. Cell Calcium 2005;38(1):53–57. 10.1016/j.ceca.2005.03.006.
- Wisgrill L, Lamm C, Hartmann J, Preißing F, Dragosits K, Bee A, Hell L, Thaler J, Ay C, Pabinger I, et al. Peripheral blood microvesicles secretion is influenced by storage time, temperature, and anticoagulants. Cytometry Part A 2016;89(7):663–672. 10.1002/cyto.a.22892.
- Getz TM. Physiology of cold-stored platelets. Transfusion and Apheresis Science 2019;58(1):12–15. 10.1016/j.transci.2018.12.011.
- Van Poucke S, Stevens K, Marcus AE, Lancé M. Hypothermia: effects on platelet function and hemostasis. Thromb J 2014;12(1):31. 10.1186/s12959-014-0031-z.
- White JG, Krivit W. An ultrastructural basis for the shape changes induced in platelets by chilling. Blood 1967;30(5):625–635. 10.1182/blood.V30.5.625.625.
- Oliver AE, Tablin F, Walker NJ, Crowe JH. The internal calcium concentration of human platelets increases during chilling. Biochim Biophys Acta 1999;1416(1–2):349–360. 10.1016/S0005-2736(98)00239-9.
- Thery C, Ostrowski M, Segura E. Membrane vesicles as conveyors of immune responses. Nat Rev Immunol 2009;9(8):581–593. 10.1038/nri2567.
- Arraud N, Linares R, Tan S, Gounou C, Pasquet J-M, Mornet S, Brisson AR. Extracellular vesicles from blood plasma: determination of their morphology, size, phenotype and concentration. Journal of Thrombosis and Haemostasis 2014;12(5):614–627. 10.1111/jth.12554.