
Abstract
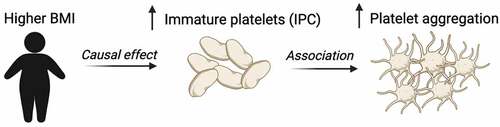
Higher body mass index (BMI) is a risk factor for thrombosis. Platelets are essential for hemostasis but contribute to thrombosis when activated pathologically. We hypothesized that higher BMI leads to changes in platelet characteristics, thereby increasing thrombotic risk. The effect of BMI on platelet traits (measured by Sysmex) was explored in 33 388 UK blood donors (INTERVAL study). Linear regression showed that higher BMI was positively associated with greater plateletcrit (PCT), platelet count (PLT), immature platelet count (IPC), and side fluorescence (SFL, a measure of mRNA content used to derive IPC). Mendelian randomization (MR), applied to estimate a causal effect with BMI proxied by a genetic risk score, provided causal estimates for a positive effect of BMI on both SFL and IPC, but there was little evidence for a causal effect of BMI on PCT or PLT. Follow-up analyses explored the functional relevance of platelet characteristics in a pre-operative cardiac cohort (COPTIC). Linear regression provided observational evidence for a positive association between IPC and agonist-induced whole blood platelet aggregation. Results indicate that higher BMI raises the number of immature platelets, which is associated with greater whole blood platelet aggregation in a cardiac cohort. Higher IPC could therefore contribute to obesity-related thrombosis.
Background
Obesity (body mass index ≥30 kg/m2) has nearly tripled worldwide in the last 45 years [Citation1]. This is a major health concern as a higher body mass index (BMI) is an important risk factor for various noncommunicable disorders, including cardiovascular disease [Citation2]. Clinical and genetic association studies have identified BMI as an independent risk factor for thrombotic disorders, including coronary heart disease and stroke [Citation3–5].
Graphical abstract created using BioRender.com
Platelets are blood cells which are essential for the cessation of bleeding upon injury to a blood vessel and are involved in thrombosis and progression of cardiovascular disease [Citation6]. When pathologically activated, platelets can aggregate to form thrombi thereby occluding arteries and triggering a myocardial infarction or stroke [Citation6]. Platelet hyperactivity can be an indicator of those who may be at an increased risk of thrombosis [Citation7]. There is evidence that people with a higher BMI have hyperactive platelets [Citation8,Citation9], which could explain why a higher BMI is linked to an increase in thrombosis. Mechanisms of platelet hyperactivity are unclear, but it is possible that changes in platelet numbers, size, and immaturity may play a role. Furthermore, an alteration in circulating metabolites or proteins induced by obesity could modulate the activation of platelets [Citation10].
Platelet function can be directly assessed by various methods; these commonly include platelet aggregation experiments and/or using antibodies to detect platelet receptors that are exposed upon activation. One of the limitations of measuring platelet function directly is that these techniques are not widely available or readily standardized. Hematology analyzers are commonly used to provide full blood counts and can provide detailed readouts of platelet characteristics. Some of these characteristics have been reported to be indirect measures of platelet function [Citation11]. For example, an increase in mean platelet volume (MPV) has been reported to be predictive of vascular mortality and ischemic heart disease [Citation12]. Another commonly measured platelet characteristic is the number of platelets in circulation (platelet count, PLT). An increase in platelet count has been reported to be associated with platelet hyperactivity [Citation11] and there is evidence that higher platelet count is associated with ischemic stroke [Citation13].
Sysmex hematology analyzers are able to provide additional platelet characteristics, such as immature platelet fraction (IPF) and immature platelet count (IPC) [Citation14]. Immature platelets (also known as reticulated platelets) are the youngest platelets in circulation and are detected on the basis of greater forward scatter (FSC, an indicator of size) and greater side fluorescence (SFL, an indicator of mRNA content) [Citation15]. Higher levels of immature platelets are indicative of enhanced platelet production [Citation16] and these platelets are believed to be more prothrombotic than older circulating platelets, with greater dense granule release and increased P-selectin expression [Citation15–17]. Higher IPC is associated with adverse cardiovascular outcomes in patients with coronary artery disease [Citation15] and reduced effectiveness of antiplatelet therapies [Citation17,Citation18], suggesting that hyperactive immature platelets may contribute to vascular events. Immature platelets have also been suggested to be less responsive to antiplatelet therapies such as prasugrel in acute coronary syndrome patients [Citation17].
As PLT, MPV and IPC provide potential information about platelet hyperactivity and given the increased thrombotic risk seen with adiposity, it is important to assess how adiposity affects these platelet properties. Previous studies with modest sample sizes have implemented observational epidemiological methods to explore the effect of BMI on PLT, plateletcrit (PCT) and MPV. There is conflicting observational evidence regarding an association between BMI and PLT [Citation19,Citation20], with some studies suggesting a positive association between BMI and MPV [Citation21] and other studies reporting no such relationship [Citation22]. Furthermore, as there is evidence that immature platelet production is increased in patients with metabolic syndrome and type II diabetes [Citation23,Citation24], it is important to explore whether BMI may be an independent predictor of IPC. It is currently unknown whether the influence of BMI on platelet properties and function is causal and independent of confounding effects.
In this study, we used data from the INTERVAL prospective cohort (N = 33 388) to explore the association between BMI and platelet traits. We combined observational and Mendelian randomization (MR) approaches to test the hypothesis that higher BMI leads to changes in platelet characteristics. Although observational studies can demonstrate associations between BMI and platelet characteristics, they cannot determine direct causality. To address this, we employed MR, using a genetic risk score derived from single nucleotide polymorphisms (SNPs) associated with increased BMI. This allowed estimation of the causal effect of BMI on platelet traits, reducing the effect of confounding factors that are inherent to observational studies. To assess functional implications of BMI-platelet associations, a follow-up analysis was designed to explore the associations between platelet characteristics and whole blood aggregation in a cohort of cardiac surgery patients.
Methods
Study population
INTERVAL is a prospective cohort study that initially aimed to test the safety of reducing the time interval between donations of whole blood in 50 000 participants [Citation25]. Participants were over the age of 18 years, able to provide informed consent and free from a history of major disease. Participants were recruited between June 11th, 2012 and June 15th, 2014 from 25 National Health Service Blood and Transplant (NHSBT) centers across England. They filled out online questionnaires including self-reported height and weight, smoking status and alcohol consumption. Blood samples were also taken at baseline (before randomization within the study) where full blood counts were obtained. The study was approved by Cambridge East Research Ethics Committee. Permission for data access was provided by the Data Access Committee. Data contains sensitive content and requires permission to use therefore cannot be made publicly available; access to data needs to be approved by the INTERVAL team www.intervalstudy.org.uk/more-information.
The present study was conducted on up to 33 388 European ancestry participants living in the United Kingdom. These were the INTERVAL participants who were genotyped, had basic phenotype data and full blood count measures ().
Figure 1. A STROBE diagram outlining participants included from the INTERVAL study (N = 33 388).
Measurement of BMI and covariables
Participants self-reported their weight and height using online questionnaires. BMI was derived from their weight in kilograms by the square of their height in meters (kg/m2). BMI was rank normal transformed (rntransform() function from “moosefun” package https://github.com/hughesevoanth/moosefun/). Available covariables used in the analysis were age, sex, smoking status (in three categories of never, previous and current) and alcohol consumption (in four categories of rarely, less than once a week, 1–2 times a week and 3–5 times a week or most days). These covariables were chosen due to their plausible associations with both BMI and cardiovascular health [Citation2], therefore it is important to adjust for these variables in the observational estimates.
Measurement of platelet traits
Blood was taken by venipuncture into 3 mL EDTA tubes. Platelet parameters were measured using the Sysmex XN-1000 instrument [Citation26]. This analyzer provides information on cell counts by using a combination of fluorescence (PLT-F) and impedance (I) flow cytometry. The PLT-F channel used a Fluorocell fluorescent dye (oxazine), whereas the impedance method uses electrical resistance to detect platelets. Platelet indices included in the current study, along with the raw units, are provided in Supp Table I. These measurements were pre-adjusted for technical covariates such as time between venipuncture and blood count, as well as instrument drift, seasonal and weekly variation [Citation26]. Adjustment was performed with cyclic, thin-plate and P-splines in a generalized additive model (GAM) [Citation27]. Resulting platelet trait values along with their units of measurement are reported in Supp Table I. These data were rank normal transformed to normalize the distribution of each trait. Therefore, each platelet index is measured in normalized standard deviation (SD) units.
Table I. Characteristics of INTERVAL participants.
Genetic data and the association of the genetic risk score (GRS) with BMI
The genotyping of INTERVAL participants was performed using the Affymetrix GeneTitan® Multi-Channel (MC) Instrument. Quality control (QC) was performed as previously described [Citation26]. Imputation was implemented using a combined 1000 Genomes phase-3-UK +10 K reference panel using the Practical Byzantine Fault Tolerance (PBFT) algorithm [Citation26]. A genetic instrument for BMI was created by using the 654 available genetic variants of 656 variants which were independently associated with BMI (P < 5x10⁻⁸) in a recent meta-analysis of GWAS of around 700,000 individuals of European descent [Citation28]. Of these individuals, 450,000 were from UK Biobank and 250,000 were from the Genetic Investigation of Anthropometric Traits (GIANT) consortium. The weighted GRS was made using PLINK 2.0 [Citation29]. The effect alleles and beta coefficients were extracted from the source GWAS. The weighted score was calculated by multiplying the dosage of each effect alleles by its effect estimate, summing these and dividing by the number of SNPs (654). The GRS therefore reflects the average per-SNP effect on BMI per individual.
Statistical analysis
Analyses were performed using R version 3.4.2 [Citation30]. To visualize the correlation between the outcome platelet variables, a correlation matrix was made using the pairwise Pearson correlation coefficients of the rank normal transformed data. A dendrogram was also created to show the hierarchical relationship between platelet traits (https://github.com/hughesevoanth/iPVs), where the height at which variables are joined is set at (1 – Pearson correlation coefficient (r)). To explore observational associations between BMI and platelet traits, linear regression models were used (lm() function from “stats” package). Two regression models were used: firstly, adjusting for age and sex and secondly, additionally adjusting for smoking and alcohol consumption as ordinal variables. The results of the regression reflect the change in platelet traits (in normalized SD units) per normalized SD higher BMI (4.7 kg/m2). Only participants with all covariates were included in the linear regression models. The associations between potential covariables with both BMI and platelet traits were also explored using linear regression.
To understand properties of the GRS for BMI, the association between the GRS with both BMI and covariables were explored. The MR analysis was performed by using a two-stage least squares (2SLS) regression model (using systemfit() function from “systemfit” package [Citation31]). The MR causal estimates reflect the change in platelet traits (in SD units) per SD increase in BMI. A Wu-Hausman test was performed to test for endogeneity between observational and MR estimates. Exact beta coefficients, confidence intervals and P values are provided throughout and guide strength of association.
Where there was consistent observational and MR evidence for a BMI effect on platelet traits with potential clinical relevance, additional sensitivity analyses were carried out. We explored whether there were different magnitudes of associations across NHS BMI categories indicative of a non-linear relationship. Specifically, participants were stratified by BMI and the association between BMI and IPC estimated within BMI categories.
Follow-up analysis to explore the association between immature platelets and aggregation
Motivated by findings from the primary analyses described above, additional observational analyses were conducted using data from the COagulation and Platelet laboratory Testing in Cardiac Surgery (COPTIC) study. The COPTIC study was an observational, single center cohort study of adults undergoing cardiac surgery at the Bristol Heart Institute with the primary objective of examining the relationship between coagulation laboratory parameters and bleeding outcomes after surgery in 2 541 participants [Citation32]. This study was approved by the UK NHS Research Ethics Committee (09/H0104/53).
COPTIC study variables
Age and sex were reported at baseline. Height and weight were obtained from medical notes. BMI was derived from weight and height (kg/m2). Smoking was reported as a categorical variable (0 = never smoker, 1 = ex-smoker for >5 years, 2 = ex-smoker for 1–5 years, 3 = ex-smoker for 30 days-1 year, 4 = current smoker). Platelet variables (PLT, MPV, IPF, and IPC) were measured using the Sysmex XE-2100 Automated Hematology System (Oxford, UK). Blood samples were taken pre-operatively into 3.2% sodium citrate vacutainers (BD Biosciences, Milton Keynes, UK). Platelet aggregation was measured using Multiplate multiple electrode aggregometry (MEA) (Roche, Rotkreuz, Switzerland), which detects change in electrical impedance when platelets aggregate on metal electrodes. Aggregation was determined by the area under the curve (AUC) in response to platelet agonists, including adrenaline (100 mg/mL), thrombin receptor activator peptide 6 test (TRAP-test), ADP-test, and ASPI-test. Using of a combination of agonists enables evaluation of platelet activation via different pathways: adrenaline acts at the α2 adrenergic receptor, TRAP-6 acts at the protease-activated receptor-1 (PAR-1), ADP acts at the P2Y12 receptor and arachidonic acid at the Thromboxane A2 (TxA2) receptor.
COPTIC statistical analysis
The COPTIC dataset in the current analysis included 2 518 participants (23 out of 2 541 participants did not consent for future research). For the current study, only those who were not on antiplatelet therapies (prasugrel, clopidogrel, or aspirin) were included (N = 655). Extreme outliers that were ± 5 SDs from the mean were removed, and exposures and outcomes were rank normal transformed. Linear regression was used to generate estimates of the association between BMI and platelet parameters and, more specifically, the association between IPC and aggregation, adjusting for age, sex, and smoking status.
Results
INTERVAL participant characteristics
Of INTERVAL participants included in the current study (N = 33 388), 50.2% were female. The mean age was 45.3 years (SD of 14.2 years, ). The mean BMI was 26.4 kg/m2 (SD of 4.7 kg/m2). The majority of participants were never smokers (58.9%), with 33.3% and 7.8% reported as previous and current smokers, respectively. Nearly a third (32.7%) of participants reported drinking alcohol at least three times a week.
Correlation between platelet traits in INTERVAL
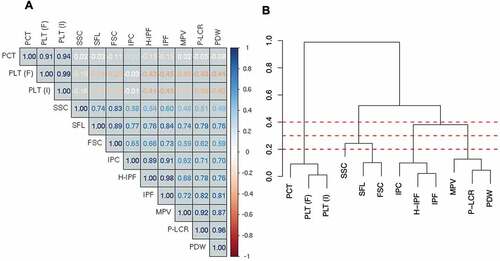
The Sysmex XN-1000 hematology analyzer quantifies multiple platelet traits; however, many of these traits are closely related and therefore may not be completely independent. Indeed, platelet traits showed a high degree of correlation with each other (), especially when measures related to similar biological processes. For example, measures of PLT (PLT I/F) and PCT, the latter a measurement of platelet mass, were highly positively correlated with each other but were weakly inversely correlated with other platelet measures. Measures of platelet maturity (IPF, IPC, and H-IPF) were highly correlated with each other. In addition, platelet size variables (MPV, P-LCR, and PDW) showed strong positive correlations with each other as well as with measures of immature platelets.
Figure 2. Correlation matrix and dendrogram of the relationship between platelet traits. A) Correlation coefficients are provided within the matrix. Dark blue indicates a correlation coefficient (r) of 1, with dark red indicating a correlation coefficient of −1. B) A dendrogram showing the hierarchical relationship between platelet traits, where the height at which two platelet traits join is (1 – Pearson correlation coefficient (r)). PCT = plateletcrit, PLT (F) = platelet count (PLT-F channel), PLT (I) = platelet count (impedance channel), SSC = side scatter, SFL = side fluorescence, FSC = side scatter, IPC = immature platelet count, H-IPF = high fluorescence immature platelet fraction, IPF = immature platelet fraction, MPV = mean platelet volume, P-LCR = platelet large cell ratio, PDW = platelet distribution width. Dashed red lines indicate a height of 0.2, 0.3 and 0.4.
Observational associations between BMI and platelet traits in INTERVAL
Linear regression was performed to determine whether a higher BMI was associated with a change in platelet characteristics. In the confounder-adjusted linear regression (Supp Table II), BMI was positively associated with PCT (0.12 SD higher per SD higher BMI, 95% CI 0.11 to 0.13, P = 9.2 × 10−88) and platelet count (PLT (I) 0.11 SD higher per SD higher BMI, 95% CI 0.09 to 0.12, P = 1.0 × 10−67). The next strongest association with BMI was the association with SFL (0.06 SD higher per SD increase in BMI, 95% CI 0.05 to 0.07, P = 4.7 × 10⁻²³). BMI also showed a positive association with IPC (0.06 SD higher per SD increase in BMI, 95% CI 0.05 to 0.08, P = 4.8 × 10⁻²²). These results demonstrate that BMI is positively associated with PCT, PLT (I), SFL, and IPC in this population. These estimates were very similar to the age and sex only adjusted estimates (Supp Table III).
Table II. Characteristics of COPTIC study participants.
Associations of covariables with BMI and platelet traits in INTERVAL
The association of covariables (age, sex, smoking, and alcohol) with BMI were evaluated. Included covariables in the analysis showed associations with BMI (Supp Table IV). Males had a higher BMI than females (0.18 SD, 95% CI 0.16 to 0.21, P = 9.64 × 10−64). Age was positively associated with BMI (0.011 SD higher per year older, 95% CI 0.010 to 0.012, P = 1.11 × 10−182). Alcohol showed an inverse association with BMI and smoking showed a weak positive association with BMI.
Higher age was generally inversely associated with platelet measures (Supp Table V). Males had a lower platelet count and plateletcrit compared to females (PLT-F was 0.57 lower 95% CI −0.60 to −0.55, P = 9.9x10−324, Supp Table VI). Weak associations were detected between smoking and platelet traits such as a positive association between smoking status and immature platelets (Supp Table VII). Higher alcohol consumption also showed inverse associations with measures of plateletcrit and platelet count (Supp Table VIII).
GRS for BMI associations with BMI and covariables
To estimate the causal effect of BMI on platelet characteristics, MR was performed. The GRS for BMI (the average per SNP effect on BMI) showed a normal distribution (mean 0.08, SD 0.30, range −1.15 to 1.34) and was positively associated with BMI to the degree expected (R2 = 0.042, P = 2.3x10−312, F = 1458, Supp Table IX). The GRS did not associate with sex, however weak associations were detected with alcohol consumption, age, and smoking status. The amount of variance explained by the GRS for BMI on any covariable included did not exceed R2 = 0.002 (Supp Table IX). As the GRS associates with BMI but does not strongly associate with the measured covariables, it is a valid instrument to perform MR.
Mendelian randomization estimates for the association between BMI and platelet traits
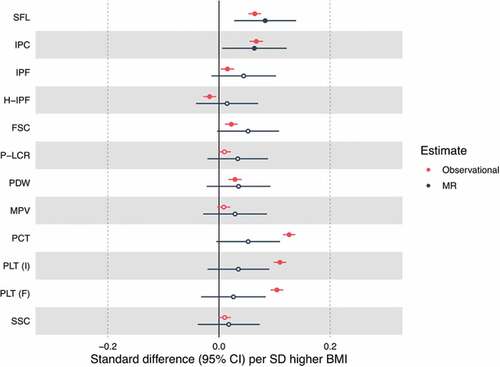
In the MR analyses, BMI was associated with fewer traits than in the observational analysis (Supp Table X, ). The causal estimate for the effect of BMI on SFL was 0.08 SDs per SD increase in BMI (95% CI 0.03 to 0.14, P = .003). This estimate was of larger magnitude than the observational estimate. The causal estimate for BMI and IPC was 0.06 SDs per SD increase in BMI (95% CI 0.006 to 0.12, P = .03), a similar magnitude of effect to the observational estimate. In the MR analysis, unlike in the observational analysis, the causal estimate did not suggest an effect of BMI on either PCT or PLT. MR estimates did not provide evidence for associations between BMI and other platelet variables. The point estimates were consistently positive, aligning with the positive observational associations seen across the platelet traits. Across all but one (H-IPF) of the platelet phenotypes we did not observe differences in directionality of effect comparing observational effects and causal effects predicted by Mendelian randomization ().
Figure 3. Forest plot of the unadjusted observational associations and Mendelian randomization (MR) estimates for BMI and platelet traits. Estimate points are filled where P < .05. SFL = side fluorescence, IPC = immature platelet count, H-IPF = high fluorescence immature platelet function, FSC = forward scatter, P-LCR = platelet large cell ratio, PDW = platelet distribution width, MPV = mean platelet volume, PCT = plateletcrit, PLT (I) = platelet count (impedance channel), PLT (F) = platelet count (PLT-F channel), SSC = side scatter.
The Wu-Hausman test suggested that observational and MR estimates were similar for the majority of platelet traits (P > .05), except for measures of platelet count and plateletcrit (P < .001) (Supp Table X).
Stratifying BMI and IPC associations by BMI group
We explored whether associations between BMI and IPC varied across NHS BMI groups (underweight <18.5 kg/m2, healthy weight 18.5–24.9 kg/m2, overweight 25–29.9 kg/m2, obesity 30+ kg/m2). IPC had consistent BMI effects across observational and MR analyses. Stratifying by BMI category suggested that the strongest association between BMI and IPC was the overweight category (Supp Table XI).
Follow-up associations between IPC and whole blood aggregation in COPTIC
Given evidence for a causal effect of BMI on IPC in the MR analysis, we sought to evaluate the relationship between IPC and platelet activity to enable inferences about biological mechanism. Whilst this analysis could not be conducted in INTERVAL due to a lack of suitable data, we were able to utilize data from the COPTIC study to address this question. The COPTIC study is a cohort of cardiac surgery patients, with samples taken pre-operatively. These participants have whole blood aggregation measured, therefore making it possible to determine associations between IPC and aggregation in a clinical setting.
COPTIC participants
The total number of COPTIC participants was 2 541. Of these, 2 518 participants gave consent for future research (). Participants included in the analysis were those not on antiplatelet therapy (N = 655). The majority of participants were male (61.8%), with a mean age of 63.9 years (SD of 16.1). Similar to the INTERVAL cohort, the mean BMI was in the overweight category (27.2 kg/m2 with a SD of 4.9 kg/m2). The majority of participants were either never smokers or ex-smokers for more than 5 years (89.2%). The effect estimate for the effect of BMI on IPC was 0.06 (95% CI −0.01 to 0.14, P = .09) and therefore consistent with that estimated in the INTERVAL cohort (Supplementary Table XII).
Association between IPC and aggregation in COPTIC cohort
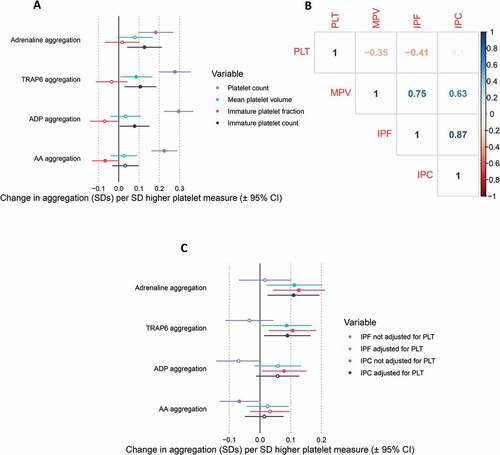
To determine the potential functional effects of variation in IPC, the COPTIC cohort was used to assess the observational association between IPC and whole blood platelet aggregation in response to a range of platelet agonists (). In participants who were not on antiplatelet therapy (up to N = 655), there was evidence for a positive association between IPC and aggregation induced by adrenaline (0.13 SD increase per SD increase in IPC, 95% CI 0.04 to 0.21, p = 3.7×10⁻³), TRAP-6 (0.11 SD increase per SD increase in IPC, 95% 0.03 to 0.18, p = 7.8×10⁻³) and ADP (0.08 SD per SD increase in IPC, 95% 0.01 to 0.0.15, p = .04). As there was a high correlation among platelet traits (), the effect of MPV, PLT, and IPF were also assessed. PLT was associated with all four measures of aggregation, with a larger effect estimate than IPC (). The finding that IPC does not correlate with PLT, however, suggests that the effect of IPC on platelet aggregation is independent of the effect of PLT on platelet aggregation (). Fitting PLT alongside IPC as an additional predictor of aggregation had little effect on the IPC effect estimate providing further evidence of independent contributions from the two traits (). Adjustment for PLT in the regression model for the association between IPF and aggregation provided estimates of a similar magnitude to that of IPC and aggregation.
Figure 4. Association between platelet measures and aggregation in the COPTIC trial. A) Forest plot displaying the association between platelet measures (exposure) and aggregation (outcomes). B) Correlation matrix displaying the Pearson’s correlation coefficient (r) between platelet traits. C) Forest plot displaying the effect estimate for the association between immature platelet count (IPC) or immature platelet fraction (IPF) and measures of aggregation, with or without adjustment for platelet count (PLT). ADP = adenosine diphosphate, AA = arachidonic acid, MPV = mean platelet volume.
Discussion
In this study, we used data from 33 388 healthy blood donors to study the effect of BMI on platelet phenotypes including measures of count, size and maturity. The combination of observational and MR estimates suggested a positive causal effect of BMI on SFL and IPC. The observational analysis revealed a strong association between BMI and both PLT and PCT, however the MR estimates did not provide evidence to support this association as causal. Observational analysis using data from a cardiac surgery cohort provided evidence for a positive association between IPC and aggregation induced by adrenaline, TRAP6 and ADP.
The observational and MR analyses in the current study provide evidence for a positive association between BMI and both IPC and SFL. Stratifying by NHS BMI category suggested that this estimate is strongest in the overweight category. As IPC is derived using SFL, the measure of mRNA content, these measures are highly correlated. Whilst few studies have explored the direct association between BMI and immature platelet measures, there is some evidence for increased immature platelets in subjects with metabolic syndrome (MS) and subjects with type II diabetes compared with control subjects [Citation23,Citation24]. In these studies, participants with MS or type II diabetes also had a higher BMI, which could be a possible cause of this increase in immature platelets. Indeed, evidence from our analysis suggests that BMI, independent of metabolic syndrome or type II diabetes, may causally influence IPC and SFL.
As IPC is an indirect measure of platelet production [Citation16], these results suggest that an increased BMI may lead to an increased production of platelets. It has been reported that immature platelets have increased thrombotic potential [Citation16,Citation33] and may contribute to cardiovascular events [Citation15,Citation34], suggesting that an increase in the number of immature platelets may be of functional and clinical relevance. A follow-up analysis confirmed that higher IPC was associated with greater platelet aggregation independent of absolute platelet count within a cardiac surgery cohort. Positive associations were found between IPC and aggregation induced by adrenaline, TRAP-6 and ADP, suggesting general platelet hyperactivity. A previous study in a coronary artery disease cohort also found a positive correlation between IPC and aggregation induced by arachidonic acid, collagen, and ADP [Citation33]. These findings suggest that IPC could be used as a proxy for platelet hyperactivity in patients with cardiovascular disease.
Measures of immature platelets are currently not considered in the clinic when prescribing antiplatelet therapy, however, if a higher immature platelet count is demonstrative of hyperactive platelets then this could be important in guiding dosage regimes to ensure sufficient platelet inhibition [Citation17]. Observational studies have also found that patients with COVID-19 have elevated immature platelet counts and fraction, which could contribute to high rates of COVID-19 induced thrombosis [Citation35,Citation36].
Despite the association between BMI and IPC, there was less evidence for an effect of BMI on IPF. This lack of association may be because IPF is the proportion of immature platelets, derived using the platelet count as the demoninator, therefore changes in the number of platelets overall (for example, due to increased platelet lifespan) could attenuate the effect of an increase in the immature platelet fraction.
In general, previous studies have reported positive observational associations between BMI and both PLT and PCT [Citation19]. More direct measures of body fat, such as total fat mass, waist–hip ratio, and waist circumference, have also been reported to be positively associated with both PLT and PCT [Citation20]; the observational evidence from the current study is in agreement with this. The MR analysis did not detect causal effects of BMI on PLT or PCT, however the estimates were consistently positive. It is possible for IPC to be raised in the absence of raised PLT as there may be concurrent increases in platelet production as well as consumption. The small P values in the Wu-Hausman test for endogeneity for PCT and PLT variables support that the observational and MR estimates are different. Estimates could be biased due to confounding factors, reverse causation or other sources of bias. Possible routes of confounding could include stress, inflammation, and nutrition, which could exert independent effects on both BMI and platelet count.
Both observational and MR estimates suggested that BMI is not associated with measures of platelet size, such as MPV and P-LCR. There are conflicting findings in the literature, with some studies suggesting that there is a positive association between BMI and MPV [Citation21] and others showing no relationship [Citation19,Citation20,Citation22]. The results of the current study suggest that associations seen previously between BMI and MPV are likely due to confounding of observational estimates. The lack of association between BMI and MPV may be surprising given a correlation coefficient of 0.62 between IPC and MPV. Indeed, as BMI was positively associated with immature platelet count, and immature platelets tend to be larger, it may be unexpected that BMI was not associated with measures of platelet size. However, immature platelets make up a small percentage of overall platelets (~3–6%) [Citation15,Citation17], therefore the increase in immature platelets may not affect the overall median size of the whole platelet population.
Although this study suggests potential effects of BMI on platelet traits, such as SFL and IPC, it does not provide mechanistic insight into how BMI exerts these effects. Previous studies have suggested that inflammation driven by adiposity can stimulate megakaryocyte proliferation, thereby increasing platelet numbers [Citation20]. There is evidence that inflammatory mediators such as interleukin-6 (IL-6) could be one such factor [Citation37]. Further study would be warranted to explore these mechanisms, as well as replicate the current findings, for example through independent population or clinical studies.
There are a few limitations to the study that should be recognized. Firstly, BMI was derived from self-reported height and weight. Although there is potential for this to bias observations, previous studies have found that self-reported BMI and BMI measured in the clinic are strongly associated [Citation38]. The GRS also associates with BMI to the extent expected. Secondly, there may be other confounders which were not recorded within INTERVAL and therefore could not be accounted for in our models, such as, socio-economic position, which may affect both BMI and platelet properties. Therefore, residual confounding of observational estimates cannot be ruled out. Whilst the INTERVAL study provided relatively precise estimates of effect overall, larger sample sizes within each BMI category would be required to further investigate potential nonlinearity in the relationship between BMI and IPC. With respect to the observational analysis conducted in COPTIC, the sample size is modest, which may limit power to detect associations. Furthermore, this cohort required cardiac surgery and therefore it is possible that associations found may not be generalizable to the wider population, as participants had higher aggregation responses than healthy reference ranges [Citation39]. However, these findings do indicate that immature platelets may be a biomarker of platelet hyperactivity in patients with a history of cardiovascular disease.
Altogether, we show observational and MR evidence that an increased BMI is associated with an increase in number of immature platelets. Observational evidence indicates that higher immature platelet count is associated with enhanced aggregation in a cardiac surgery cohort. Together, these results indicate that higher BMI may enhance platelet function and thrombosis by increasing platelet production and immature platelet count.
Data availability
Data included contains sensitive or potentially identifying information. For access to INTERVAL data please contact the INTERVAL team www.intervalstudy.org.uk/more-information. For access to COPTIC data, please contact the Clinical Trials Evaluation Unit [email protected].
Supplementary materials
Download MS Excel (141.9 KB)Acknowledgements
Participants in the INTERVAL randomised controlled trial were recruited with the active collaboration of NHS Blood and Transplant England (www.nhsbt.nhs.uk), which has supported field work and other elements of the trial. DNA extraction and genotyping was co-funded by the National Institute for Health Research (NIHR), the NIHR BioResource (http://bioresource.nihr.ac.uk) and the NIHR [Cambridge Biomedical Research Centre at the Cambridge University Hospitals NHS Foundation Trust]*. The academic coordinating centre for INTERVAL was supported by core funding from: NIHR Blood and Transplant Research Unit in Donor Health and Genomics (NIHR BTRU-2014-10024), UK Medical Research Council (MR/L003120/1), British Heart Foundation (SP/09/002; RG/13/13/30194; RG/18/13/33946) and the NIHR [Cambridge Biomedical Research Centre at the Cambridge University Hospitals NHS Foundation Trust]. A complete list of the investigators and contributors to the INTERVAL trial is provided in this reference [Citation25]. The academic coordinating centre would like to thank blood donor centre staff and blood donors for participating in the INTERVAL trial. This work was supported by Health Data Research UK, which is funded by the UK Medical Research Council, Engineering and Physical Sciences Research Council, Economic and Social Research Council, Department of Health and Social Care (England), Chief Scientist Office of the Scottish Government Health and Social Care Directorates, Health and Social Care Research and Development Division (Welsh Government), Public Health Agency (Northern Ireland), British Heart Foundation and Wellcome. This work was also supported by the Wellcome Trust grant number 206194. *The views expressed are those of the authors and not necessarily those of the NHS, the NIHR or the Department of Health and Social Care.
William Astle provided guidance on platelet trait data measured by Sysmex. The COPTIC study was conducted within NIHR Programme Grant for Applied Research (RP-PG-0407-10384). Gavin J Murphy was the lead applicant and chief investigator of the COPTIC study. Zoe Plummer and Veerle Verheyden coordinated the COPTIC study and Kurtis Lee performed laboratory analyses.
Disclosure Statement
PA is a full time employee of Regeneron Pharmaceuticals. No potential conflict of interest was reported by the other authors.
Supplementary material
Supplemental data for this article can be accessed on the publisher’s website.
Correction Statement
This article has been republished with minor changes. These changes do not impact the academic content of the article.
Additional information
Funding
Related Research Data
References
- Blüher M. Obesity: global epidemiology and pathogenesis. Nat Rev Endocrinol 05 2019;15:288–298. doi:10.1038/s41574-019-0176-8.
- Bhaskaran K, Dos-Santos-Silva I, Leon DA, Douglas IJ, Smeeth L. Association of BMI with overall and cause-specific mortality: a population-based cohort study of 3·6 million adults in the UK. Lancet Diabetes Endocrinol 12 2018;6:944–953. doi:10.1016/S2213-8587(18)30288-2.
- Nordestgaard BG, Palmer TM, Benn M, Tybjaerg-Hansen A, Davey Smith G, Timpson NJ . The effect of elevated body mass index on ischemic heart disease risk: causal estimates from a Mendelian randomisation approach. PLoS Med 2012;9:e1001212. doi:10.1371/journal.pmed.1001212.
- Dale CE, Fatemifar G, Palmer TM, White J, Prieto-Merino D, Zabaneh D, Engmann JEL, Shah T, Wong A, Warren HR, et al. Causal associations of adiposity and body fat distribution with coronary heart disease, stroke subtypes, and type 2 diabetes mellitus: a mendelian randomization analysis. Circulation Jun 2017;135:2373–2388. doi:10.1161/CIRCULATIONAHA.116.026560.
- Wolk R, Berger P, Lennon RJ, Brilakis ES, Somers VK. Body mass index: a risk factor for unstable angina and myocardial infarction in patients with angiographically confirmed coronary artery disease. Circulation Nov 2003;108:2206–2211. doi:10.1161/01.CIR.0000095270.85646.E8.
- Koupenova M, Kehrel BE, Corkrey HA, Freedman JE. Thrombosis and platelets: an update. Eur Heart J Mar 2017;38:785–791. doi:10.1093/eurheartj/ehw550.
- Puurunen MK, Hwang SJ, Larson MG, Vasan RS, O’Donnell CJ, Tofler G, Johnson AD . ADP platelet hyperreactivity predicts cardiovascular disease in the FHS (Framingham heart study). J Am Heart Assoc 2018;7. doi:10.1161/JAHA.118.008522.
- Barrachina MN, Sueiro AM, Izquierdo I, Hermida-Nogueira L, Guitián E, Casanueva FF, Farndale RW, Moroi M, Jung SM, Pardo M, et al. GPVI surface expression and signalling pathway activation are increased in platelets from obese patients: elucidating potential anti-atherothrombotic targets in obesity. Atherosclerosis 2019;281:62–70. doi:10.1016/j.atherosclerosis.2018.12.023.
- Nardin M, Verdoia M, Sartori C, Pergolini P, Rolla R, Barbieri L, Schaffer A, Marino P, Bellomo G, Suryapranata H, et al. Body mass index and platelet reactivity during dual antiplatelet therapy with clopidogrel or Ticagrelor. J Cardiovasc Pharmacol Oct 2015;66:364–370. doi:10.1097/FJC.0000000000000288.
- Goudswaard LJ, Bell JA, Hughes DA, Corbin LJ, Walter K, Davey Smith G, Soranzo N, Danesh J, Di Angelantonio E, Ouwehand WH, et al. Effects of adiposity on the human plasma proteome: observational and Mendelian randomisation estimates. Int J Obes (Lond) Oct 2021;45:2221–2229. doi:10.1038/s41366-021-00896-1.
- Würtz M, Hvas AM, Kristensen SD, Grove EL. Platelet aggregation is dependent on platelet count in patients with coronary artery disease. Thromb Res Jan 2012;129:56–61. doi:10.1016/j.thromres.2011.08.019.
- Slavka G, Perkmann T, Haslacher H, Greisenegger S, Marsik C, Wagner OF, Endler G . Mean platelet volume may represent a predictive parameter for overall vascular mortality and ischemic heart disease. Arterioscler Thromb Vasc Biol May 2011;31:1215–1218. doi:10.1161/ATVBAHA.110.221788.
- Gill D, Monori G, Georgakis MK, Tzoulaki I, Laffan M. Genetically determined platelet count and risk of cardiovascular disease. Arterioscler Thromb Vasc Biol Dec 2018;38:2862–2869. doi:10.1161/ATVBAHA.118.311804.
- Unay Demirel O, Ignak S, Buyukuysal MC. Immature platelet count levels as a novel quality marker in plateletpheresis. Indian J Hematol Blood Transfus Oct 2018;34:684–690. doi:10.1007/s12288-018-0965-6.
- Ibrahim H, Schutt RC, Hannawi B, DeLao T, Barker CM, Kleiman NS. Association of immature platelets with adverse cardiovascular outcomes. J Am Coll Cardiol Nov 2014. doi:10.1016/j.jacc.2014.06.1210.
- Lev EI. Immature platelets: clinical relevance and research perspectives. Circulation 10 2016;134:987–988. doi:10.1161/CIRCULATIONAHA.116.022538.
- Bernlochner I, Goedel A, Plischke C, Schüpke S, Haller B, Schulz C, Mayer K, Morath T, Braun S, Schunkert H . Impact of immature platelets on platelet response to ticagrelor and prasugrel in patients with acute coronary syndrome. Eur Heart J Dec 2015;36:3202–3210. doi:10.1093/eurheartj/ehv326.
- Ibrahim H, Nadipalli S, DeLao T, Guthikonda S, Kleiman NS. Immature platelet fraction (IPF) determined with an automated method predicts clopidogrel hyporesponsiveness. J Thromb Thrombolysis Feb 2012;33:137–142. doi:10.1007/s11239-011-0665-7.
- Furuncuoğlu Y, Tulgar S, Dogan AN, Cakar S, Tulgar YK, Cakiroglu B. How obesity affects the neutrophil/lymphocyte and platelet/lymphocyte ratio, systemic immune-inflammatory index and platelet indices: a retrospective study. Eur Rev Med Pharmacol Sci Apr 2016;20:1300–1306.
- Han S, Gan D, Wang G, Ru Y, Huang C, Lin J, Zhang L, Meng Z, Zhu S. Associations of platelet indices with body fat mass and fat distribution. Obesity (Silver Spring) 2018;26:1637–1643. doi:10.1002/oby.22294.
- Coban E, Ozdogan M, Yazicioglu G, Akcit F. The mean platelet volume in patients with obesity. Int J Clin Pract Aug 2005;59:981–982. doi:10.1111/j.1742-1241.2005.00500.x.
- Heffron SP, Marier C, Parikh M, Fisher EA, Berger JS. Severe obesity and bariatric surgery alter the platelet mRNA profile. Platelets Nov 2018:1–8. doi:10.1080/09537104.2018.1536261.
- Vaduganathan M, Alviar CL, Arikan ME, Tellez A, Guthikonda S, DeLao T, Granada JF, Kleiman NS, Ballantyne CM, Lev EI, et al. Platelet reactivity and response to aspirin in subjects with the metabolic syndrome. Am Heart J Nov 2008;156:1002.e1–1002.e7. doi:10.1016/j.ahj.2008.08.002.
- Mijovic R, Kovacevic N, Zarkov M, Stosic Z, Cabarkapa V, Mitic G. Reticulated platelets and antiplatelet therapy response in diabetic patients. J Thromb Thrombolysis Aug 2015;40:203–210. doi:10.1007/s11239-014-1165-3.
- Di Angelantonio E, Thompson SG, Kaptoge S, Moore C, Walker M, Armitage J, Ouwehand WH, Roberts DJ, Danesh J, Di Angelantonio E, et al. Efficiency and safety of varying the frequency of whole blood donation (INTERVAL): a randomised trial of 45 000 donors. Lancet Nov 2017;390:2360–2371. doi:10.1016/S0140-6736(17)31928-1.
- Astle WJ, Elding H, Jiang T, Allen D, Ruklisa D, Mann AL, Mead D, Bouman H, Riveros-Mckay F, Kostadima MA, et al. The allelic landscape of human blood cell trait variation and links to common complex disease. Cell 2016;167:1415–1429.e19. doi:10.1016/j.cell.2016.10.042.
- Akbari P, Vuckovic D, Jiang T, Kundu K, Kreuzhuber R, Bao EL, Mayer L, Collins JH, Downes K, Georges M . Genetic analyses of blood cell structure for biological and pharmacological inference. bioRxiv 2020: 2020.01.30.927483. doi:10.1101/2020.01.30.927483.
- Yengo L, Sidorenko J, Kemper KE, Zheng Z, Wood AR, Weedon MN, Frayling TM, Hirschhorn J, Yang J, Visscher PM, et al. Meta-analysis of genome-wide association studies for height and body mass index in ∼700000 individuals of European ancestry. Hum Mol Genet Oct 2018;27:3641–3649. doi:10.1093/hmg/ddy271.
- Purcell S, Neale B, Todd-Brown K, Thomas L, Ferreira MAR, Bender D, Maller J, Sklar P, de Bakker PIW, Daly MJ, et al. PLINK: a tool set for whole-genome association and population-based linkage analyses. Am J Hum Genet Sep 2007;81:559–575. doi:10.1086/519795.
- R Core Team. R: a language and environment for statistical computing. R Foundation for Statistical Computing, Vienna, Austria. 2019. https://www.R-project.org/ Accessed1 October 2021.
- Henningsen A, Hamann JD. system fit: a package for estimating systems of simultaneous equations in R. Journal of Statistical Software. 2007. 2007-12-312007;23:40. doi:10.18637/jss.v023.i04.
- Mumford AD, Harris J, Plummer Z, Lee K, Verheyden V, Reeves BC, Rogers CA, Angelini GD, Murphy GJ . Near-patient coagulation testing to predict bleeding after cardiac surgery: a cohort study. Res Pract Thromb Haemost Oct 2017;1:242–251. doi:10.1002/rth2.12024.
- Grove EL, Hvas AM, Mortensen SB, Larsen SB, Kristensen SD. Effect of platelet turnover on whole blood platelet aggregation in patients with coronary artery disease. J Thromb Haemost Jan 2011;9:185–191. doi:10.1111/j.1538-7836.2010.04115.x.
- Freynhofer MK, Iliev L, Bruno V, Rohla M, Egger F, Weiss T, Hübl W, Willheim M, Wojta J, Huber K, et al. Platelet turnover predicts outcome after coronary intervention. Thromb Haemost 2017;117:923–933. doi:10.1160/TH16-10-0785.
- Cohen A, Harari E, Cipok M, Laish-Farkash A, Bryk G, Yahud E, Sela Y, Lador NK, Mann T, Mayo A . Immature platelets in patients hospitalized with Covid-19. J Thromb Thrombolysis Sep 2020. doi:10.1007/s11239-020-02290-6.
- Klok FA, Kruip MJHA, van der Meer NJM, Arbous MS, Gommers DAMPJ, Kant KM, Kaptein FHJ, van Paassen J, Stals MAM, Huisman MV, et al. Incidence of thrombotic complications in critically ill ICU patients with COVID-19. Thromb Res 2020;191:145–147. doi:10.1016/j.thromres.2020.04.013.
- Kaser A, Brandacher G, Steurer W, Kaser S, Offner FA, Zoller H, Theurl I, Widder W, Molnar C, Ludwiczek O, et al. Interleukin-6 stimulates thrombopoiesis through thrombopoietin: role in inflammatory thrombocytosis. Blood Nov 2001;98:2720–2725. doi:10.1182/blood.v98.9.2720.
- Nikolaou CK, Hankey CR, Lean MEJ. Accuracy of on-line self-reported weights and heights by young adults. Eur J Public Health 10 2017;27:898–903. doi:10.1093/eurpub/ckx077.
- Marcucci CE, Schoettker P. Perioperative hemostasis: coagulation for anesthesiologists. Berlin, Heidelberg: Springer; 2014.