
Abstract
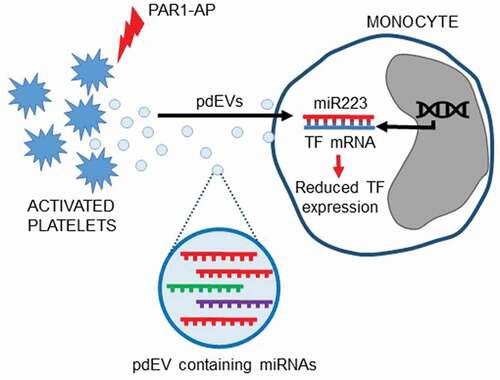
Extracellular vesicles (EVs) released from activated platelets contain microRNAs, the most abundant of which is hsa-miR-223-3p. Endogenous hsa-miR-223-3p suppresses the expression of tissue factor (TF), the initiator of the extrinsic coagulation pathway, in endothelial cells. Monocytes can be induced to express TF to enhance coagulation, but the role of hsa-miR-223-3p in regulating monocyte TF remains unknown. This study examined whether hsa-miR-223-3p from platelet-derived EVs (pdEVs) affects TF expression in monocytes. THP-1 cells, differentiated into a monocyte-like phenotype with 1α,25-dihydroxyvitaminD3, were transfected with hsa-miR-223-3p mimic or control microRNA. Alternatively, THP-1 cells were incubated with pdEVs from PAR1-agonist peptide activated-platelets, as platelet releasate, or pdEVs isolated by ultracentrifugation. Transfection with hsa-miR-223-3p mimic resulted in significant reductions in TF protein, determined by western blotting and flow cytometry and reduced procoagulant activity, measured by a TF-specific factor Xa generation assay, compared to cells transfected with control microRNA. This reduction was reversed by co-transfection with hsa-miR-223-3p inhibitor, AntagomiR-223. Incubation of THP-1 cells with pdEVs also decreased TF expression; however, this was not reversed by AntagomiR-223. Taken together, monocyte TF expression is downregulated by hsa-miR-223-3p, but when transferred via pdEVs the effect was not reversed with Antagomir-223, suggesting other pdEV components may contribute to TF regulation.
Abbreviations: Tissue factor (TF), Factor VII (FVII), activated Factor VII (FVIIa), Factor X (FX), activated Factor X (FXa), extracellular vesicles (EVs), microvesicles (MVs), platelet-derived extracellular vesicles (pdEVs), protease-activated receptor 1 agonist peptide (PAR1-AP), lipopolysaccharide (LPS), P-selectin glycoprotein ligand-1 (PSGL-1), Tris-Buffered Saline Tween (TBST), room temperature (RT)
Introduction
MicroRNAs are short, non-coding RNAs of approximately 22 nucleotides that inhibit gene expression by binding to complementary mRNA sequences, resulting in the repression of translation, or target mRNA degradation [Citation1]. It has been suggested that the majority of circulating microRNAs are associated with extracellular vesicles (EVs), with only low levels of microRNAs found free in the plasma [Citation2,Citation3]. Platelets contain large amounts of microRNAs [Citation4,Citation5] that are released into the circulation in platelet-derived EVs (pdEVs) following platelet activation [Citation6]. Platelets can release different types of EVs; microvesicles (MVs) derived from the plasma membrane, which range in diameter from 100 to 1000 nm and are often procoagulant, and exosomes, released from the endosomal system, which are usually smaller (approximately 40–100 nm) with minimal procoagulant activity [Citation7,Citation8]. microRNAs are thought to be enriched within exosomes rather than other types of EVs [Citation9,Citation10].
It is now well established that microRNAs in pdEVs mediate cell–cell communication via intracellular transfer resulting in changes in gene expression and behavior of recipient cells [Citation11–15]. EVs derived from platelets and megakaryocytes predominate in the circulation of healthy subjects [Citation16], and increased levels of pdEVs have been detected in cardiovascular disease [Citation17–22], most likely as a result of platelet activation [Citation6].
We have previously shown that the main platelet agonists induce the release of microRNA-rich pdEVs that mirror the microRNA content of platelets [Citation8]. hsa-miR-223-3p is the most highly expressed microRNA in platelets [Citation6,Citation23], and our group [Citation8] and others [Citation6,Citation11,Citation23] have shown that hsa-miR-223-3p is also the most abundant microRNA in pdEVs. Activation of platelets with the thrombin receptor protease-activated receptor 1 (PAR-1)-agonist peptide (PAR1-AP) generates predominantly smaller, exosome-like pdEVs containing hsa-miR-223-3p, which have low levels of phosphatidylserine and almost none of the procoagulant activity that characterizes plasma membrane-derived MVs [Citation8].
hsa-miR-223-3p targets the expression of many mRNA species, including the initiator of the extrinsic coagulation pathway, tissue factor (TF) [Citation24]. TF is the cell surface receptor for coagulation factor VII (FVII) and activated FVII (FVIIa). Following vascular injury, TF comes into contact with circulating FVII/FVIIa and initiates the extrinsic coagulation pathway, resulting in factor X activation, thrombin generation, and ultimately fibrin clot formation. Appropriate regulation of TF expression by monocytes is therefore essential, and several transcriptional and post-transcriptional mechanisms exist to control TF expression in these cells [Citation25]. Several microRNAs, including hsa-miR-223-3p, have been identified that bind within the 3ʹ-untranslated region (3ʹ-UTR) of the TF mRNA transcript and inhibit TF expression [Citation24,Citation26–29]. This has been verified in vitro by Li et al. [Citation24] who demonstrated that hsa-miR-223-3p downregulates TF protein expression in endothelial cells. Primary monocytes express TF when stimulated, for example, by pro-inflammatory factors such as lipopolysaccharide (LPS) [Citation25,Citation30,Citation31] or, to lower levels, by the interaction between P-selectin and its cognate ligand, P-selectin glycoprotein ligand-1 (PSGL-1) [Citation32]. However, the effect of exogenous hsa-miR-223-3p on TF expression in monocytes has not been examined. In this study, we have used 1α,25-dihydroxyvitamin D3-differentiated THP-1 cells. These express low levels of TF and thereby serve as a model of monocytes with an early stage of activation to examine whether hsa-miR-223-3p is capable of regulating low levels of TF expression in these cells. We therefore hypothesized that pdEVs could transfer hsa-miR-223-3p to monocytes resulting in the downregulation of TF expression.
Methods
Cell culture and transfection
The THP-1 monocytic cell line was cultured in RPMI 1640 media containing 10% (v/v) fetal calf serum (FCS), under 5% (v/v) CO2 at 37°C. Cells were maintained at a density of 1.5–8 × 10⁵/ml. Prior to experiments, THP-1 cells were differentiated into a monocytic phenotype using 50 nM 1α,25-dihydroxyvitamin D3 (Sigma-Aldrich, Gillingham, UK) for 72 h [Citation33]. Expression of CD14, CD68 and TF was measured by flow cytometry (Gallios flow cytometer, Beckman-Coulter, High Wycombe, UK). Differentiation of THP-1 cells led to monocyte-like CD14 expression, increasing from 0 to 58 ± 13% (Figure SI), no expression of the macrophage marker CD68 (data not shown) and a small reduction in TF expression (Figure SII), in agreement with previous studies [Citation34,Citation35].
Differentiated THP-1 cells (1 × 10⁶) in 2 ml RPMI media containing 10% (v/v) exosome-depleted FCS (Thermo Fisher Scientific, Loughborough, UK) were seeded into 6-well plates. Cells were immediately transfected with 30 nM miRIDIAN hsa-miR-223-3p mimic, with or without 30 nM miRIDIAN hairpin hsa-miR-223-3p inhibitor (AntagomiR-223), or with 30 nM negative control microRNA (Dharmacon Inc., Colorado, USA) using 1 µl Viromer Green transfection reagent (Lipocalyx, Halle, Germany) and incubated at 37°C for 24 h. Transfection efficiency was 90% (Figure SIII) as assessed by flow cytometry of cells transfected with SiGLO Green (5 nM; Dharmacon Inc.) for 24 h. In some experiments, 20 h after transfection with microRNAs, THP-1 cells were treated for 4 h with lipopolysaccharide (LPS; 1 µg/ml) from E. coli 0111:B4 (Sigma-Aldrich), to induce high-level TF expression [Citation30].
Preparing washed platelets and pdEVs
Blood collection was approved by the University of Leicester Ethical Practices Committee and subjects provided written informed consent. Venous blood (25 ml) from healthy volunteers who denied taking platelet-modifying drugs in the preceding 14 days was taken into 3.2% (w/v) trisodium citrate (Vacutainers; Becton Dickinson, Oxford, UK) and acid-citrate-dextrose (0.085 M trisodium citrate, 0.071 M citric acid, 0.11 M glucose) was added at a ratio of 6:1 (v/v), followed by centrifugation at 160 g for 20 min. Platelet-rich plasma was retained, and platelets were pelleted at 600 g for 20 min. Platelets were washed to remove plasma proteins by resuspension in 4 ml of HEPES buffered saline (HBS) (10 mM HEPES, pH6, 150 mM NaCl, 5 mM KCl, 1 mM MgSO4) in the presence of prostacyclin salt (PGI2) (200 ng/ml) and centrifuged again at 600 g for 15 min. Platelets were then resuspended in 1 ml of 0.1 µm-filtered HBS, pH7.4 at a concentration of 450 × 106/ml and incubated for 30 min at room temperature (RT) for the effects of prostacyclin to decay. Washed platelets were incubated with PAR1-AP (10 µM; Sigma-Aldrich) for 10 min at RT to induce EV release. Maximal platelet activation was confirmed by P-selectin expression and annexin V-FITC-binding by flow cytometry as previously described [Citation8]. pdEVs were separated from platelets by centrifugation at 1500 g for 15 min, followed by 13,000 g for 2 min and the supernatant, containing pdEVs, was aliquoted and stored at −80°C until further use. We have previously characterized in detail pdEVs released from platelets in response to PAR1-AP and found them to be small EVs with little procoagulant activity and carry proteins associated with EVs of exosomal origin including tetraspanins and heat shock proteins [Citation8]. We have also previously shown that this method results in an EV preparation free of leukocyte markers [Citation8], indicating the presence of pdEVs only.
In further experiments, to confirm the effects were due to pdEVs and not to other components in the platelet releasate, the pdEV-rich supernatant was centrifuged at 100,000 g for 90 min at RT using an Optima L-90k ultracentrifuge and Type 70 Ti fixed angle rotor (Beckman Coulter). The pdEV pellet was washed with 8 ml of HBS, pH7.4, centrifuged again and resuspended in 0.5 ml of 0.1 µm-filtered HBS, pH7.4.
Characterization of pdEVs
The size distribution and concentration of pdEVs were analyzed immediately after isolation, using a NanoSight NTAS500 instrument (Malvern Panalytical Ltd, Malvern, UK) [Citation36]. Samples were diluted 1 in 20 in 1 ml of 0.1 µm-filtered HBS, pH7.4 and run through the NTAS500 using a camera setting of 12 at 25°C. Three 60 s videos were recorded for each sample and analyzed using the NTA2.3 software (Malvern Panalytical Ltd).
Generation of fluorescently labeled pdEVs from platelets
Washed platelets were incubated with the general lipid membrane fluorescent cell linker dye PKH67 (4 µl) in 250 µl of diluent C (iso-osmotic labeling vehicle) in the presence of PGI2 (200 ng/ml) and incubated at 37°C on a rotating mixer for 5 min. 50 µl of 10% (w/v) bovine serum albumin (BSA) (Thermo Fisher Scientific) was added to the platelets and incubated for 5 min in the dark at RT. Platelets were washed twice by centrifugation at 600 g for 5 min and re-suspended in 1 ml of HBS, pH7.4 in the presence of PGI2 (200 ng/ml). Platelets were pelleted again at 600 g for 5 min, re-suspended in 500 µl of HBS, pH7.4 containing 2 mM CaCl2, then left at RT for 20 min to allow the effects of PGI2 to decay, before stimulation with PAR1-AP (10 µM) for 10 min to generate PKH67-labeled pdEVs.
Fluorescence microscopy of the transfer of pdEVs to THP-1 cells
THP-1 cells (1 × 10⁶) were seeded into 24-well plates and incubated at 37°C for 20 h with either unstained or PKH67-stained pdEVs at a concentration that maintained the 1000:1 ratio of platelets to monocytes in whole blood. Cells were then centrifuged at 600 g for 5 min, washed with HBS, pH7.4 and resuspended in 4% (w/v) paraformaldehyde containing 4ʹ,6-Diamidino-2-Phenylindole, Dilactate (DAPI) (300 nM) (Thermo Fisher Scientific) and Texas Red-conjugated Wheat Germ Agglutinin (WGA) (5 µg/ml) (Thermo Fisher Scientific), and incubated for 60 min at RT in the dark. Cells were centrifuged at 600 g for 5 min, re-suspended in 0.2% formylsaline (500 µl) and 100 µl loaded into Cytospin funnels (Thermo Fisher Scientific) and centrifuged at 600 g for 2 min. Slides were mounted in Prolong AntiFade Gold (Thermo Fisher Scientific) and examined using an EVOS fluorescence microscope (Thermo Fisher Scientific) and an Olympus FV1000 confocal microscope (Olympus, Southend-on-Sea, UK).
Measurement of the transfer of microRNAs from pdEVs to THP-1 cells
Real-time RT-PCR for microRNA expression was carried out to confirm the transfer of hsa-miR-223-3p from pdEVs to THP-1 cells as described in Figure SIV. Where indicated, THP-1 cells were pre-treated with actinomycin D (10 nM) for 5 min prior to incubation with pdEVs to inhibit de novo transcription. hsa-miR-125b-5p was used to normalize data as it is absent from platelets and is unaffected by addition of pdEVs or actinomycin D to THP-1 cells (Figure SIV). Primer sequences for hsa-miR-223-3p and hsa-miR-125b-5p are shown in Table SI.
Transfection of pdEVs with antagomir-223
pdEVs (1 × 10⁷) in 50 µl PBS, pH7.4, were transfected with AntagomiR-223 (20 pmol) or negative control microRNA (20 pmol) using Exo-Fect reagent (10 µl) (System Biosciences, Palo Alto, USA) by incubation at 37°C for 10 min according to the manufacturer’s instructions. pdEVs were then precipitated with ExoQuick-TC reagent (30 µl) on ice for 30 min, centrifuged at 20,000 g for 3 min and resuspended in 150 µl PBS, pH7.4. THP-1 cells (1.5 × 10⁵) were seeded into 12-well plates in 1 ml RPMI containing 10% (v/v) exosome-depleted FCS and incubated with the transfected pdEVs at 37°C for 24 h. To confirm the ability of Exo-Fect to transfect pdEVs with RNA, Exo-Fect was used to transfect pdEVs with a Texas Red-conjugated control siRNA (20 pmol; System Biosciences). The transfer of this fluorescently labeled RNA from pdEVs to THP-1 cells was then determined using flow cytometry (Figure SV).
Measurement of TF expression
Total TF protein expression was measured by western blot analysis. THP-1 cells were lysed in RIPA buffer (50 mM Tris-HCl, pH7.4, 150 mM NaCl, 0.5% (w/v) sodium deoxycholate, 0.1% (w/v) SDS, 1% (v/v) Triton X-100, 1% (v/v) protease inhibitors), and protein concentrations measured using the DC protein assay (Bio-Rad Laboratories Ltd, Watford, UK). Samples containing 50 mM DTT were denatured at 95°C for 10 min (Sigma-Aldrich), and 20 µg of protein per sample separated by 12% (w/v) SDS-PAGE and transferred onto nitrocellulose membranes. Membranes were blocked for 1 h with Tris-Buffered Saline-Tween (TBST; 50 mM Tris-HCl, pH8, 150 mM NaCl, 0.1% (v/v) Tween-20) containing 5% (w/v) non-fat milk and probed with an anti-TF antibody (HTF-1; VWR International Ltd, Lutterworth, UK) or anti-beta actin antibody (New England Biolabs, Hitchin, UK) diluted 1:1000 at 4°C overnight, followed by anti-mouse or anti-rabbit HRP-conjugated secondary antibodies (R&D Systems, Abingdon, UK) for 1 h at RT. Proteins were detected using the ECL Prime detection reagent (GE Healthcare Life Sciences, Little Chalfont, UK). Images were acquired using an ImageQuant LAS 500 imager (GE Healthcare Life Sciences) and densitometry performed using ImageJ. TF mRNA expression was analyzed by RT-qPCR as described previously [Citation37].
TF activity of cell lysates was measured using a TF-specific FXa-generation assay. THP-1 cells in 200 µl HBS, pH 7.4, 0.1% (w/v) BSA, 0.1% (v/v) sodium azide were freeze-thawed once and sonicated on ice for 3 s. Cell lysates diluted 1 in 10 in HBS, pH7.4 were incubated with the TF-inhibitory antibody HTF-1 (20 µg/ml) or mouse IgG1 isotype control (20 µg/ml) for 15 min at RT. A standard curve was prepared with 2.5–40 nM FXa (Enzyme Research Labs, Swansea, UK). Samples or standards (50 µl) in 96-well plates were incubated at 37°C for 15 min with FVIIa (20 nM; Enzyme Research Labs) and FX (300 nM; Enzyme Research Labs) in HBS, pH7.4 containing 10 mM CaCl2. FXa chromogenic substrate (25 µl; 4 mM in 50 mM Tris-HCl, pH7.5, 25 mM EDTA) (CS-11(32); Hyphen-BioMed, Neuville-sur-Oise, France) was added. Samples were incubated at 37°C for 5 min and the reaction stopped with acetic acid (50 µl; 10 mM). Absorbance was read at 405 nm using a KCJunior plate reader (Bio Tek, Swindon, UK). TF-specific FXa activity was calculated as absorption at 405 nm of samples incubated with HTF-1 subtracted from the absorption of samples incubated with IgG. Absorption values were then converted to FXa concentrations using the standard curve.
Cell surface expression of TF was analyzed by flow cytometry. THP-1 cells were resuspended in HBS, pH7.4 (250 µl) containing 0.1% (w/v) BSA and 0.1% (v/v) sodium azide. 50 µl of cell suspension was incubated with anti-TF FITC-conjugated antibody (HTF-1; Miltenyi Biotec Ltd, Bisley, UK) in 50 µl of HBS, pH7.4 at a final dilution of 1 in 100. Mouse IgG-FITC (Miltenyi Biotec) was used as an isotype control at the same dilution. Cells were incubated at 4°C for 15 min, diluted 1 in 10 in HBS, pH7.4 and analyzed using a Gallios flow cytometer.
Statistical analysis
Data represent calculated mean values ± standard deviation (SD) from the number of experiments stated in the figure legends. Data were analyzed using GraphPad Prism version 7 or 9 (GraphPad Software, San Diego, USA). Significance was determined using paired t-tests as appropriate and values of p ≤ .05 were considered significant.
Results
Transfection of THP-1 cells with hsa-miR-223-3p mimic results in the downregulation of TF expression
1α,25-dihydroxyvitamin D3-differentiated THP-1 cells were used as a model of monocytes: they expressed CD14 (Figure SI), low levels of TF (Figure SII) and did not express CD68 and thereby served as models of minimally stimulated monocytes. The use of a monocytic cell with low levels of TF expression therefore allowed examination of the potentially more subtle effects of hsa-miR-223-3p on TF expression in these cells.
Transfection of these differentiated THP-1 cells with hsa-miR-223-3p mimic (30 nM) resulted in a significant downregulation (35%) of total TF protein expression compared to cells transfected with the same concentration of control microRNA, as measured by western blot (p = .0134; . A similar reduction (31.4%) in TF activity was seen in the THP-1 cell lysates, measured as TF-specific FXa generation (p = .0076; ). There was a smaller (9.7%) but significant decrease in expression of TF antigen on the cell surface as measured by flow cytometry (p < .0001; ). Levels of TF mRNA expression were not altered in THP-1 cells transfected with the hsa-miR-223-3p mimic compared to cells transfected with the negative control miRNA (Figure SVI).
Figure 1. TF expression in THP-1 cells transfected with hsa-miR-223-3p mimic. 1α,25-dihydroxyvitamin D3-differentiated THP-1 cells (1 ×10⁶) were seeded into 6-well plates in media containing 10% (v/v) exosome-depleted FCS, transfected with 30 nM of hsa-miR-223-3p mimic or negative control microRNA using Viromer Green transfection reagent, and then incubated for 24 h. A, B) Total TF expression measured by western blot analysis (n = 5). C) TF activity of cell lysates measured using a TF-specific FXa generation assay (n = 3). D, E) Cell surface TF expression analyzed by flow cytometry (n = 6).
To confirm the downregulation of TF protein expression was due to hsa-miR-223-3p, THP-1 cells were co-transfected with hsa-miR-223-3p mimic and a hairpin inhibitor of hsa-miR-223-3p, AntagomiR-223. As before, transfection of cells with hsa-miR-223-3p mimic resulted in a downregulation in TF protein expression, whereas co-transfection of the hsa-miR-223-3p mimic with AntagomiR-223 (30 nM) significantly reversed the effect of the mimic on total TF protein expression () and cell surface TF antigen ().
Figure 2. TF expression in THP-1 cells co-transfected with hsa-miR-223-3p mimic and AntagomiR-223. 1α,25-dihydroxyvitamin D3-differentiated THP-1 cells (1 ×10⁶) were seeded into 6-well plates in media containing 10% (v/v) exosome-depleted FCS. Cells were co-transfected with 30 nM of hsa-miR-223-3p mimic together with 30 nM of AntagomiR-223, or hsa-miR-223-3p mimic (30 nM) together with negative control microRNA (30 nM) using Viromer Green (VG) transfection reagent and then incubated for 24 h. A&B) Total TF expression measured by western blot analysis (n = 3). C) Cell surface TF expression analyzed by flow cytometry (n = 4) (raw mean fluorescence intensity values are shown on the y-axis).
As expected, treatment of THP-1 cells with LPS (1 µg/ml) for 4 h resulted in a significant increase in total TF protein expression (Figure SVII). This was, however, unaffected when the LPS-treated THP-1 cells were transfected with the hsa-miR-223-3p mimic (Figure SVII), indicating that while low levels of TF expression can be reduced by hsa-miR-223-3p, the high levels of TF induced by LPS cannot be overcome by hsa-miR-223-3p.
Characterization of pdEVs released from platelets activated with PAR1-AP
EVs were generated from platelets by activation through the PAR-1 receptor, which we have previously shown to preferentially release exosome-like EVs rich in microRNAs, the most abundant of which is hsa-miR-223-3p [Citation8]. Flow cytometric measurement of P-selectin exposure on platelets in response to PAR1-AP (10 µM) confirmed that >97% of platelets were positive for this marker of degranulation (Figure SVIIIA) but showed minimal surface exposure of procoagulant phospholipid, as evidenced by low levels of annexin V binding (14.8 ± 11.2%) compared to non-activated platelets (3 ± 2%) (Figure SVIIIB).
Nanoparticle Tracking Analysis of the platelet releasate and the isolated pdEVs revealed that the mode diameter of vesicles was 182 nm and 171 nm, respectively (Figures SIXA,B), in line with the size of exosomes, rather than larger procoagulant MVs, which agrees with our previous characterization of pdEVs released following PAR-1 receptor stimulation [Citation8].
pdEVs are transferred to THP-1 cells
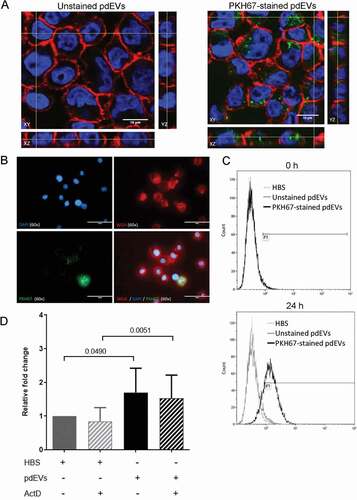
THP-1 cells were incubated with platelet releasate containing fluorescent pdEVs generated from PAR1-AP stimulated, PKH67-labeled platelets. Fluorescence microscopy and flow cytometry confirmed that both platelets and pdEVs were successfully labeled with PKH67 (Figure SX). Fluorescently labeled pdEVs were transferred to and internalized by THP-1 cells, as demonstrated by confocal microscopy (), wide field fluorescence microscopy () and flow cytometry (). RT-PCR analysis demonstrated that pdEV uptake was accompanied by an increase in hsa-miR-223-3p levels in THP-1 cells (). This was due to the transfer of microRNA rather than de novo expression, as it was unaffected by actinomycin D ().
Figure 3. Examination of the transfer of pdEVs to THP-1 cells. THP-1 cells were incubated with unstained or PKH67-stained pdEVs. A) Following 16 h incubation, cells were fixed and visualized using an Olympus FV1000 confocal microscope. A single Z-axis slice of the XY stack is shown alongside orthogonal slices in the YZ (right) and XZ (bottom) axis. Images were taken using a 60x objective with 4x zoom. Blue = DAPI stained nuclei; Red = Texas Red-conjugated WGA-labeled cell membrane; Green = PKH67-labeled pdEVs. B) Cells were fixed and visualized by fluorescence microscopy using an EVOS microscope. C) pdEV-uptake by THP-1 cells was also examined by flow cytometry at 0 and 24 h incubation with PKH67-stained pdEVs. Light gray histogram = HBS; dark gray = unstained pdEVs; black = PKH67-stained pdEVs. D) THP-1 cells were treated with actinomycin D (10 nM) for 5 min and then incubated with HBS or pdEV for 16 h. The cells were harvested and the RNA extracted. The expression of hsa-miR-223-3p was measured by RT-PCR and normalized to the expression of hsa-miR-125b-5p. The data show the relative fold change in hsa-miR-223-3p expression compared to the control HBS samples for each replicate (n =5±SD, paired t-test).
Incubation of THP-1 cells with platelet releasate or pdEVs results in the downregulation of TF expression
The expression of TF protein in THP-1 cells incubated for 24 h with platelet releasate showed a very similar pattern of TF expression to that observed in the THP-1 cells transfected with hsa-miR-223-3p. Total TF protein was reduced, albeit not to a statistically significant degree (p = .0922), in cells incubated with platelet releasate compared to cells incubated with HBS alone (). As with the transfection of the hsa-miR-223-3p mimic, there was also a significant reduction in TF-specific procoagulant activity compared to cells incubated with HBS (p = .0024; ), and a small but significant reduction in cell surface TF expression (p = .0112; ). THP-1 cells incubated with isolated pdEVs showed similar reductions in total TF expression (p = .0184; ), TF-specific FXa generation (p = .288; ) and cell surface TF expression (p = .011; ) compared to control cells.
Figure 4. TF expression in THP-1 cells incubated with platelet releasate. 1α,25-dihydroxyvitamin D3-differentiated THP-1 cells (1 ×10⁶) were seeded into 6-well plates in media containing 10% (v/v) exosome-depleted FCS and incubated with platelet releasate (PR) at a ratio of 5000 vesicles/monocyte for 24 h. A, B) Total TF expression measured by western blot analysis (n =5). C) TF activity of cell lysates measured using a TF-specific FXa generation assay (n =5). D, E) Cell surface TF expression examined by flow cytometry (n =5).
Figure 5. TF expression in THP-1 cells incubated with pdEVs. 1α,25-dihydroxyvitamin D3-differentiated THP-1 cells (1 ×10⁶) were seeded into 6-well plates in media containing 10% (v/v) exosome-depleted FCS and incubated with pdEVs at a ratio of 1000 vesicles/monocyte for 24 h. A, B) Total TF expression measured by western blot analysis (n =7). C) TF activity of cell lysates measured using a TF-specific FXa generation assay (n =3). D, E) Cell surface TF expression examined by flow cytometry (n =3).
To examine whether the downregulation of TF expression by pdEVs was solely due to hsa-miR-223-3p within these vesicles, pdEVs were first transfected with AntagomiR-223 to inhibit hsa-miR-223-3p, and then incubated with THP-1 cells for 24 h, after which the expression of TF was measured. Initially, pdEVs were transfected with a control Texas Red-labeled siRNA and then incubated with THP-1 cells. The pdEV-mediated transfer of this fluorescently labeled siRNA to THP-1 cells was successful in 85% of cells, as assessed by flow cytometry (Figure SV). However, subsequent incubation of THP-1 cells with pdEVs transfected with AntagomiR-223 (20 pmol) did not reverse the effect of pdEVs on total TF protein expression compared to THP-1 cells incubated with pdEVs transfected with control microRNA (). Interestingly, there was, however, a small but significant increase in cell surface TF expression (p = .0034; ).
Figure 6. TF expression in THP-1 cells incubated with pdEVs transfected with AntagomiR-223. pdEVs were transfected with AntagomiR-223 or negative control microRNA and then incubated with THP-1 cells (1.5 × 10⁵) in 12-well plates for 24 h. A, B) Total TF expression measured by western blot analysis (n =4). C, D) Cell surface TF expression examined by flow cytometry (n =3). Light gray histogram = IgG-FITC; dark gray histogram = TF expression on THP-1s incubated with pdEVs transfected with control microRNA; black histogram = TF expression on THP-1s incubated with pdEVs transfected with AntagomiR-223.
Discussion
The expression of TF in monocytes and other vascular cells is tightly regulated to avoid unnecessary coagulation and thrombosis under homeostatic conditions. However, monocytes readily express TF in response to a number of stimuli including LPS [Citation25,Citation30,Citation31], inflammatory cytokines [Citation38,Citation39], and via the interaction of platelet P-selectin with its cognate ligand, PSGL-1 on monocytes [Citation32,Citation40], as inflammation- and/or haemostatic-driven mechanisms to promote coagulation and prevent blood loss. TF expression is controlled by a complex promoter in the 5ʹ-region of the TF gene that contains SP-1 binding sites to regulate basal TF expression, and AP-1 and NFκB sites that regulate LPS-mediated TF expression [Citation31]. Furthermore, several microRNAs have been found to regulate the expression of TF in various cell types [Citation24,Citation26–29,Citation41,Citation42]. Interestingly, Li et al. [Citation24] demonstrated that levels of endogenous hsa-miR-223-3p in endothelial cells were inversely correlated with TF expression in vivo, and that transfection of endothelial cells in vitro with a hsa-miR-223-3p mimic downregulated TF expression. Work from our group [Citation8] and others [Citation6,Citation23] has shown that hsa-miR-223-3p is the most abundant microRNA in pdEVs. We therefore examined whether hsa-miR-223-3p can be transferred from platelets to monocytic cells via pdEVs and regulate monocyte TF expression.
1α,25-dihydroxyvitamin D3-differentiated THP-1 cells expressed low levels of TF (Figure SII) and were therefore used as a model of minimally stimulated monocytes. High levels of TF expression are induced in monocytes by stimuli such as LPS [Citation25,Citation30,Citation31]. However, an intermediate level of monocyte activation and lower levels of TF expression may be induced by other stimuli, including the interaction between PSGL-1 on monocytes and P-selectin on platelets [Citation32,Citation40]. This model therefore allowed examination of the potentially subtle effects of hsa-miR-223-3p on TF expression in monocytes under conditions of minimal monocyte activation.
Transfection of THP-1 monocytic cells with a hsa-miR-223-3p mimic resulted in the downregulation of low levels of TF protein expression and procoagulant activity present in differentiated THP-1 cells, compared to cells transfected with control microRNA (), which was reversed by co-transfection with the hsa-miR-223-3p inhibitor AntagomiR-223 (). This demonstrates for the first time that exogenous hsa-miR-223-3p can downregulate TF expression in monocytic cells and is in agreement with the previous study by Li et al. [Citation24], in which the same concentration of hsa-miR-223-3p mimic (30 nM) caused downregulation of TF protein expression in endothelial cells. microRNAs bind to specific sites in the 3ʹ-UTRs of mRNA transcripts and can suppress gene expression either by promoting mRNA degradation or by repressing translation [Citation1]. hsa-miR-223-3p can bind to a complementary site within the 3ʹ-UTR of the TF mRNA transcript to control its expression [Citation24]. In the present study, TF mRNA levels were not altered by the hsa-miR-223-3p mimic (Figure SVI), suggesting that the reduction in TF protein expression observed with the hsa-miR-223-3p mimic is due to translational suppression rather than mRNA degradation in THP-1 cells [Citation1], which is in contrast to the study by Li et al. [Citation24]. This suggests that there may be different mechanisms regulating TF expression in these two cell types.
While total TF protein and TF-specific procoagulant activity were significantly reduced in cells transfected with hsa-miR-223-3p mimic, cell surface TF expression was found to be only slightly (albeit significantly) reduced (). Intracellular TF is mostly localized to the Golgi apparatus [Citation43] and is transported to the cell surface following PAR2 activation [Citation44,Citation45]. In the absence of activation of the THP-1 cells, it is likely that the turnover rate of TF at the plasma membrane was minimal and TF remained in intracellular stores. We did not explore the effect of hsa-miR-223-3p on surface TF expression in LPS-treated THP-1cells since the hsa-miR-223-3p mimic had no significant effect on overall TF protein expression under these conditions (Figure SVII). This lack of TF downregulation by hsa-miR-223-3p in the presence of LPS is unlikely to be due to degradation of the hsa-miR-223-3p mimic prior to LPS treatment because microRNAs are stable, with an average half-life of several hours [Citation46,Citation47]. Therefore, this suggests that while hsa-miR-223-3p has the ability to regulate low levels of TF expression, it cannot downregulate the high levels of TF expression that are generated in monocytes in response to a major stimulus such as LPS.
To investigate the effect of pdEVs on TF expression in THP-1 cells, pdEVs were generated by stimulation of platelets with PAR1-AP. This resulted in the release of small exosome-like vesicles (mode size: 171–182 nm) that we have previously shown have limited procoagulant activity and are enriched in microRNA as well as the tetraspanins and heat shock proteins that characterize exosomes [Citation8]. Other, plasma-derived particulates such as lipoproteins or protein aggregates were unlikely to be present in these preparations, as the platelets had been washed with low-speed centrifugation steps to remove traces of plasma prior to stimulation with PAR1-AP to induce EV release. Confocal microscopy confirmed that pdEVs were transferred to THP-1 cells and internalized within 24 h, while RT-PCR established the transfer of hsa-miR-223-3p via pdEVs (). pdEVs have been shown to interact with other cell types and transfer their microRNA, leading to alterations in gene expression and cellular processes [Citation11–15]. Specifically, previous investigations have demonstrated that pdEVs transfer hsa-miR-223-3p from platelets to endothelial cells, resulting in changes in gene expression [Citation11,Citation48,Citation49]. Previous studies have also shown that pdEVs containing hsa-miR-223-3p can be taken up by different cell types at sites of arterial injury including endothelial cells [Citation48,Citation49], smooth muscle cells [Citation50,Citation51], and macrophages [Citation12]; data that suggests hsa-miR-223-3p may play an important role in the progression of cardiovascular disease.
Since incubation of THP-1 cells with pdEVs or platelet releasate rich in pdEVs resulted in the downregulation of TF protein expression and procoagulant activity (), and since we [Citation8] and others [Citation6,Citation23] have shown that hsa-miR-223-3p is the most abundant microRNA in pdEVs, we hypothesized that hsa-miR-223-3p within pdEVs is transferred to THP-1 cells and downregulates TF expression. In an attempt to confirm this, pdEVs were transfected with an inhibitor of hsa-miR-223-3p, AntagomiR-223. However, although we clearly demonstrated transfer of hsa-miR-223-3p and concomitant downregulation of TF, incubation of THP-1 cells with AntagomiR-223-transfected pdEVs had no significant effect on total TF expression compared to cells incubated with control microRNA-transfected pdEVs (). This is in contrast to the previous study of Laffont et al. [Citation11], which showed that transfection of endothelial cells with a vector expressing an mRNA sequence complementary to hsa-miR-223-3p, which acted as an hsa-miR-223-3p “sponge,” reversed the effects on gene expression of hsa-miR-223-3p derived from pdEVs.
Although hsa-miR-223-3p is the most abundant microRNA in pdEVs, these vesicles contain many other microRNA species, several of which can regulate TF expression including miR-19a [Citation41], miR-19b [Citation42,Citation52], miR-20a [Citation42], miR-93/106b [Citation27], miR-126 [Citation28] and miR-145 [Citation29], all of which were found in significant amounts in PAR1-AP-generated pdEVs [Citation8] (Figure SXI). Most of these microRNAs bind to the 3ʹ-UTR of the TF mRNA transcript and suppress TF expression. It is therefore likely that other microRNAs present in pdEVs are transferred to THP-1 cells by pdEVs and downregulate TF expression in these cells. Furthermore, microRNAs can work in combination to regulate the expression of a single gene [Citation53]. Therefore, specific inhibition of hsa-miR-223-3p within pdEVs may not be sufficient to suppress the downregulation of TF expression. Furthermore, other contents of pdEVs such as growth factors [Citation54], lipid components [Citation55] and mRNAs [Citation56] may alter TF expression in monocytes. Since individual microRNAs usually only have modest, fine-tuning effects on gene expression, it is plausible that other factors within pdEVs could contribute to the downregulation of TF expression in monocytes that would not be reversed by a hsa-miR-223-3p specific AntagomiR. Further detailed studies are therefore required to address which components of pdEVs regulate TF expression in monocytic cells.
In conclusion, this study has demonstrated that hsa-miR-223-3p mimic can downregulate TF expression in THP-1 monocytic cells, despite the pre-existence of significant levels of this microRNA in monocytes [Citation57,Citation58] and THP-1 cells (). While a similar effect was seen with pdEVs that were able to transfer hsa-miR-223-3p to THP-1 cells, the reduction in TF expression could not be solely attributed to hsa-miR-223-3p. Plasma contains a large number of pdEVs that contain high levels of hsa-miR-233-3p and other microRNAs capable of downregulating TF. However, since levels of both pdEVs and microRNAs are reported to be elevated in patients with cardiovascular disease [Citation17–22], the transfer of microRNAs to monocytes by pdEVs may be a mechanism to regulate TF expression in monocytes to prevent or modulate unnecessary initiation of coagulation.
Author contributions
MEWC designed and performed experiments, analysed data and wrote the manuscript. ARA performed experiments in and Figures SIV, SX and SXI, participated in the experimental design, and read and edited the manuscript. AHG conceived the study, designed experiments and edited the manuscript.
Supplemental Material
Download PDF (839.1 KB)Disclosure statement
No potential conflict of interest was reported by the author(s).
Supplementary material
Supplemental data for this article can be accessed on the publisher’s website.
Additional information
Funding
References
- Cannell IG, Kong YW, Bushell M. How do microRNAs regulate gene expression? Biochem Soc Trans. 2008;36(6):1224–1231. doi:10.1042/BST0361224.
- Diehl P, Fricke A, Sander L, Stamm J, Bassler N, Htun N, Ziemann M, Helbing T, El-Osta A, Jowett JB, et al. Microparticles: major transport vehicles for distinct microRNAs in circulation. Cardiovasc Res. 2012;93(4):633–644. doi:10.1093/cvr/cvs007.
- Shan Z, Qin S, Li W, Wu W, Yang J, Chu M, Li X, Huo Y, Schaer GL, Wang S, et al. An endocrine genetic signal between blood cells and vascular smooth muscle cells: role of MicroRNA-223 in smooth muscle function and atherogenesis. J Am Coll Cardiol. 2015;65(23):2526–2537. doi:10.1016/j.jacc.2015.03.570.
- Plé H, Landry P, Benham A, Coarfa C, Gunaratne PH, Provost P. The repertoire and features of human platelet microRNAs. PLoS One. 2012;7(12):e50746. doi:10.1371/journal.pone.0050746.
- Landry P, Plante I, Ouellet DL, Perron MP, Rousseau G, Provost P. Existence of a microRNA pathway in anucleate platelets. Nat Struct Mol Biol. 2009;16(9):961–966. doi:10.1038/nsmb.1651.
- Willeit P, Zampetaki A, Dudek K, Kaudewitz D, King A, Kirkby NS, Crosby-Nwaobi R, Prokopi M, Drozdov I, Langley SR, et al. Circulating microRNAs as novel biomarkers for platelet activation. Circ Res. 2013;112(4):595–600. doi:10.1161/CIRCRESAHA.111.300539.
- Heijnen HF, Schiel AE, Fijnheer R, Geuze HJ, Sixma JJ. Activated platelets release two types of membrane vesicles: microvesicles by surface shedding and exosomes derived from exocytosis of multivesicular bodies and alpha-granules. Blood. 1999;94(11):3791–3799. doi:10.1182/blood.V94.11.3791.
- Ambrose AR, Alsahli MA, Kurmani SA, Goodall AH. Comparison of the release of microRNAs and extracellular vesicles from platelets in response to different agonists. Platelets. 2018;29(5):446–454. doi:10.1080/09537104.2017.1332366.
- Gallo A, Tandon M, Alevizos I, Illei GG. The majority of microRNAs detectable in serum and saliva is concentrated in exosomes. PLoS One. 2012;7(3):e30679. doi:10.1371/journal.pone.0030679.
- Crescitelli R, Lässer C, Szabó TG, Kittel A, Eldh M, Dianzani I, Buzás EI, Lötvall J. Distinct RNA profiles in subpopulations of extracellular vesicles: apoptotic bodies, microvesicles and exosomes. J Extracell Vesicles. 2013;2(1):20677. doi:10.3402/jev.v2i0.20677.
- Laffont B, Corduan A, Plé H, Duchez AC, Cloutier N, Boilard E, Provost P. Activated platelets can deliver mRNA regulatory Ago2•microRNA complexes to endothelial cells via microparticles. Blood. 2013;122(2):253–261. doi:10.1182/blood-2013-03-492801.
- Laffont B, Corduan A, Rousseau M, Duchez AC, Lee CH, Boilard E, Provost P. Platelet microparticles reprogram macrophage gene expression and function. Thromb Haemost. 2016;115(2):311–323. doi:10.1160/th15-05-0389.
- Bao H, Chen YX, Huang K, Zhuang F, Bao M, Han Y, Chen XH, Shi Q, Yao QP, Qi YX. Platelet-derived microparticles promote endothelial cell proliferation in hypertension via miR-142–3p. FASEB J. 2018;32(7):3912–3923. doi:10.1096/fj.201701073R.
- Zhang Y, Zhang W, Zha C, Liu Y. Platelets activated by the anti-β2GPI/β2GPI complex release microRNAs to inhibit migration and tube formation of human umbilical vein endothelial cells. Cell Mol Biol Lett. 2018;23(1):24. doi:10.1186/s11658-018-0091-3.
- Anene C, Graham AM, Boyne J, Roberts W. Platelet microparticle delivered microRNA-Let-7a promotes the angiogenic switch. Biochim Biophys Acta Mol Basis Dis. 2018;1864(8):2633–2643. doi:10.1016/j.bbadis.2018.04.013.
- Arraud N, Linares R, Tan S, Gounou C, Pasquet JM, Mornet S, Brisson AR. Extracellular vesicles from blood plasma: determination of their morphology, size, phenotype and concentration. J Thromb Haemost. 2014;12(5):614–627. doi:10.1111/jth.12554.
- Hartopo AB, Puspitawati I, Gharini PP, Setianto BY. Platelet microparticle number is associated with the extent of myocardial damage in acute myocardial infarction. Arch Med Sci. 2016;12:529–537. doi:10.5114/aoms.2016.59926.
- Lukasik M, Rozalski M, Luzak B, Michalak M, Ambrosius W, Watala C, Kozubski W. Enhanced platelet-derived microparticle formation is associated with carotid atherosclerosis in convalescent stroke patients. Platelets. 2013;24(1):63–70. doi:10.3109/09537104.2011.654292.
- Stępień E, Stankiewicz E, Zalewski J, Godlewski J, Zmudka K, Wybrańska I. Number of microparticles generated during acute myocardial infarction and stable angina correlates with platelet activation. Arch Med Res. 2012;43(1):31–35. doi:10.1016/j.arcmed.2012.01.006.
- Chiva-Blanch G, Laake K, Myhre P, Bratseth V, Arnesen H, Solheim S, Badimon L, Seljeflot I. Platelet-, monocyte-derived and tissue factor-carrying circulating microparticles are related to acute myocardial infarction severity. PLoS One. 2017;12(2):e0172558. doi:10.1371/journal.pone.0172558.
- Jung C, Sörensson P, Saleh N, Arheden H, Rydén L, Pernow J. Circulating endothelial and platelet derived microparticles reflect the size of myocardium at risk in patients with ST-elevation myocardial infarction. Atherosclerosis. 2012;221(1):226–231. doi:10.1016/j.atherosclerosis.2011.12.025.
- Tan KT, Tayebjee MH, Lim HS, Lip GY. Clinically apparent atherosclerotic disease in diabetes is associated with an increase in platelet microparticle levels. Diabet Med. 2005;22(12):1657–1662. doi:10.1111/j.1464-5491.2005.01707.x.
- Zampetaki A, Willeit P, Tilling L, Drozdov I, Prokopi M, Renard JM, Mayr A, Weger S, Schett G, Shah A, et al. Prospective study on circulating MicroRNAs and risk of myocardial infarction. J Am Coll Cardiol. 2012;60(4):290–299. doi:10.1016/j.jacc.2012.03.056.
- Li S, Chen H, Ren J, Geng Q, Song J, Lee C, Cao C, Zhang J, Xu N. MicroRNA-223 inhibits tissue factor expression in vascular endothelial cells. Atherosclerosis. 2014;237(2):514–520. doi:10.1016/j.atherosclerosis.2014.09.033.
- Brand K, Fowler BJ, Edgington TS, Mackman N. Tissue factor mRNA in THP-1 monocytic cells is regulated at both transcriptional and posttranscriptional levels in response to lipopolysaccharide. Mol Cell Biol. 1991;11(9):4732–4738. doi:10.1128/mcb.11.9.4732-4738.1991.
- Zhang X, Yu H, Lou JR, Zheng J, Zhu H, Popescu NI, Lupu F, Lind SE, Ding WQ. MicroRNA-19 (miR-19) regulates tissue factor expression in breast cancer cells. J Biol Chem. 2011;286(2):1429–1435. doi:10.1074/jbc.M110.146530.
- Chuang TD, Luo X, Panda H, Chegini N. miR-93/106b and their host gene, MCM7, are differentially expressed in leiomyomas and functionally target F3 and IL-8. Mol Endocrinol. 2012;26(6):1028–1042. doi:10.1210/me.2012-1075.
- Witkowski M, Weithauser A, Tabaraie T, Steffens D, Kränkel N, Witkowski M, Stratmann B, Tschoepe D, Landmesser U, Rauch-Kroehnert U. Micro-RNA-126 reduces the blood thrombogenicity in diabetes mellitus via targeting of tissue factor. Arterioscler Thromb Vasc Biol. 2016;36(6):1263–1271. doi:10.1161/ATVBAHA.f115.306094.
- Sahu A, Jha PK, Prabhakar A, Singh HD, Gupta N, Chatterjee T, Tyagi T, Sharma S, Kumari B, Singh S, et al. MicroRNA-145 impedes thrombus formation via targeting tissue factor in venous thrombosis. EBioMedicine. 2017;26:175–186. doi:10.1016/j.ebiom.2017.11.022.
- Gregory SA, Morrissey JH, Edgington TS. Regulation of tissue factor gene expression in the monocyte procoagulant response to endotoxin. Mol Cell Biol. 1989;9(6):2752–2755. doi:10.1128/mcb.9.6.2752-2755.1989.
- Oeth P, Parry GC, Mackman N. Regulation of the tissue factor gene in human monocytic cells. Role of AP-1, NF-kappa B/Rel, and Sp1 proteins in uninduced and lipopolysaccharide-induced expression. Arterioscler Thromb Vasc Biol. 1997;17(2):365–374. doi:10.1161/01.ATV.17.2.365.
- Celi A, Pellegrini G, Lorenzet R, De Blasi A, Ready N, Furie BC, Furie B. P-selectin induces the expression of tissue factor on monocytes. Proc Natl Acad Sci U S A. 1994;91(19):8767–8771. doi:10.1073/pnas.91.19.8767.
- Daigneault M, Preston JA, Marriott HM, Whyte MK, Dockrell DH. The identification of markers of macrophage differentiation in PMA-stimulated THP-1 cells and monocyte-derived macrophages. PLoS One. 2010;5(1):e8668. doi:10.1371/journal.pone.0008668.
- Chung J, Koyama T, Ohsawa M, Shibamiya A, Hoshi A, Hirosawa S. 1,25(OH)(2)D(3) blocks TNF-induced monocytic tissue factor expression by inhibition of transcription factors AP-1 and NF-kappaB. Lab Invest. 2007;87(6):540–547. doi:10.1038/labinvest.3700550.
- Koyama T, Shibakura M, Ohsawa M, Kamiyama R, Hirosawa S. Anticoagulant effects of 1alpha,25-dihydroxyvitamin D3 on human myelogenous leukemia cells and monocytes. Blood. 1998;92(1):160–167. doi:10.1182/blood.V92.1.160.413k16_160_167.
- Gardiner C, Ferreira YJ, Dragovic RA, Redman CW, Sargent IL. Extracellular vesicle sizing and enumeration by nanoparticle tracking analysis. J Extracell Vesicles. 2013;2(1):10. doi:10.3402/jev.v2i0.19671.
- Collier MEW, Akinmolayan A, Goodall AH. Comparison of tissue factor expression and activity in foetal and adult endothelial cells. Blood Coagul Fibrinolysis. 2017;28(6):452–459. doi:10.1097/MBC.0000000000000621.
- Conkling PR, Greenberg CS, Weinberg JB. Tumor necrosis factor induces tissue factor-like activity in human leukemia cell line U937 and peripheral blood monocytes. Blood. 1988;72(1):128–133. doi:10.1182/blood.V72.1.128.bloodjournal721128.
- Herbert JM, Savi P, Laplace MC, Lale A. IL-4 inhibits LPS-, IL-1 beta- and TNF alpha-induced expression of tissue factor in endothelial cells and monocytes. FEBS Lett. 1992;310(1):31–33. doi:10.1016/0014-5793(92)81139-D.
- Pinder PB, Hunt JA, Zacharski LR. In vitro stimulation of monocyte tissue factor activity by autologous platelets. Am J Hematol. 1985;19(4):317–325. doi:10.1002/ajh.2830190402.
- Witkowski M, Tabaraie T, Steffens D, Friebel J, Dörner A, Skurk C, Witkowski M, Stratmann B, Tschoepe D, Landmesser U, et al. MicroRNA-19a contributes to the epigenetic regulation of tissue factor in diabetes. Cardiovasc Diabetol. 2018;17(1):34. doi:10.1186/s12933-018-0678-z.
- Teruel R, Pérez-Sánchez C, Corral J, Herranz MT, Pérez-Andreu V, Saiz E, García-Barberá N, Martínez-Martínez I, Roldán V, Vicente V, et al. Identification of miRNAs as potential modulators of tissue factor expression in patients with systemic lupus erythematosus and antiphospholipid syndrome. J Thromb Haemost. 2011;9(10):1985–1992. doi:10.1111/j.1538-7836.2011.04451.x.
- Mandal SK, Pendurthi UR, Rao LV. Cellular localization and trafficking of tissue factor. Blood. 2006;107(12):4746–4753. doi:10.1182/blood-2005-11-4674.
- Mandal SK, Pendurthi UR, Rao LV. Tissue factor trafficking in fibroblasts: involvement of protease-activated receptor-mediated cell signaling. Blood. 2007;110(1):161–170. doi:10.1182/blood-2006-10-050476.
- Egorina EM, Sovershaev MA, Bjørkøy G, Gruber FX, Olsen JO, Parhami-Seren B, Mann KG, Østerud B. Intracellular and surface distribution of monocyte tissue factor: application to intersubject variability. Arterioscler Thromb Vasc Biol. 2005;25(7):1493–1498. doi:10.1161/01.ATV.0000168413.29874.d7.
- Gantier MP, McCoy CE, Rusinova I, Saulep D, Wang D, Xu D, Irving AT, Behlke MA, Hertzog PJ, Mackay F, et al. Analysis of microRNA turnover in mammalian cells following Dicer1 ablation. Nucleic Acids Res. 2011;39(13):5692–5703. doi:10.1093/nar/gkr148.
- Guo Y, Liu J, Elfenbein SJ, Ma Y, Zhong M, Qiu C, Ding Y, Lu J. Characterization of the mammalian miRNA turnover landscape. Nucleic Acids Res. 2015;43(4):2326–2341. doi:10.1093/nar/gkv057.
- Pan Y, Liang H, Liu H, Li D, Chen X, Li L, Zhang CY, Zen K. Platelet-secreted microRNA-223 promotes endothelial cell apoptosis induced by advanced glycation end products via targeting the insulin-like growth factor 1 receptor. J Immunol. 2014;192(1):437–446. doi:10.4049/jimmunol.1301790.
- Li J, Tan M, Xiang Q, Zhou Z, Yan H. Thrombin-activated platelet-derived exosomes regulate endothelial cell expression of ICAM-1 via microRNA-223 during the thrombosis-inflammation response. Thromb Res. 2017;154:96–105. doi:10.1016/j.thromres.2017.04.016.
- Zeng Z, Xia L, Fan X, Ostriker AC, Yarovinsky T, Su M, Zhang Y, Peng X, Xie Y, Pi L, et al. Platelet-derived miR-223 promotes a phenotypic switch in arterial injury repair. J Clin Invest. 2019;129(3):1372–1386. doi:10.1172/JCI124508.
- Tan M, Yan HB, Li JN, Li WK, Fu YY, Chen W, Zhou Z. Thrombin stimulated platelet-derived exosomes inhibit platelet-derived growth factor receptor-beta expression in vascular smooth muscle cells. Cell Physiol Biochem. 2016;38(6):2348–2365. doi:10.1159/000445588.
- Li S, Ren J, Xu N, Zhang J, Geng Q, Cao C, Lee C, Song J, Li J, Chen H. MicroRNA-19b functions as potential anti-thrombotic protector in patients with unstable angina by targeting tissue factor. J Mol Cell Cardiol. 2014;75:49–57. doi:10.1016/j.yjmcc.2014.06.017.
- Lu J, Clark AG. Impact of microRNA regulation on variation in human gene expression. Genome Res. 2012;22(7):1243–1254. doi:10.1101/gr.132514.111.
- Hayon Y, Dashevsky O, Shai E, Varon D, Leker RR. Platelet microparticles promote neural stem cell proliferation, survival and differentiation. J Mol Neurosci. 2012;47(3):659–665. doi:10.1007/s12031-012-9711-y.
- Kim HK, Song KS, Chung JH, Lee KR, Lee SN. Platelet microparticles induce angiogenesis in vitro. Br J Haematol. 2004;124(3):376–384. doi:10.1046/j.1365-2141.2003.04773.x.
- Risitano A, Beaulieu LM, Vitseva O, Freedman JE. Platelets and platelet-like particles mediate intercellular RNA transfer. Blood. 2012;119(26):6288–6295. doi:10.1182/blood-2011-12-396440.
- Hunter MP, Ismail N, Zhang X, Aguda BD, Lee EJ, Yu L, Xiao T, Schafer J, Lee ML, Schmittgen TD, et al. Detection of microRNA expression in human peripheral blood microvesicles. PLoS One. 2008;3(11):e3694. doi:10.1371/journal.pone.0003694.
- Allantaz F, Cheng DT, Bergauer T, Ravindran P, Rossier MF, Ebeling M, Badi L, Reis B, Bitter H, D’Asaro M, et al. Expression profiling of human immune cell subsets identifies miRNA-mRNA regulatory relationships correlated with cell type specific expression. PLoS One. 2012;7(1):e29979. doi:10.1371/journal.pone.0029979.