
Abstract
In flow cytometry, individual cells are investigated. Platelet activation is normally reported in form of percentage of platelets expressing the marker (positive platelets) and/or mean/median fluorescence intensity (MFI) for the entire analyzed population. None of these take into account the variance of the marker expression between individual platelets. This can be obtained as data on coefficient of variation (CV). This study explores if CV provides additional information regarding platelet function. Samples from platelet concentrates (PCs) prepared by apheresis- (n = 13) and interim platelet unit (IPU) technique (n = 26) and stored for 6–7 days were included and compared. Spontaneous- and agonist-induced expression of activation markers (fibrinogen binding and exposure of P-selectin, LAMP-1, and CD63) was investigated as percentage positive platelets, MFI and CV. Spontaneous expression of P-selectin as percentage positive platelets and MFI was higher for IPU PCs than apheresis PCs, which in contrast had higher agonist-induced activation. CV for spontaneous fibrinogen binding and P-selectin exposure was larger for apheresis PCs, while IPU PCs generally had larger CV for P-selectin, LAMP-1, and CD63 after agonist stimulation. Our findings show that CV adds additional information when assessing platelet activation by providing data on the variation in activation responses within the platelet population.
Introduction
Flow cytometry allows multiple factors regarding blood platelets to be tested simultaneously with high sensitivity [Citation1]. The low amount of blood needed is an advantage in pediatric patients, and the analysis of properties of single platelets enables testing of thrombocytopenic patients [Citation2]. In addition, testing can be performed in diluted whole blood [Citation3], which removes the risk of losing bigger or denser platelets during centrifugation to platelet-rich plasma [Citation4,Citation5].
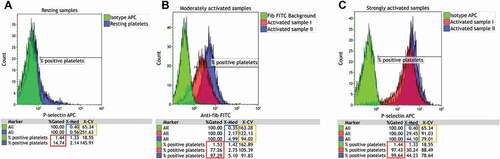
However, although flow cytometry includes analysis of fluorescence signals from individual cells, data regarding platelet activation is traditionally reported either as percentage positive platelets or as mean/median fluorescence intensity for the total platelet population (MFI) [Citation6]. A limitation with both percentage positive platelets and MFI is that they do not take into account the spread in binding of the activation marker between the individual platelets. As a possible solution, many software programs for analysis of flow cytometry data may also extract information regarding the coefficient of variation (CV) for the fluorescence signal. This information might add an additional dimension of information regarding the platelet function, which is the variation in response between the individual platelets that makes up the analyzed platelet population (see orange boxes in ).
Figure 1. The potential and limitations of the different ways to report platelet activation responses, the percentage positive platelets (“%Gated,” red boxes), median fluorescence intensity (“X-Med,” blue boxes) and variation of the fluorescence response (“X-CV,” Orange boxes), as illustrated with (A) a sample with low activation (resting platelets, P-selectin as activation marker), (B) a sample with moderately activated platelets (fibrinogen binding as activation marker) and (C) a sample with strongly activated platelets (P-selectin as activation marker). Results for “All” refers to all particles within the “All platelets” gate shown in Figure 2.
The purpose of this study was to explore if analysis of the CV would be able to add any additional information to the analysis of platelet function by flow cytometry. For this purpose, we compared samples from 6 to 7 days stored platelet concentrates (PCs) prepared by two different methods, apheresis technique (n = 13) and interim platelet unit (IPU) (n = 26) technique. We demonstrate that platelets in IPU PCs show higher pre-activation, lower responses to platelet stimulation and a larger activation response variation within the platelet population than platelets in apheresis PCs.
Methods
The study was conducted according to the guidelines of the Declaration of Helsinki and was approved by the regional ethical review board in Linköping (Dnr 2017/568-31).
Platelet concentrates
Subsamples were collected using sterile sampling bags (MacoPharma, Mouvaux, France) from PCs produced by apheresis- [Citation7] or “interim platelet unit” (IPU) [Citation8] technique after storage for 6–7 days in conjunction with transfusion. The maximum storage time in Linköping is 7 days. The samples were transferred gently from the PC to the sampling bag to limit any pre-activation of the samples and flow cytometry carried out directly. The apheresis PCs were prepared using two different machines, but with no difference in their platelet collection programs, Trima Accel® (Version 7. Terumo BCT, INC. Lakewood, CO, USA), and Spectra Optia® (Terumo BCT). The IPU PCs were manufactured by Reveos® (Terumo BCT) from whole blood donations from four to six different donors.
All PCs were prepared from the regular donor populations. All blood donors and apheresis platelet donors met standard donation criteria. This included no use of NSAID prior to donation and the apheresis donors should have a platelet count above 230 and blood group A or O. All apheresis PCs included in the study had been donated by male donors, and there was no selection based on blood group. Each donation by apheresis yielded a median of 2 PCs. The apheresis platelets were stored with 100% plasma and the IPU platelets in a combination of plasma (approximately 38% plasma) and SSP+ (MacoPharma).
The platelet concentrate subsamples were diluted 1:4 in HEPES buffer prior to flow cytometry.
Antibody staining
Antibodies used were anti-fibrinogen-FITC (Diapensia AB, Linköping, Sweden), anti-GPIb-PE (clone AN51, Dako, Glostrup, Denmark), anti-P-selectin-APC (clone AK-4), isotype IgG1κ-APC (clone MOPC-21), anti-LAMP-1-PE-Cy7 (clone H4A3), anti-CD63-PE-Cy7 (clone H5C6), and isotype IgG1κ-PE-Cy7 (clone MOPC-21), all from BD, Franklin Lakes, NJ, USA. Platelet agonists used were PAR1-activating peptide (PAR1-AP, sequence SFLLRN, JPT Peptide Technologies, Berlin, Germany), PAR4-activating peptide (PAR4-AP, sequence AYPGKF, JPT Peptide Technologies) and cross-linked collagen-related peptide (CRP-XL, University of Cambridge, Cambridge, UK). The HEPES buffer (137 mM NaCl, 2.7 mM KCl, 1 mM MgCl2, 20 mM HEPES, 1 g/L bovine serum albumin and 5.6 mM glucose, pH 7.4) was used as is, or with added CaCl2 (2.5 mM) or EDTA (10 mM).
Master mixes containing antibodies, platelet agonists, and dilution buffer were prepared beforehand and kept at −80°C. Final concentrations (during platelet activation) were the following: anti-fibrinogen-FITC (2.5 µg/mL), anti-GPIb-PE (2.5 µg/mL), anti-P-selectin-APC (0.17 µg/mL), anti-CD63-PE-Cy7 or anti-LAMP-1-PE-Cy7 (0.5 µg/mL), PAR1-AP (10 µM), PAR4-AP (100 µM), and CRP-XL (0.15 µg/mL). For setting of the positivity gates, two negative control samples were used. These contained anti-fibrinogen-FITC and anti-GPIb-PE in the same concentrations as stated above, but isotype IgG1κ-APC (0.17 µg/mL) and isotype IgG1κ-PE-Cy7 (0.5 µg/mL) instead of the APC- and PE-Cy7-labeled antibodies mentioned above. One of these samples contained HEPES with EDTA (10 mM), and served as the negative control for anti-fibrinogen-FITC, as previously described [Citation9], while the other contained ordinary HEPES buffer and served as negative control for the APC- and PE-Cy7-labeled antibodies. In all other samples, the dilution buffer was HEPES with CaCl2 (2.5 mM). The approach to report the percentage of positive platelets requires a careful selection and titration of the negative (background fluorescence) control used for gating. Both antibody subclass, concentration and fluorescence per protein (F/P) ratio were therefore thoroughly matched to ensure that the peaks of the negative control and main population of resting platelets show a good overlay [Citation10] (see example in ).
On the day of sample analysis, the master mixes were thawed at 37°C in a water bath for 3 min, and 33 µL master mix was added to flow cytometry tubes. After this, 3 µL thoroughly mixed, diluted PC was added to all tubes with 15 seconds intervals. After exactly 10 min, the platelet activation was stopped by addition of 2 mL HEPES buffer to tube 1–2 and HEPES buffer with 2.5 mM CaCl2 to the other tubes. After every addition of PC or buffer, the tubes were gently mixed with a vortex-mixer at low speed.
Analysis with flow cytometry
Samples were analyzed on a Gallios® flow cytometer (Beckman Coulter, Brea, CA, USA) equipped with three lasers and a 10 color configuration. The ultra-wide angle of detection (submicron particle setting) was used for forward scatter (FSC) and a fluorescence threshold was applied (here on FL2 (GPIb-PE)) to allow reliable detection of all platelet-derived particles (as previously reported in [Citation11]). Data from 5000 platelet-sized, GPIb-positive events were collected using a temporary platelet gate in the acquisition protocol.
The data analysis was performed using the software Kaluza (Version 2.1, Beckman Coulter Life Sciences, Indianapolis USA). The manual for Kaluza, including all data on formulas used for calculation of the different variables, is available at the Beckman Coulter web page [Citation12]. The reporting of percentage positive platelets is a good alternative in cases with moderate platelet activation [Citation6] (see red box in ), and in situations where only a subpopulation of platelets become positive, which is the case for markers such as annexin V detecting phosphatidylserine exposure [Citation13,Citation14]. However, a drawback with the percentage positive platelets is that it loses sensitivity when the majority of platelets become activated, as in . In these cases, the average fluorescence for the total platelet population (MFI) is a better representative of the true difference between the analyzed samples (see blue boxes in ). The use of median is recommended over mean, as fluorescence intensity increases logarithmically [Citation15].
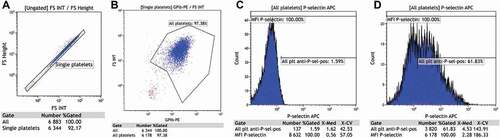
In Kaluza, the single platelets were identified according to the relation between forward scatter height and area, as illustrated in . Platelets were distinguished from platelet fragments based on size (forward scatter) and PE fluorescence, as illustrated in . This gate included in median 98% GPIb positive platelets for the apheresis PCs and 97% for the IPU PCs. shows how the negative control sample was used to determine the gate for P-selectin positive platelets, being placed as close to 1.5% as possible, as the recommendation is to place it between 1 and 2% [Citation16], while shows the same blood sample in the presence of the P-selectin antibody, and demonstrates the data extracted and analyzed, namely the percentage positive platelets (%Gated in “All plt anti-P-sel pos”), as well as the median fluorescence (X-Med), and the coefficient of variation for the fluorescence (X-CV) for the total platelet population (Gate “MFI P-selectin”).
Figure 2. The gating strategy used for analysis of the PCs in this study. PE-positive particles were collected using a threshold on FL2 at acquisition. The single platelets were identified based on FS height and area (A) and then distinguished from platelet fragments through PE fluorescence (B) with a platelet gate big enough to include also platelets with a change in forward scatter due to activation and procoagulant transformation. The setting of the gate for P-selectin positive platelets as close as possible to 1.5% with the use of the negative (isotype antibody) control sample (C). Data obtained from an activated sample containing P-selectin antibody when the above presented gating strategy was used (D).
Effect of platelet events on X-CV
A separate flow cytometry test was performed when 5000, 10 000, 20 000, and 50 000 platelet events were collected in order to assess if X-CV changed with increasing platelet counts. For this experiment, platelets from four PCs were assessed and fibrinogen binding, P-selectin exposure and LAMP-1 exposure determined to illustrate the impact of varying the platelet events collected.
Statistical analysis
Statistical analysis was performed using GraphPad (Prism 8.4.2, GraphPad Software, San Diego, CA, USA). As not all data were normally distributed, the Mann-Whitney test was used to compare the data for apheresis and IPU units for the same platelet activation readout. A P-value of <0.05 was considered statistically significant.
Results
Platelet activation is measured as the amount of certain markers on the surface, indicating activation of e.g. the fibrinogen receptor or exocytosis of granules and lysosomes. Platelets from PCs prepared by IPU- and apheresis technique were incubated with antibodies detecting fibrinogen binding (indicating activation of the fibrinogen receptor GPIIb/IIIa [Citation9]), and markers indicating degranulation of platelet granules (P-selectin from alpha and dense granules, lysosomal associated membrane protein 1 (LAMP-1) from lysosomes and CD63 from dense granules and lysosomes [Citation16]). For platelet activation, we used peptides as specific agonists to induce activation via three different pathways, through the thrombin receptors PAR1 [Citation17] and PAR4 [Citation18] and through the collagen receptor GPVI [Citation19]. These three pathways also include secondary feedback activation through release of endogenous ADP by activated platelets [Citation1]. Samples without platelet agonist were also analyzed to determine the level of spontaneous platelet activation induced by the preparation and storage of the PCs and expression of the constitutively expressed GPIb receptor. Data for percentage positive platelets, median fluorescence intensity (MFI) and variation in fluorescence signal (CV) for the different platelet markers are shown in .
Table 1. Median, confidence interval (CI) and p-value for apheresis and IPU with all tested agonists and markers. Significant results are marked in bold.
Without any added platelet agonist, the platelets showed a relatively low binding of fibrinogen as well as low exposure of LAMP-1, which indicates a low degree of spontaneous activation of the fibrinogen receptor and lysosomal exocytosis. Using our standardized gating strategy with 1.5% positive in the isotype sample, the exposure of P-selectin was relatively high, and IPU PCs showed significantly higher exposure, both for percentage positive platelets and MFI, indicating that spontaneous alpha granule exocytosis has occurred in the PCs. As a reference, we assessed the basal expression in PCs stored for 2 days for comparison. It was shown to be 44% for IPU PCs (n = 2) and 22% for apheresis PCs (n = 3).
The CV revealed a wider distribution of GPIb in IPU concentrates, while the distributions for fibrinogen binding and P-selectin exposure were wider in apheresis PCs.
For all samples stimulated with platelet agonists, the fibrinogen binding was significantly higher on platelets produced by apheresis technique than IPU technique when expressed as percentage positive platelets and MFI, whereas CV was similar. In contrast, both PAR receptor activating peptides induced significantly higher P-selectin exposure (both percentage positive platelets and MFI) in apheresis PCs, but showed a higher CV in IPU PCs. A similar pattern with higher degree of activation in apheresis PCs but higher CV in IPU PCs was seen for the other markers of degranulation, LAMP-1 and CD63 upon stimulation with platelet agonists (as they were labeled with the same fluorophore, they could not be investigated in the same samples). There was no difference in the results for Trima Accel® and Spectra Optia® (data not shown). None of the PCs had any visible aggregates and all exhibited well-maintained swirling capacity.
Our data also show that X-CV was not systematically altered by increasing the number of platelet events in the assay above 5000 (). Hence, 5000 platelets should be enough to ensure stable X-CV data. It is anyway advisable to collect the same number of events in all samples to be compared. However, as could be seen for LAMP-1, very low MFI could cause a larger discrepancy in X-CV (see PC A in ).
Table 2. Impact of the number of platelet events investigated on the flow cytometry variables.
Discussion
One often stated advantage with flow cytometry is that it is able to analyze the fluorescence of each individual cell separately instead of giving a bulk average value for all cells in the sample, as is the case for many other platelet activation analysis methods such as aggregometry and western blotting. Considering that, it is surprising that most studies using flow cytometry for platelet activation analysis only reports one single value for the total platelet population, either the percentage positive platelets or the average fluorescence for the total platelet population, such as median fluorescence intensity (MFI). The consensus protocol published in 1998 states that the percentage positive platelets will be the most sensitive readout in situations with low platelet activation, but that the average fluorescence intensity (or a calibrated equivalent) should be used in situations where the majority of platelets express the antigen [Citation16]. However, in this study, we have reported both percentage positive platelets and MFI for the activation-induced markers, as it allows us to illustrate and discuss the differences and limitations of these two approaches.
As mentioned above and illustrated in , the data show that although the percentage positive platelets and the MFI generally follows the same pattern, the percentage loses sensitivity in samples with high activation, and although significant differences are present, these are probably too small to be safely interpreted as relevant. A similar situation occur in samples with very low platelet activation, where it is common to find studies reporting on significant differences in marker expression, but where the absolute difference is only a few percent. It is important to remember that even though these differences might be statistically significant, the clinical relevance of differences of such a minute magnitude needs to be critically reviewed, also taking into account the sampling uncertainty and the imprecision of the specific analysis protocol at the relevant range of activation [Citation20,Citation21]. In addition, the placement of the positivity gate may have a large impact on the results, as has been illustrated in a systematic study for P-selectin [Citation22].
Our aim with this study was to explore another parameter available from most flow cytometry analysis software, the coefficient of variation (CV) of the fluorescence signal for a specific marker. In comparison with percentage positive platelets or MFI, the CV adds another dimension as it reports on the variation in fluorescence in the platelet population and can be obtained in standard flow cytometry programs as a supplement to percentage positive platelets and MFI. It provides an objective measure on variation in responses in a population, in contrast to manual categorization of events into groups. This allows the capture of at least some of the potential of the flow cytometer to evaluate individual platelets. To the best of our knowledge, the CV has not been reported before in studies of platelet function by flow cytometry.
To evaluate the usefulness of CV, we choose single donor PCs and PCs with platelets from multiple donors that were close to expiry date (stored for 6–7 days) and therefore most likely would show variable activation response caused by varying degree of platelet storage lesions.
Here, we show that CV detects differences between apheresis and IPU PCs that are not just mirroring the differences in MFI or percentage positive platelets. On the contrary, the CV shows the opposite pattern with larger variation in spontaneous expression of activation markers for platelets from apheresis PCs, but larger variation for platelets from IPU PCs after agonist stimulation for most activation markers and activation pathways tested. The large variation within the IPU PCs indicate that the activation potential of the platelets is very different within one PC. This could possibly be a consequence of the method for preparation (such as centrifugation speed) or storage conditions (including a difference in storage medium), or by the fact that these PCs are composed of platelets from several different donors, or a combination of these. If and how this affects the platelet’s ability to circulate and activate after donation to the recipient is yet unknown. The apheresis PCs had been prepared by two different machines, but both machines have similar collection principle for platelets, and the results did not differ between these.
One limitation of CV is in situations with a mean close to zero which could result in a highly variable CV. This could occur for platelets with a low expression of the markers of interest (exemplified with LAMP-1 in ). In such situations, the percentage positive platelets is a more appropriate variable. CV is thus most suitable in the setting of medium-to-high expression of a marker. It could be of interest in situations where one is interested in knowing how homogenous a population of platelets is in its responsiveness to activation or in variation in expression of surface receptors with potential shedding or internalization, such as GPIb. In the future, it could be a useful variable if one is interested in tailoring platelet transfusions using platelets with specific characteristics, such as situations with acute bleeding or in prophylactic transfusions. In some situations, a homogenous population might be preferable whereas in others a heterogenic might give a better outcome.
Further studies including the CV as parameter will give platelet researchers a tool to investigate these and many other questions regarding platelet activation responses in the future. This is definitely not limited to the field of transfusion medicine, but is likely as interesting to explore in other areas of clinical and experimental platelet research.
Conclusions
We conclude that the inclusion of CV as a parameter for analysis of platelet flow cytometry data is a way to capture some of the technique’s potential to investigate individual platelet responses. We suggest that the CV, together with either the percentage positive platelets (in cases with medium platelet activation) or MFI (in cases with high platelet activation), could be a valuable tool for platelet research in both clinical and experimental laboratories in the future.
Author contributions
SR and NT designed and supervised the study. FM analyzed the data and wrote the initial draft of the manuscript and AA re-worked it for submission with a new focus. All authors took part in the revision and editing of the final version of the manuscript, and have read and agreed to the final version.
Acknowledgements
The authors wish to thank Maria Wallstedt and Anna Södergren for their contributions in the setup of the study and practical analysis of the samples and Helena Lindblom and Ana Maria Vasilache for arrangements surrounding sample collection.
Data availability statement
The raw data used for this publication can be provided by the authors upon reasonable request.
Disclosure statement
No potential conflict of interest was reported by the author(s).
Additional information
Funding
References
- Ramstrom S, Sodergren AL, Tynngard N, Lindahl TL. Platelet function determined by flow cytometry: new perspectives? Semin Thromb Hemost 2016;42(3):268–281. Epub 2016/02/18. doi:10.1055/s-0035-1570082.
- Boknas N, Macwan AS, Sodergren AL, Ramstrom S. Platelet function testing at low platelet counts: when can you trust your analysis? Res Pract Thromb Haemost 2019;3(2):285–290. Epub 2019/04/24. doi:10.1002/rth2.12193.
- Shattil SJ, Cunningham M, Hoxie JA. Detection of activated platelets in whole blood using activation-dependent monoclonal antibodies and flow cytometry. Blood 1987;70(1):307–315. Epub 1987/07/01. doi:10.1182/blood.V70.1.307.307.
- Soderstrom AC, Nybo M, Nielsen C, Vinholt PJ. The effect of centrifugation speed and time on pre-analytical platelet activation. Clin Chem Lab Med 2016;54(12):1913–1920. Epub 2016/11/02. doi:10.1515/cclm-2016-0079.
- Merolla M, Nardi MA, Berger JS. Centrifugation speed affects light transmission aggregometry. Int J Lab Hematol 2012;34(1):81–85. Epub 2011/07/29. doi:10.1111/j.1751-553X.2011.01360.x.
- Michelson AD. Flow cytometry: a clinical test of platelet function. Blood 1996;87(12):4925–4936. doi:10.1182/blood.V87.12.4925.bloodjournal87124925.
- Burgstaler EA. Blood component collection by apheresis. J Clin Apher 2006;21(2):142–151. Epub 2005/05/10. doi:10.1002/jca.20043.
- Lagerberg JW, Salado-Jimena JA, Lof H, Bontekoe IJ, Nielsen C, Verheggen C, van Waeg G, van der Meer PF, de Korte D, Hansen MB, et al. Evaluation of the quality of blood components obtained after automated separation of whole blood by a new multiunit processor. Transfusion 2013;53(8):1798–1807. Epub 2012/12/12. doi:10.1111/trf.12010.
- Lindahl TL, Festin R, Larsson A. Studies of fibrinogen binding to platelets by flow cytometry: an improved method for studies of platelet activation. Thromb Haemost 1992;68(2):221–225. doi:10.1055/s-0038-1656352.
- Hulspas R, O’Gorman MR, Wood BL, Gratama JW, Sutherland DR. Considerations for the control of background fluorescence in clinical flow cytometry. Cytometry B Clin Cytom 2009;76(6):355–364. Epub 2009/07/04. doi:10.1002/cyto.b.20485.
- Sodergren AL, Ramstrom S. Platelet subpopulations remain despite strong dual agonist stimulation and can be characterised using a novel six-colour flow cytometry protocol. Sci Rep 2018;8(1):1441. Epub 2018/01/25. doi:10.1038/s41598-017-19126-8.
- Beckman coulter technical documents: kaluza analysis software instructions for use. [Accessed 2021-07-27]. Available from https://www.beckman.com/search#q=kaluza&t=coveo-tab-techdocs
- Ramstrom S, O’Neill S, Dunne E, Kenny D. Annexin V binding to platelets is agonist, time and temperature dependent. Platelets 2010;21(4):289–296. Epub 2010/03/17. doi:10.3109/09537101003660564.
- Dachary-Prigent J, Freyssinet JM, Pasquet JM, Carron JC, Nurden AT. Annexin V as a probe of aminophospholipid exposure and platelet membrane vesiculation: a flow cytometry study showing a role for free sulfhydryl groups. Blood 1993;81(10):2554–2565. doi:10.1182/blood.V81.10.2554.2554.
- International clinical cytometry society: what is MFI and how is it calculated?. [Accessed 2021-07-27]. Available from https://www.cytometry.org/web/q_view.php?id=152&filter=Analysis%20Techniques
- Schmitz G, Rothe G, Ruf A, Barlage S, Tschope D, Clemetson KJ, Goodall AH, Michelson AD, Nurden AT, Shankey TV. European working group on clinical cell analysis: consensus protocol for the flow cytometric characterisation of platelet function. Thromb Haemost 1998;79(5):885–896. Epub 1998/06/03. doi:10.1055/s-0037-1615088.
- Hui KY, Jakubowski JA, Wyss VL, Angleton EL. Minimal sequence requirement of thrombin receptor agonist peptide. Biochem Biophys Res Commun 1992;184(2):790–796. doi:10.1016/0006-291X(92)90659-9.
- Hollenberg MD, Saifeddine M, Sandhu S, Houle S, Vergnolle N. Proteinase-activated receptor-4: evaluation of tethered ligand-derived peptides as probes for receptor function and as inflammatory agonists in vivo. Br J Pharmacol 2004;143(4):443–454. doi:10.1038/sj.bjp.0705946.
- Morton LF, Hargreaves PG, Farndale RW, Young RD, Barnes MJ. Integrin alpha 2 beta 1-independent activation of platelets by simple collagen-like peptides: collagen tertiary (triple-helical) and quaternary (polymeric) structures are sufficient alone for alpha 2 beta 1-independent platelet reactivity. Biochem J 1995;306:337–344. doi:10.1042/bj3060337.
- Ranganathan P, Pramesh CS, Buyse M. Common pitfalls in statistical analysis: clinical versus statistical significance. Perspect Clin Res 2015;6(3):169–170. Epub 2015/08/01. doi:10.4103/2229-3485.159943.
- Anderson AA. Assessing statistical results: magnitude, precision, and model uncertainty. Am Stat 2019;73(sup1):118–121. doi:10.1080/00031305.2018.1537889.
- Levin E, Serrano K, Devine DV. Biomedical excellence for safer transfusion C. Standardization of CD62P measurement: results of an international comparative study. Vox Sang 2013;105(1):38–46. Epub 2013/02/07. doi:10.1111/vox.12023.