
 ?Mathematical formulae have been encoded as MathML and are displayed in this HTML version using MathJax in order to improve their display. Uncheck the box to turn MathJax off. This feature requires Javascript. Click on a formula to zoom.
Abstract
Megakaryocytes (MKs), the largest and rarest cells of the hematopoietic system, differentiate by increasing their size, DNA and cytoplasmic contents during maturation in order to release high numbers of blood platelets into the circulation. The gold-standard to study these complex cells is the isolation of primary MKs from the native bone marrow (BM). This is typically achieved by using fluorescence- or magnetic-activated cell sorting. However, both methods are time-consuming and require a trained experimenter who is able to operate highly priced special equipment. Here, we demonstrate a simple and rapid alternative method to enrich mature MKs (≥16 N) from murine adult BM by size exclusion. The purity of the MK fraction reached 70–80% after isolation (100- to 250-fold enrichment). Reanalysis of isolated MKs by confocal microscopy revealed the expected expression of lineage-defining MK- and platelet-specific surface receptors, including CD42a/b/d and CD41/CD61. In addition, we detected a clear enrichment of MK-specific proteins/transcripts like 1-tubulin,
3-integrin, GPVI and GPIb
, whereas the neutrophil marker Ly6G was only detectable in the BM sample. Taken together, we demonstrate that the protocol proposed in this Technical Report is a compatible addition to established isolation methods.
Introduction
Megakaryocytes (MKs) are the largest cells in the bone marrow (BM) and rare with an abundancy of around 0.05–0.1% [Citation1,Citation2]. MKs differentiate from hematopoietic stem cells (HSCs) and mature by increasing their DNA and cytoplasmic contents through endomitosis [Citation3,Citation4]. Concomitantly, MK progenitors form an inner demarcation membrane system (DMS), a hallmark of mature MKs that serves as a membrane reservoir for platelet production [Citation5]. To overcome their paucity for research studies, MKs differentiated from HSCs which originate from murine adult BM, spleen or murine fetal liver are commonly used [Citation6]. Other sources for MK progenitors and HSCs especially for studies with human MKs include CD34+ hematopoietic stem cells and human inducible pluripotent stem cells (hiPSCs) [Citation7,Citation8]. Independent of the source, megakaryocytic progenitors are cultured in medium supplemented with cytokine cocktails that typically expands MK progenitors in a first step before it induces MK differentiation and maturation. However, classical 2D liquid culture systems cannot mimic the complex 3D MK BM microenvironment in vivo, which consists of niche factor-producing stromal cells, different extracellular matrix proteins and a sophisticated topological distribution of blood-derived molecules, such as oxygen or thrombopoietin (TPO) [Citation9,Citation10]. Consequently, in vitro-differentiated MKs lack the influence of these niche factors and therefore differ from BM MKs in terms of size, morphology, DMS maturation, ploidy and proplatelet formation (PPF) [Citation11]. Recent advances in single-cell transcriptomics have provided new insights into MK biology, such as the discovery of MK subpopulations in the BM [Citation12]. These studies aim to decipher complex in vivo conditions; therefore, MKs have to be isolated from the native BM. A simple MK enrichment procedure is the usage of a density gradient, such as a one-step BSA gradient [Citation13]. This method readily separates most non-MK cells from MKs, however neutrophils tend to contaminate the lower (MK) fraction. Therefore, direct isolation of primary mature MKs from the adult BM remains the standard procedure for the analysis of in vivo-differentiated MKs. This is typically achieved by using fluorescence- or magnetic-activated cell sorting (FACS and MACS), both of which are labor-intensive and costly, and require special equipment and a trained operator [Citation14,Citation15].
Here, we demonstrate a simple and rapid method to enrich mature MKs from murine adult BM by size exclusion with cell strainers of different mesh sizes. A similar approach was proposed by Braylan and colleagues on human bone marrow aspirates in patients with myeloproliferative disorders at the ASH conference in 2013 [Citation16]. In our protocol, the purity of the MK fraction reached 70–80% after isolation, which reflects a 100- to 250-fold enrichment of these rare cells. Reanalysis of these isolated primary MKs revealed the expected expression of the lineage-defining MK- and platelet-specific surface receptors, including CD42a/b/d, CD41/CD61, GPVI and CLEC-2. Purified MKs displayed a well-developed and elaborated DMS and an F-actin rich peripheral zone, in contrast to cultured, in vitro-differentiated MKs. With our new isolation approach, it is possible to enrich an MK population with ploidy levels ≥16N resembling mature MKs in the BM. Interestingly, most of the enriched MKs displayed a “ghostly” appearance (adapted from so-called erythrocyte ghosts) [Citation17], with visible nuclei and textured cytoplasm in bright field images [Citation18] combined with a positive DNA staining using SYTOX blue. We have analyzed protein lysates of whole BM, the flow through (FT) and the MK fraction by immunoblotting and detected a clear enrichment of MK-specific proteins like 1-tubulin,
3-integrin, GPVI and GPIb
in the MK fraction, whereas the neutrophil marker Ly6G was only detectable in the BM and FT sample. We confirmed these findings by qPCR analysis of the BM and MK fraction. Taken together, we demonstrate that the protocol introduced here is a compatible addition to established isolation methods, such as FACS and MACS, and suggest using our filter isolation approach, e.g., for omics studies.
Methods
Enrichment of mature primary MKs from murine BM
Materials
Isoflurane
Isoflurane anesthesia system
(Sterile) reaction tubes 1.5 mL
(Sterile) reaction tubes 0.5 mL
Sterile 50 mL conical tubes
0.45 µm PVDF syringe filter
20 mL Luer slip-tip syringe
Operating table for organ removal
Forceps (Student Dumont #7 standard Inox; ref: 91197-00 fine science tools, USA)
Scissors (Lexer-Baby scissors straight 10 cm; ref: 14078-10 fine science tools, USA)
20 G or 18 G needles
70 µm filter PET-mesh, sterile (SKU 43-50 070-51, pluriselect, Germany)
20 µm filter, sterile (SKU 43-50 020-03, pluriselect, Germany)
15 µm filter, sterile (SKU 43-50 015-03, pluriselect, Germany)
Red blood cell (RBC) lysis buffer 10× (1.5 M NH4Cl, 1 mM EDTA, 0.14 M NaHCO3); adjust pH to 7.3 with NaOH and HCl; use 0.45 µm PVDF syringe filter for sterile filtration
CATCH buffer [25 mM HEPES, 3 mM EDTA, add fresh 3.5% (w/v) BSA (fatty acid free, low endotoxin), fill up with 1× PBS]
1× PBS+5% (v/v) FCS
Complete CATCH buffer [mix CATCH buffer + BSA and PBS+5% (v/v) FCS in a 1:1 ratio; final concentration 12.5 mM HEPES, 1.5 mM EDTA, 1.75% (w/v) BSA, 2.5% (v/v) FCS in PBS]
Centrifuges for reaction tubes 1.5 mL (Eppendorf centrifuge 5424 or similar)
Swing-bucket centrifuge for 50 mL conical tubes (VWR MEGA STAR 1.6 R with Thermo Scientific swing out rotor 75003181 max. 4149 g or similar)
Cell culture S1 biological safety cabinet (NuAire, UK)
Experimental procedure
Anesthetize mice with isoflurane
Sacrifice the mice by cervical dislocation and isolate both femora and tibiae
Cut one end of femora and tibiae (Note 1) and place them (open end down) in a 0.5 mL reaction tube with a punched hole in the bottom (Note 2)
Place the 0.5 mL reaction tube in a 1.5 mL reaction tube
Add 100 µL of complete CATCH buffer (Note 3) to the bones and close the 0.5 mL reaction tube
Centrifuge the reaction tubes with bones for 1 min at 2600 g and room temperature (RT) to spin out the bone marrow [Citation19]
BM should now be at the bottom of the 1.5 mL reaction tube
From now on work under a biological safety cabinet (Note 4)
Remove the supernatant and resuspend the bone marrow cells in 1 mL of 1× RBC lysis buffer (Note 5)
Incubate the suspension for 10 min at RT
Centrifuge the suspension for 5 min at 300 g and remove the supernatant (a white cell pellet with a red cell layer on top should be visible)
Place a 70 µm cell strainer on a 50 mL conical tube and resuspend the cell pellet in 1 mL complete CATCH buffer with BSA and FCS
Pipette the BM cell suspension on the 70 µm cell strainer und collect the flow through (MKs containing fraction), wash the 70 µm cell strainer 3× with 1 mL complete CATCH buffer with BSA and FCS and collect a sample (BM sample, approximately 100 µL approx. 1/40 of initial volume) for microscopic quality control
Discard the 70 µm cell strainer
Place a 20 µm cell strainer on a new 50 mL conical tube
Pipette or pour the BM cell suspension onto the 20 µm cell strainer (Note 6)
Let the suspension run through the filter by gravity for several minutes
Use 10–15 mL complete CATCH buffer with BSA and FCS to wash the filter (in 1 mL steps), collect the flow through (fraction FT I) (Note 7)
When the washing step (18) is completed, turn the filter and place it on a new 50 mL conical tube
Remove the MKs in the filter by pipetting 6 mL complete CATCH buffer with BSA and FCS on the filter (now from the other side; 1 mL steps), (fraction MK I)
Use fraction FT I and repeat the filter process (steps 15–20) with a new 20 µm filter and collect the MKs (MK II) in fraction MK I resulting in the fraction MK I + II in one conical tube and FT II in a new conical tube; collection of a sample (FT sample, approximately 100 µL approx. 1/240–1/340 of FTII volume) for microscopic quality control
Filter fraction MK I + II with a 15 µm filter as described (steps 15–20) to obtain fraction FT III, collect MK III in a new conical tube (Note 8)
When the flow rate is low, you can resuspend the suspension in the filter (pipette carefully up and down)
Centrifuge the fraction MK III for 10 min at 300 g
Discard the supernatant (leave approximately 1 mL in the conical tube) and resuspend the MKs in a smaller volume (one-sixth of buffer volume); collection of a sample (MK sample, approximately 10 µL approx. 1/100 of initial volume) for microscopic quality control
Transfer the MK fraction to a smaller reaction tube (1.5 mL reaction tube) and centrifuge the cells 5 min at 300 g
Discard the supernatant and proceed depending on the experiment
For details, see the experimental workflow in .
Figure 1. Schematic of experimental setup and workflow. Femora and tibiae were prepared from mice and cells harvested by spinning out the BM [Citation19]. An RBC lysis is an optional step to remove undesired cells (steps 1–11). The BM single-cell suspension is filtered through a 70 µm cell strainer to remove leftover hair and bone (steps 12–14) after RBC lysis. The BM fraction is filtered through a 20 µm cell strainer and the flow through is collected (FT I). FT I is additionally filtered through a 20 µm filter. MK I and II flow through fractions are combined (steps 15–22) and filtered through a 15 µm cell strainer to obtain FT III and MK III. Next, MK III is transferred into a new conical tube, which reflects the final MK fraction (steps 23–28). The bright field images are representative from at least five independent experiments. Scale bar represents 60 µm.
![Figure 1. Schematic of experimental setup and workflow. Femora and tibiae were prepared from mice and cells harvested by spinning out the BM [Citation19]. An RBC lysis is an optional step to remove undesired cells (steps 1–11). The BM single-cell suspension is filtered through a 70 µm cell strainer to remove leftover hair and bone (steps 12–14) after RBC lysis. The BM fraction is filtered through a 20 µm cell strainer and the flow through is collected (FT I). FT I is additionally filtered through a 20 µm filter. MK I and II flow through fractions are combined (steps 15–22) and filtered through a 15 µm cell strainer to obtain FT III and MK III. Next, MK III is transferred into a new conical tube, which reflects the final MK fraction (steps 23–28). The bright field images are representative from at least five independent experiments. Scale bar represents 60 µm.](/cms/asset/485a509c-ae2e-4774-9177-b87abb14fb66/iplt_a_2192289_f0001_oc.jpg)
Notes
General note: Cell pellets of MKs are very loose. Approximately 150 µL buffer should be left in the reaction tube when changing the buffer, otherwise there is a risk of lower MK yield. Formation of air bubbles has to be avoided when using the filter, as this could result in a reduced MK yield.
Cut the end of femur and tibiae (proximal/distal epiphyses).
Use a 20 G or 18 G needle to prepare the hole in the 0.5 mL reaction tube in advance; the four bones (2 femora and 2 tibiae) from one mouse fit in one 0.5 mL reaction tube.
CATCH buffer can be replaced with ACD-A buffer (75 mM sodium citrate dehydrate, 38 mM citric acid, 123 mM dextrose) with 0.5% (v/v) FCS as an alternative isolation buffer. In every step, replace CATCH buffer with ACD-A buffer. The yield of enriched MKs with the ACD-A buffer is higher, but the purity typically does not exceed 60% (data not shown).
This step is optional and depends on the experiment which is planned for the isolated MKs afterward.
Use a 1 mL pipette and gently pipette up and down around 15–20 times to obtain a single-cell suspension. The RBC lysis is optional and helps to reduce the cellularity of undesired cells in your preparation.
BM cells of up to 3 mice can be pooled, otherwise the cell strainer gets blocked and the purity of the MK fraction deteriorates.
For all washing steps: Always wash the inner walls of the filter by pipetting complete CATCH buffer in 1 mL steps to the top of the inner filter wall. Make sure every part of the inner wall is rinsed. Do not let the filter run dry.
Make sure to equilibrate the 15 µm filter, otherwise the liquid does not easily pass through the filter. Pipette 1 mL of complete CATCH buffer on top of the filter and pipette up and down, until liquid passes through the filter. Avoid at any costs the formation of air bubbles. Optionally, you can apply vacuum in the conical tube to suck the liquid through the filter.
Enrichment of MKs via BSA gradient
The enrichment of MKs via BSA gradient was performed according to Nakeff and Floeh [Citation20]. In brief, BM was harvested via centrifugation [Citation19] and a sample of the cell suspension was prepared for flow cytometric analysis. The remaining cell suspension was layered carefully on a previously formed BSA-gradient (16% (w/v) to 38% (w/v), in 2% steps) and centrifuged at 1000 g for 30 min at 4°C. The upper fractions (16% to 36% BSA) were combined (non-MK fraction) and analyzed separately from the last fraction (38% (w/v) BSA; MK fraction) via flow cytometry. Fcγ receptors were blocked with anti-CD16/CD32 (2.4G2, Cell Signaling) for 15 min at RT and MKs were stained with anti-CD42a (Xia.B4-Alexa405, Emfret) and anti-CD41/CD61 (Leo.H4-Alexa647, Emfret) antibodies. After centrifugation at 300 g for 5 min cells were resuspended in 500 µL CATCH buffer without BSA and analyzed in a FACS Celesta flow cytometer (BD Biosciences).
Purity and ploidy analysis of enriched MKs
The enrichment of MKs (purity) as well as MK ploidy after filtration was assessed by flow cytometry: the cell pellet from step 27 in paragraph 1.2 was resuspended in complete CATCH buffer. Fcγ receptors were blocked with anti-CD16/C32 (2.4G2, Cell Signaling) for 15 min at RT and MKs stained with anti-CD42a (Xia.B4-Alexa405, Emfret) and anti-CD41/CD61 (Leo.H4-Alexa647, Emfret) antibodies. After centrifugation at 300 g for 5 min cells were resuspended in 500 µL CATCH buffer without BSA and analyzed in a FACS Celesta flow cytometer (BD Biosciences).
For the measurement of MK ploidy, Fcγ receptors were blocked as described above. Samples were centrifuged at 300 g for 5 min, and the pellet was resuspended in PBS with 0.1% EDTA. Cells were fixed and permeabilized with 2% paraformaldehyde (PFA) and 0.1% Triton X-100 in PBS for 15 min each at RT. After centrifugation cells were resuspended in 0.1% EDTA in PBS and stained with an anti-CD41/61-Alexa647-conjugated (Leo.H4-Alexa647, Emfret) antibody. Cells were then washed with PBS and centrifuged at 300 g for 5 min at RT. In order to avoid contamination with RNA, 100 µg/mL RNAse A was added to the samples. DNA was stained with SYTOXTM blue Dead Cell Stain, and the DNA content was measured by flow cytometry. Data was acquired using Diva software (BD Biosciences) and analyzed with FlowJo (BD Biosciences).
Analysis of surface receptor expression by confocal laser scanning microscopy (CLSM)
MK glycoprotein (CD42b/CD42d/CD42a), integrin (CD41/61) and (hem)-ITAM receptor (CLEC-2, GPVI) expression was assessed by CLSM. Cells from step 27 in paragraph 1.2 were fixed and permeabilized with 2% PFA in PHEM buffer (60 mM PIPES, 25 mM HEPES, 10 mM EGTA, 2 mM MgSO4) with 0.1% Triton X-100 for 20 min at RT. Cells were then washed and stained for 1 h at RT in the dark with fluorophore-conjugated antibodies raised against the surface receptors listed above: anti-CLEC-2 antibodies (Inu1 [Citation21]) conjugated to Alexa488; anti-GPVI antibodies (JAQ1, Emfret) conjugated to Alexa647; anti-CD41/CD61 antibodies (Leo.H4, Emfret) conjugated to Alexa546; anti-CD42b antibodies (Xia.G7, Emfret) conjugated to Alexa488; anti-CD42d antibodies (Gon.C2, Emfret) conjugated to Alexa546; anti-CD42a antibodies (Xia.B4, Emfret) conjugated to Alexa647. Nuclei were counterstained with DAPI-containing fluoroshield. Image acquisition was performed using a confocal laser scanning microscope (TCS SP8, Leica Microsystems CMS) with a 63×/NA 1.4 oil objective. For image documentation LAS X software was used, and image processing was performed with ImageJ (Version 2.0.0-rc-43/1.51 g, NIH, MD, USA) software. Brightness and contrast adjustments were applied in linear settings to the whole image.
Live cell staining and imaging
In order to live-image isolated MKs, cells from step 27 in paragraph 1.2 were resuspended in CATCH buffer without BSA and FCS. SYTOX™ Blue Dead Cell Stain and Calcein Green AM were added (final concentration 1 µM SYTOX™ Blue Dead Cell Stain and 4 µM Calcein Green AM) and stained cells were visualized after 30 min at 37°C as described above using a confocal laser scanning microscope with a 10×/NA 0.3 air objective and 40×/NA 1.3 oil objective.
Immunoblotting
Protein expression levels in BM, FT and MK samples were analyzed by immunoblotting. Samples were lysed in a proteinase inhibitor (Roche, Germany)-containing protein lysis buffer for 20 min on ice and subsequently centrifuged at 20.000 g for 10 min at 4°C. Protein concentration was determined by Pierce BCA assay, and 15 µg protein was used for immunoblotting. Membranes were probed with antibodies raised against CD42b (clone p0p5 [Citation22]), GPVI (clone JAQ1, Emfret), β1-tubulin (polyclonal rabbit IgG, GeneTex), CD61 (clone EDL1 [Citation22]), Ly6G (clone 1A8, BD Biosciences) or -tubulin (loading control, clone DM1A, Santa Cruz). Primary antibodies were detected with the corresponding HRP-conjugated secondary anti-IgG antibodies. Chemiluminescent protein bands were visualized by a digital chemiluminescence imager (Amersham Imager 680, GE Healthcare).
RNA isolation and qPCR analysis
1-Tubulin, integrin
IIb and Ly6G transcripts were analyzed using quantitative PCR (qPCR). Cells from BM, FT and MKs fraction were washed with PBS and resuspended in 500 µL TRIzol. After freezing at −80°C overnight samples were thawed and mixed with 500 μL chloroform followed by centrifugation at 12.000 g for 15 min at 4°C. The upper phase was then transferred into a new reaction tube and mixed with 1 volume 70% EtOH. Subsequent RNA extraction steps were performed using the RNeasy RNA extraction kit (QIAGEN) according to the manufacturer’s instructions. cDNA was synthesized with the iScript cDNA Synthesis kit (Bio-Rad Laboratories) according to the manufacturer’s recommendations using 50 ng RNA. qPCR results were evaluated using the ΔΔCt method in which Ct values of the analyzed target genes were normalized to Ct values of the housekeeping gene Gapdh.
Statistical analysis
Data is presented as mean ± standard deviation (SD). All results were analyzed using GraphPad Prism 9 software (GraphPad Software Inc., San Diego, CA, USA).
Results and discussion
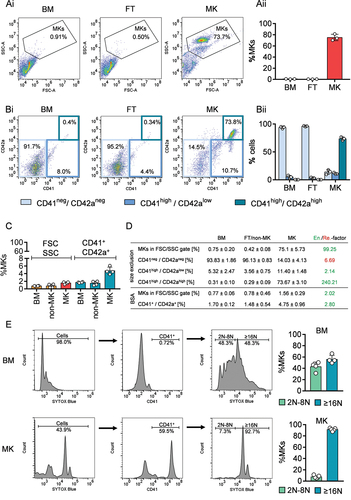
In vitro cultured MKs are commonly used to overcome the limited availability of MKs for research studies. However, in vitro-differentiated MKs lack key features of primary MKs found in the native BM, such as a well-developed DMS. Here, we demonstrate a rapid and simple way to enrich and isolate murine primary BM MKs by capitalizing on the size difference between MKs and other BM cells. During differentiation and maturation, MKs undergo endomitosis to increase their DNA and cytoplasmic content resulting in cells that have diameters of 22 µm on average (mice) but can even reach up to 60 µm (human) [Citation23,Citation24]. In line with this, we enriched mature MKs by sequentially using cell strainers of 20 µm and 15 µm mesh size. Purity analyses by flow cytometry reproducibly revealed at least 70% MKs in the preparation either by gating on FSChigh and SSChigh cells (Ai+Aii) or on CD42a+CD41/CD61+ cells (Bi+Bii) which reflects a 100–250-fold enrichment (). With regard to purity, our filter strategy was superior to other enrichment strategies, such as MACS (average MK purity is 37%) [Citation14] or the BSA density gradient, where we only reached an MK purity of 1.56% ± 0.29% (FSChigh/SSChigh cells) and 4.75% ± 0.96% (CD41+/CD42a+ cells) in the MK fraction as assessed by flow cytometry (). This is in line with published data on BSA gradient enrichment of murine BM [Citation20], further emphasizing the advantages of our method compared to the classical BSA gradient method. Ploidy analysis of the enriched MK fraction clearly demonstrated that our method is suitable to enrich large, mature MKs with ploidy levels of ≥16N (>90% of enriched MKs) (). Analysis of FT samples revealed the same MK ploidy distribution as unfiltered BM samples (BM: 2N-8N MKs = 42.85% ± 8.15%; ≥16 N MKs = 55.9% ± 7.16% and FT: 2N-8N MKs = 39.42% ± 8.37%; ≥16 N MKs = 57.9% ± 8.09%). These results indicate that there are still MKs left in the FT that were not retained in the filter. Interestingly, MKs with ploidy levels of 2–8N were underrepresented compared to whole BM samples, suggesting that this method is of particular interest for studying mature MKs. This is in contrast to MACS [Citation14] or FACS [Citation15] were the selection step is usually based on surface receptor expression and antibody–receptor interaction. Depending on the receptor and its temporal expression level during MK differentiation, these strategies may be more suitable for enrichment of a more heterogeneous MK population in terms of maturation state, including progenitors and megakaryoblasts compared to our method.
Figure 2. Purity and ploidy analysis by flow cytometry of size-exclusion enriched MKs. (Ai) Representative gating strategy for MK purity analysis based on FSC and SSC characteristics with the percentage of cells in the respective gates. (Aii) Quantification of the percentage of cells in the MK gate based on FSC and SSC characteristics. For each data point, the BM cells of 3–4 mice were combined and filtered. Values are mean ± s.d. (Bi) Representative gating strategy for MK purity analysis based on double positive expression of CD42a and CD41/CD61 with the percentage of cells in the respective gates. (Bii) Quantification of the percentage of cells in the MK gate based on double positive expression of CD42a and CD41/CD61. For each data point, BM cells of 3–4 mice were combined. Values are mean ± s.d. (C) Quantification of the percentage of cells in the MK gate based on FSC and SSC characteristics and double positive events (CD41+/CD42a+) before (BM) and after enrichment (non-MK fraction and MK fraction) via BSA gradient. Each data point represents cells from one mouse. Values are mean ± s.d. (D) Percentage overview of different cell population in A, B and C from the bone marrow (BM), flow through (FT) or non-MK and MK fraction enriched via size exclusion (A and B) and BSA gradient (C). Values are mean ± s.d. out of three independent experiments. In the last column, the factor of enrichment (en) or removal (re) was calculated based on the ratio of MK to BM (“enrichment,” green) or of BM to MK (“removal,” red). (E) Left: Representative ploidy analysis and gating strategy of BM, FT and size-exclusion enriched MKs by flow cytometry. SYTOX blue-positive cell populations were gated for CD41/61 expressing MKs. The histogram of SYTOX™ blue Dead Cell Stain intensities was divided to separate MKs with ploidy level of 2N-8N from those cells with≥16N. The percentages of one representative experiment are shown. Right: Quantification of the ploidy analysis shown on the left. Each data point represents one experiment from one mouse. Values are mean ± s.d.
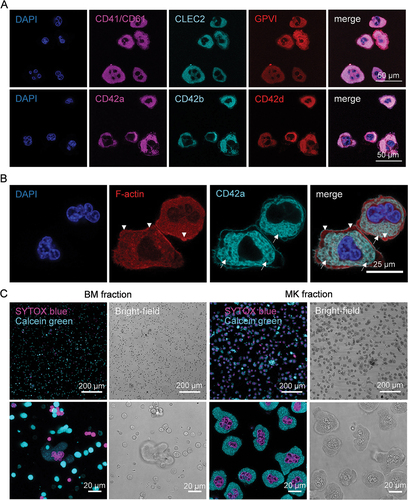
Morphological analysis and qualitative assessment of MK marker protein expression of the enriched MK fraction by CLSM revealed that these MKs express common platelet and MK surface markers, such as CD42a-d, CD41/CD61, CLEC-2 and GPVI (). MKs displayed a well-developed DMS with visible “platelet territories” and an F-actin rich peripheral zone (). Contrary to expectation, most of these cells exhibited a dotted CD42d staining which did not co-localize with CD42a or CD42b. The ectodomain of CD42d harbors a thrombin cleavage site [Citation25] and we speculate that generated thrombin during BM isolation could lead to the cleavage of the CD42d ectodomain resulting in a punctured appearance in the confocal microscopy images. Interestingly, in bright field images almost all isolated MKs displayed a “ghostly” appearance in the form of readily visible nuclei and a textured cytoplasm reminiscent of a complex DMS (). We observed this already in freshly isolated BM MKs (, left). Ghostly MKs have also been described by others, attributing their findings to the MK plasma membrane being compromised and leaky [Citation18]. We used the high-affinity nucleic acid stain SYTOX blue to test MK plasma membrane integrity. SYTOX blue cannot penetrate the plasma membrane of live cells but can easily cross compromised cell membranes. We detected SYTOX blue+ MKs after enrichment, indicating an increased plasma membrane permeability. In contrast, MKs were also positive when stained with Calcein Green, a dye which becomes fluorescent only after enzymatic conversion, suggesting functional esterase activity, viability and an intact cell membrane ().
Figure 3. Representative confocal images of purified MKs. (A) MKs were stained for CD41/CD61 CLEC-2, GPVI, CD42a, CD42b, CD42d and the nucleus after enrichment. Scale bar represents 50 µm. (B) Staining of F-actin (Phalloidin-Atto 647) and CD42a of MKs in the enriched fraction. Arrows point to the well-developed DMS. Arrowheads to the F-actin rich peripheral zone. Scale bar represents 25 µm. (C) Live cell staining with SYTOX blue (cell permeability) and Calcein Green (enzymatic activity, viability) of cells in the BM and MK enriched fraction. Depicted is the fluorescent signal and the corresponding bright-field image of an overview and an image of higher magnification.
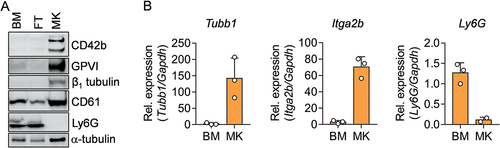
The enrichment of MK specific proteins in the MK fraction was additionally corroborated by immunoblotting. Conversely, the neutrophil marker Ly6G was undetectable in the MK fraction, which is in line with our flow cytometry data (). We confirmed our immunoblot expression results by quantification of Tubb1, Itga2b and Ly6g mRNA levels () emphasizing that this method is a suitable alternative to MACS and FASC for enrichment of (especially) mature MKs. In summary, our data demonstrate that MKs isolated by the filter method outlined in this Technical Report have the morphological, transcriptional and translational features of native MKs in the BM. Therefore, we suggest that this purification method may be useful for numerous purposes, which might eliminate the shortcomings encountered so far.
Figure 4. Analysis of MK specific and neutrophil specific proteins and mRNA in the BM, FT and MK fraction via immunoblot and qPCR. (A) Immunoblot of cell lysates from BM, FT and MK fractions and the expression of indicated proteins. -Tubulin serves as loading control. (B) qPCR from transcripts of the indicated genes in BM and MK fractions. mRNA levels were normalized to the endogenous control Gapdh.
Conclusion
Enrichment of primary MKs is particularly challenging due to their general rarity and fragility as well as their tendency to form aggregates during isolation. Using our simple method for MK enrichment by size exclusion, we provide a yet undescribed method to isolate a fraction of mature MKs in sufficient quantity and quality to perform molecular studies on protein and mRNA level. Our protocol is fast and of low cost, due to the little equipment and consumables that are required compared to FACS and MACS isolation.
Author contributions
M.S. and K.M. developed the method, designed/performed experiments, analyzed data and wrote the original draft of the manuscript. M.B. and H.S. supervised research, acquired funding and discussed results. All authors have critically revised and approved the final version of the manuscript.
Acknowledgments
The authors would like to thank Nadine Winter for excellent technical support in RNA purification and cDNA synthesis, Petra Hauck for excellent technical support in MK isolation and Anna Maria Arold for assistance in immunoblotting.
Disclosure statement
No potential conflict of interest was reported by the author(s).
Additional information
Funding
References
- Italiano JE Jr., Lecine P, Shivdasani RA, Hartwig JH. Blood platelets are assembled principally at the ends of proplatelet processes produced by differentiated megakaryocytes. J Cell Biol. 1999;147:1299–8. doi: 10.1083/jcb.147.6.1299.
- Ebaugh FG Jr., Bird RM. The normal megakaryocyte concentration in aspirated human bone marrow. Blood. 1951;6:75–80. doi: 10.1182/blood.V6.1.75.75.
- Machlus KR, Thon JN, Italiano JE Jr. Interpreting the developmental dance of the megakaryocyte: a review of the cellular and molecular processes mediating platelet formation. Br J Haematol. 2014;165:227–236. doi: 10.1111/bjh.12758.
- Vainchenker W, Raslova H. Megakaryocyte polyploidization: role in platelet production. Platelets. 2020;31:707–716. doi: 10.1080/09537104.2019.1667497.
- Eckly A, Heijnen H, Pertuy F, Geerts W, Proamer F, Rinckel J-Y, Léon C, Lanza F, Gachet C. Biogenesis of the demarcation membrane system (DMS) in megakaryocytes. Blood. 2014;123:921–930. doi: 10.1182/blood-2013-03-492330.
- Schulze HC. Expansion, and differentiation of murine megakaryocytes from fetal liver, bone marrow, and spleen. Curr Protocol Immunol. 2016;112: 22F 26 21-22F 26 15
- Liu H, Liu J, Wang L, Zhu F. In vitro generation of megakaryocytes and platelets. Front Cell Dev Biol. 2021;9:713434. doi: 10.3389/fcell.2021.713434.
- Nakamura S, Sugimoto N, Eto K. Development of platelet replacement therapy using human induced pluripotent stem cells. Dev Growth Differ. 2021;63(2):178–186. doi: 10.1111/dgd.12711.
- Stone AP, Nascimento TF, Barrachina MN. The bone marrow niche from the inside out: how megakaryocytes are shaped by and shape hematopoiesis. Blood. 2022;139:483–491. doi: 10.1182/blood.2021012827.
- Abbonante V, Di Buduo CA, Malara A, Laurent PA, Balduini A. Mechanisms of platelet release: in vivo studies and in vitro modeling. Platelets. 2020;31(6):717–723. doi: 10.1080/09537104.2020.1774532.
- Wang B, Zheng J. Platelet generation in vivo and in vitro. SpringerPlus. 2016;5:787. doi: 10.1186/s40064-016-2384-1.
- Liu C, Wu D, Xia M, Li M, Sun Z, Shen B, Liu Y, Jiang E, Wang H, Su P, et al. Characterization of cellular heterogeneity and an immune subpopulation of human megakaryocytes. Adv Sci. 2021;8:e2100921. doi: 10.1002/advs.202100921.
- Posel C, Möller K, Fröhlich W, Schulz I, Boltze J, Wagner D-C. Density gradient centrifugation compromises bone marrow mononuclear cell yield. PloS One. 2012;7(12):e50293. doi: 10.1371/journal.pone.0050293.
- Schmitz B, Radbruch A, Kümmel T, Wickenhauser C, Korb H, Hansmann ML, Thiele J, Fischer R. Magnetic activated cell sorting (MACS)–a new immunomagnetic method for megakaryocytic cell isolation: comparison of different separation techniques. Eur J Haematol. 1994;52(5):267–275. doi: 10.1111/j.1600-0609.1994.tb00095.x.
- Heazlewood SY, Williams B, Storan MJ, Nilsson SK. The prospective isolation of viable, high ploidy megakaryocytes from adult murine bone marrow by fluorescence activated cell sorting. Methods Mol Biol. 2013;1035:121–133.
- Braylan RC, Jordan EK. Rapid and simple procedure for isolation and concentration of human megakaryocytes from marrow aspirates. Blood. 2013;122(21):5269–5269. doi: 10.1182/blood.V122.21.5269.5269.
- Hoffman JF. On red blood cells, hemolysis and resealed ghosts. Adv Exp Med Biol. 1992;326:1–15.
- Osman S, Dalmay D, Mahaut-Smith M. Fluorescence approaches to image and quantify the demarcation membrane system in living megakaryocytes. Methods Mol Biol. 2018;1812:195–215.
- Heib T, Gross C, Muller ML, Stegner D, Pleines I. Isolation of murine bone marrow by centrifugation or flushing for the analysis of hematopoietic cells – a comparative study. Platelets. 2021;32(5):601–607. doi: 10.1080/09537104.2020.1797323.
- Nakeff A, Floeh DP. Separation of megakaryocytes from mouse bone marrow by density gradient centrifugation. Blood. 1976;48:133–138. doi: 10.1182/blood.V48.1.133.133.
- May F, Hagedorn I, Pleines I, Bender M, Vögtle T, Eble J, Elvers M, Nieswandt B. CLEC-2 is an essential platelet-activating receptor in hemostasis and thrombosis. Blood. 2009;114(16):3464–3472. doi: 10.1182/blood-2009-05-222273.
- Nieswandt B, Bergmeier W, Rackebrandt K, Gessner JE, Zirngibl H. Identification of critical antigen-specific mechanisms in the development of immune thrombocytopenic purpura in mice. Blood. 2000;96:2520–2527. doi: 10.1182/blood.V96.7.2520.
- Stegner D, vanEeuwijk JMM, Angay O, Gorelashvili MG, Semeniak D, Pinnecker J, Schmithausen P, Meyer I, Friedrich M, Dütting S, et al. Thrombopoiesis is spatially regulated by the bone marrow vasculature. Nat Commun. 2017;8:127. doi: 10.1038/s41467-017-00201-7.
- Tomer A. Human marrow megakaryocyte differentiation: multiparameter correlative analysis identifies von Willebrand factor as a sensitive and distinctive marker for early (2N and 4N) megakaryocytes. Blood. 2004;104:2722–2727. doi: 10.1182/blood-2004-02-0769.
- Hickey MJ, Hagen FS, Yagi M, Roth GJ. Human platelet glycoprotein V: characterization of the polypeptide and the related Ib-V-IX receptor system of adhesive, leucine-rich glycoproteins. Proc Natl Acad Sci USA. 1993;90:8327–8331. doi: 10.1073/pnas.90.18.8327.