
 ?Mathematical formulae have been encoded as MathML and are displayed in this HTML version using MathJax in order to improve their display. Uncheck the box to turn MathJax off. This feature requires Javascript. Click on a formula to zoom.
Abstract
Although the presence of glycogen in platelets was established in the 1960s, its importance to specific functions (i.e., activation, secretion, aggregation, and clot contraction) remains unclear. Patients with glycogen storage disease often present with increased bleeding and glycogen phosphorylase (GP) inhibitors, when used as treatments for diabetes, induce bleeding in preclinical studies suggesting some role for this form of glucose in hemostasis. In the present work, we examined how glycogen mobilization affects platelet function using GP inhibitors (CP316819 and CP91149) and a battery of ex vivo assays. Blocking GP activity increased glycogen levels in resting and thrombin-activated platelets and inhibited platelet secretion and clot contraction, with minimal effects on aggregation. Seahorse energy flux analysis and metabolite supplementation experiments suggested that glycogen is an important metabolic fuel whose role is affected by platelet activation and the availability of external glucose and other metabolic fuels. Our data shed light on the bleeding diathesis in glycogen storage disease patients and offer insights into the potential effects of hyperglycemia on platelets.
Plain Language Summary
What did we know?
Activated platelets transition from a low-energy-requiring, resting state to a high-energy-demanding state.
Platelet glycogen is degraded upon activation.
Glycogen storage disorders and glycogen phosphorylase inhibitors are associated with bleeding.
What did we discover?
Glycogen turnover occurs in resting platelets and its degradation is important for platelet functions.
Glycogen phosphorylase inhibitors block secretion and clot contraction of which the latter can be reversed with alternative metabolic fuels.
Glucose derived from glycogen may be routed through TCA/OxPhos versus aerobic glycolysis.
What is the impact?
Glycogen breakdown contributes to the high energy requirements of platelet function.
Our work offers insights into potential energy sources in activated platelets.
Keywords:
Introduction
Glycogen is a branched polymer of glucose stored in tissues, such as the liver and muscle that is metabolized during high energy demand.Citation1 Platelets are one of the most metabolically flexible cells in circulation.Citation2 They are known to switch their energy production between basal Tricarboxylic Acid Cycle and Oxidative Phosphorylation (TCA/OxPhos) and aerobic glycolysis depending on oxygen tension, the availability of substrates, and their activation state.Citation2,Citation3 Platelets have considerable metabolizable glycogen stores, equivalent to those of skeletal muscle.Citation4 Deleting the two major glucose transporters, GLUT1 and 3 decreases total platelet glycogen, suggesting that the stores are dynamic.Citation5 Active enzymes involved in glycogen synthesis (glycogen synthase kinase) and breakdown (glycogen phosphorylase) are present in platelets indicating the potential for dynamic glycogen metabolism.Citation4 Despite these insights, the functional importance of glycogen granules in specific platelet functions (activation, secretion, aggregation, and contraction) is unclear.
The clinical effects of dysregulated platelet glycogen metabolism are implied from the pathologies seen in glycogen storage disease patients. Glycogen storage disease Type I (GSDIa), aka von Gierke’s disease, is an autosomal recessive disease with a deficiency of glucose-6-phosphatase in the liver, kidney, and intestine. It is characterized by hepatomegaly, hypoglycemia, lactic acidosis, hyperlipidemia, hyperuricemia, and a bleeding diathesis.Citation6–9 The bleeding diathesis is associated with prolonged bleeding time and a qualitative platelet defect.Citation6 While this bleeding could be due to hepatic damage and poor coagulation factor production, platelet dysfunction could also contribute.Citation6,Citation10
A key enzyme needed to mobilize glucose from glycogen is glycogen phosphorylase.Citation4 This enzyme removes terminal, α1–4-linked, glucoses from the polymer, generating glucose-1-phosphate that can be further metabolized by glycolysis.Citation11 Glycogen phosphorylase exists in two interconvertible forms (a and b); the proportions of each are regulated by phosphorylation.Citation12 Pharmacological inhibitors of glycogen phosphorylase have been developed to attenuate the hyperglycemia associated with diabetes, though their success has been limited because of bleeding complications.Citation13,Citation14 Two structurally related compounds, CP316819 and CP91149, inhibit GP by binding at the regulatory pocket.Citation13 CP316819 is a more efficacious derivative of CP91149. These inhibitors principally bind to the less active b form and prevent its conversion to the more active a form.
Although manipulation of glycogen does seem a logical anti-diabetes treatment to regulate hyperglycemia, preclinical rodent studies using glycogen phosphorylase inhibitors reported bleeding upon prolonged use.Citation13,Citation14 These data, together with the bleeding diatheses associated with GSD patients suggest a potential role for glycogenolysis in platelet function and perhaps clot formation. In this article, we tested the direct effects of CP316819 and CP91149 on several aspects of platelet functions using a battery of ex vivo systems. Surprisingly, we observed active turnover of glycogen in resting platelets and a need for its mobilization to fuel energy-requiring processes such as clot contraction. While clot contraction was disrupted by the GP inhibitors, the effects could be reversed by adding metabolic fuels that enter the TCA cycle downstream of glycolysis. Oxygen consumption and media acidification measurements suggested that glucose from glycogen may be routed to the TCA cycle and OxPhos and not to aerobic glycolysis.
Methods
Platelet preparation
Mouse platelets from both sexes were prepared and pooled as described in Prakhya et al.Citation15 Care was taken to harvest platelets in the morning, as the mice begin their dormant phase. Platelet counts were measured using Z2 Coulter Particle Count and Size Analyzer and adjusted using HEPES-Tyrodes Buffer (pH 7.4) with 5 mM glucose. The indicated concentrations of the two glycogen phosphorylase inhibitors CP316819 (Sigmal-Aldrich PZ0189) and CP91149 (Cayman Chemicals 17 709) were added and incubated for 30 min at room temperature before assay.
Glycogen measurement
Washed mouse (C57Bl6/J) platelets (75 μg protein/sample) were harvested, treated with CP316819 (50 μM) or CP91149 (62.5 μM) for 30 min, and either held as resting (R) or activated (A) with 0.1 U/mL thrombin (Chronolog P/N 386) for 30 min. Glycogen levels were measured using an assay kit (Cayman #700480). Pooling of platelets from 4 mice was needed based on the linear range of the assay kit. This was extrapolated from the reported liver glycogen/protein measurements in the kit description. We further optimized the assay based on a pilot experiment to assure that our measurements were within the dynamic range of assay sensitivity, albeit at the lower end for untreated platelets. Measurements were taken via fluorimetry as per the manufacturer’s instructions.
Clot contraction measurements
Mouse platelets (5 × 10⁷ platelets/mL) were incubated with the indicated concentrations of the inhibitors (30 min with 0.5 mM CaCl2). Platelets from a single mouse were split into control, CP316819, and CP91149 treatments. Clot contraction was initiated with 250 μg/mL fibrinogen and 0.02 U/mL thrombin. The clot contraction assay was performed, and parameters were calculated as described in Prakhya et al.Citation15 For clot contraction assays with different glucose concentrations, platelets were isolated in HEPES-Tyrodes buffer (pH 6.5 and 7.4) with 2.5 mM or 25 mM glucose. For metabolite supplementation experiments, platelets were isolated in HEPES-Tyrodes buffer with 5 mM glucose, and clot contraction was measured in the presence of the indicated inhibitors (50 μM CP316819 and 10 mM 2-Deoxy-D-glucose) and metabolic fuels (5 mM pyruvate).
Aggregation and ATP/ADP release
Aggregation and ATP/ADP release were simultaneously monitored in a lumi-aggregometer. Washed mouse platelets (2 × 10⁸ platelets/mL), prepared from pooling 2–3 mice, were incubated with inhibitors for 30 min followed by the addition of 1 mM CaCl2 and stimulated with 0.05 U/mL thrombin or 10 μg/mL collagen.
Flow cytometry
For flow cytometry measurements, washed platelets isolated from a single mouse (5 × 10⁷ platelets/mL) were split into control, CP316819, and CP91149 and incubated with inhibitors for 30 min and then held at resting or stimulated with thrombin (0.05 U/mL) or convulxin (200 ng/mL) for 2 min then incubated with FITC conjugated anti-P-selectin and PE-conjugated JonA antibodies for 20 min at 37°C. Fluorescence intensities were measured by flow cytometry using a FACScanTM flow cytometer (BD Biosciences)Citation16 and geometric mean fluorescence intensity (GMFI) was calculated using FlowJo version 10.8.0.
Bioflux microfluidics
Whole blood from a single mouse was incubated with the inhibitors for 10 min before adding hirudin (4 U/mL) and CaCl2 (1 mM) and the whole blood mixture was perfused over immobilized collagen (coated at 40 μg/mL) in a microfluidic flow chamber (BioFlux, Fluxion Biosciences, Oakland, CA) at a shear rate of 20 dyn/cm2. DIC images were taken during post-perfusion washing (PBS and 0.5% BSA) with a Nikon Eclipse Ti2 inverted microscope with 40× magnification. Analysis of the images was performed with Fiji ImageJ software. Images were scored based on contraction and multilayer formation.
Measurements of platelet bioenergetics
Seahorse analysis required high platelet protein content, thus, platelets from three animals were pooled. Standardized platelet protein (25 μg) was used per well. Platelet bioenergetics was measured using a Seahorse instrument (Agilent Seahorse XFe96, Santa Clara, CA) with the addition of substrates and inhibitors in a resting state and upon thrombin stimulation (0.1 U/mL). Extracellular acidification rate (ECAR) and Oxygen Consumption (OCR) were calculated as described in.Citation17
Statistics
Data are shown as Mean ± SEM. Statistical analysis was performed using GraphPad Prism 8.4.3 (GraphPad Software, San Diego, CA, USA). Glycogen measurements and analysis of platelet bioenergetics using Seahorse were analyzed using Repeated Measures (RM) two-way ANOVA with Bonferroni’s test for multiple comparisons. The remaining data were analyzed by one-way ANOVA with Bonferroni’s test for multiple comparisons. Furthermore, the Shapiro-Wilk test was performed to ensure normality. P ≤ .05 is considered statistically significant.
Results
Glycogen phosphorylase inhibitors suppress the mobilization of platelet glycogen
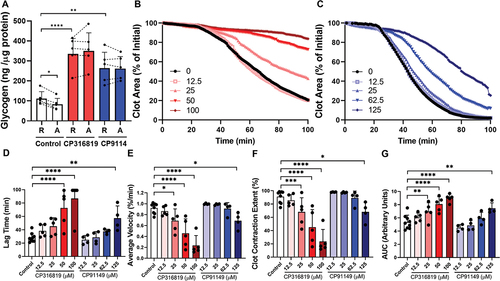
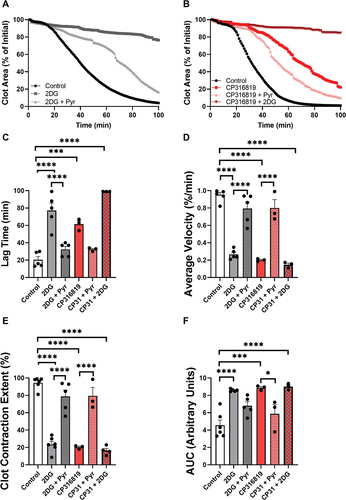
To better understand the functional importance of glycogen and its mobilization in platelet function, we tested the effects of CP316819 and CP91149 using a battery of ex vivo platelet assays. As seen in other studies, there was a decrease in platelet glycogen (average decrease of 26%) upon platelet activation (). Consistent with their activity, both inhibitors blocked the activation-dependent decrease in glycogen levels as predicted (). Interestingly, glycogen levels increased ~ 3-fold in resting platelets treated with either inhibitor. Such data demonstrate the efficacy of the inhibitors in platelets and suggest that, in the presence of external glucose, platelets constitutively generate and consume glycogen. This steady-state turnover appears shifted toward net consumption upon activation.
Figure 1. Glycogen Phosphorylase inhibitors block platelet-mediated clot contraction. (A) Washed mouse (C57bl6/J) platelets (75 μg protein/sample) were harvested in the morning, treated with CP316819 (50 μM) or CP91149 (62.5 μM) for 30 min, and either held as resting (R) or activated (A) with 0.1 U/mL thrombin for 30 min. Glycogen levels were measured using an assay kit (Cayman #700480) following the manufacturer’s instructions (n = 5). (B, C) Representative clot contraction curves. Lag time (D), average contraction velocity (E), extent of contraction (F), and area under the curve (AUC; G) (n = 4–5) were calculated as described in Prakhya et al.Citation15 the error bars are SEM; P ≤ .05: *; P ≤ .01: **; P ≤ .001: ***; P ≤ .0001: ****. Statistical significance was assessed as described in the methods.
Glycogen mobilization is required for clot contraction
The various steps of platelet activation and thrombosis are proposed to have distinct energy requirements, with shape change being the least energy-requiring process followed by aggregation, secretion, and clot contraction, in increasing order of energy need.Citation18 We first tested the importance of glycogen mobilization in the most energy-demanding step, clot contraction, using our newly described in vitro clot contraction assay.Citation15 After incubation of mouse platelets with or without the inhibitors for 30 min, clot contraction was initiated with 0.02 U/mL thrombin in the presence of 0.5 mM CaCl2 and 250 μg/mL fibrinogen. Clot images were obtained every minute and the data were analyzed. Both GP inhibitors impaired the initiation and kinetics of clot contraction () with CP316819 being more potent than CP91149. The inhibitors significantly prolonged the lag time by 2.8-fold for CP316819 and 2.3-fold for CP91149 at their highest concentrations (). The inhibitors also decreased the average velocity by 84 and 35% (), reduced the extent of contraction by 80 and 31% (), and increased the area under the curve by 1.6 and 1.4-fold, respectively (). Together, these data demonstrate that the two GP inhibitors dose-dependently blocked clot contraction in our in vitro assay.
Glycogenolysis is important for secretion, activation, and thrombosis under shear, but not for aggregation
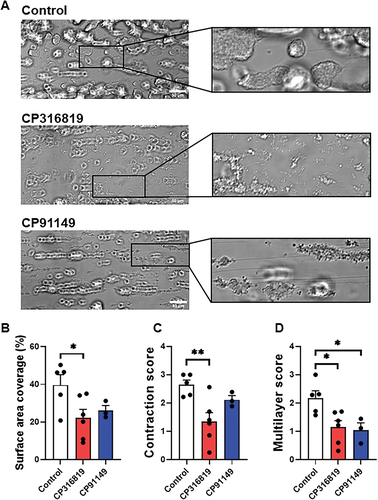
Given that contraction can be viewed as the culmination of platelet activation, we examined the effect of the GP inhibitors on individual steps. Platelet aggregation induced by thrombin () was not significantly affected and that induced by collagen () was modestly decreased only when GP inhibitor CP316819 was used but not when platelets were incubated with CP91149. However, secretion and integrin activation were affected. There was a decrease in ATP release from dense granules upon thrombin or collagen stimulation () when CP316819 was used. Surface expression of P-selectin, as a metric of α-granule release (), and αIIbβ3 platelet integrin activation () were significantly reduced when either GP inhibitor was used. When whole blood was incubated for 10 min with CP316819 or CP91149, and perfused over collagen-coated channels at 20 dyn/cm2, the total surface area covered by platelet thrombi was diminished (). Complementary to the data shown in , CP316819 inhibited the contraction of platelet thrombi formed under whole blood flow over a collagen surface (). Both glycogen phosphorylase inhibitors reduced the height of the thrombi, as defined with the multilayer score (). From these data, aggregation was comparatively less dependent on glycogen mobilization than the release of ATP, α-granule release, αIIbβ3 integrin activation, or adhesion to collagen under flow.
Figure 2. Disrupting glycogenolysis affects platelet secretion and integrin activation. Washed mouse (C57bl6/J) platelets were harvested in the morning and treated with CP316819 (50 μM) or CP91149 (62.5 μM) for 30 min at room temperature followed by the addition of indicated agonists (thrombin and collagen). Representative tracing showing thrombin- (0.05 U/mL; A) and collagen- (10 μg/mL; B) induced aggregation. (C) Summary data of the aggregation experiments (n = 3–5). Representative tracing showing thrombin- (0.05 U/mL; D) and collagen- (10 μg/mL; E) induced ATP secretion. (F) Summary data of the ATP secretion experiments (n = 3–5). (G) Flow cytometry measurements of P-selectin exposure in resting and thrombin-stimulated (0.05 U/mL) and convulxin (200 ng/mL) platelets (n = 4). (H) Flow cytometry measurements of αIIbβ3 integrin activation in resting and thrombin-stimulated (0.05 U/mL) and convulxin (200 ng/mL) platelets (n = 4). The error bars show SEM; P ≤ .05: *; P ≤ .001: ***; P ≤ .0001: ****. Statistical significance was assessed as described in the methods.
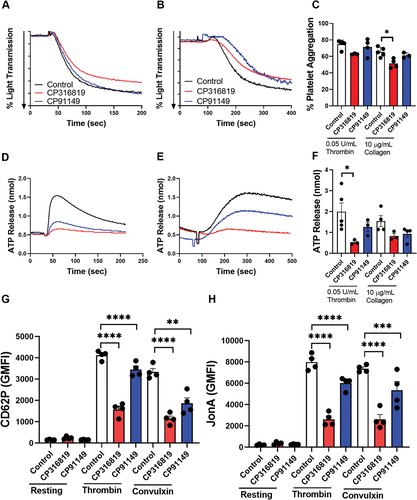
Figure 3. Glycogen phosphorylase inhibitors suppress thrombus formation under flow over immobilized collagen. (A) Representative DIC images, taken on a single plane, after 9 min of blood perfusion without inhibitor or in the presence of CP316819 (50 μM) or CP91149 (62.5 μM). Quantitative analysis of platelet surface area coverage (B), contraction score (from 0: no contraction to 3: fully contracted) (C), and multilayer score (from 0: no multilayer to 3: large fully multilayered thrombi). (D). Scale bar is 50 µm. The error bars show SEM; n = 3–6; P ≤ .05: *; P ≤ .01: **. Statistical significance was assessed as described in the methods.
External glucose and other metabolic fuels mitigate clot contraction inhibition by CP316819
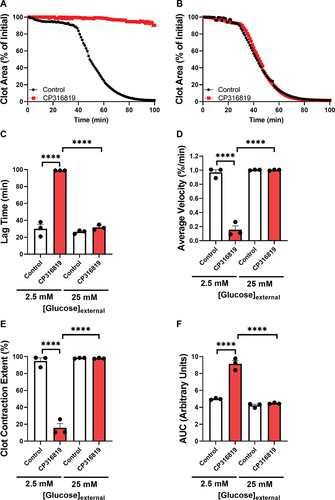
All previous assays were performed with external glucose (5 mM), in part because eliminating external glucose entirely degrades platelet function (data not shown). To address the role of glycogen when glucose is limited or in excess, we performed clot contraction assays in the presence of 2.5- and 25-mM glucose and examined the effects of the most efficacious inhibitor CP316819. At the lowest glucose concentration, GP inhibition resulted in a robust decrease in contraction (). This effect was attenuated at higher external glucose levels (). Consistently, we saw an increase in lag time (), a decrease in average velocity (), reduction in clot contraction extent (), and an increase in AUC (), when platelets were isolated in buffers containing 2.5 mM glucose. The inhibitory effects of CP316819 disappeared when the external glucose concentration of 25 mM was utilized (). These data demonstrate that the importance of platelet glycogen is significantly affected by the availability of external glucose and glycogen mobilization is not required if sufficient external glucose is present. These data also suggest that the effects of the GP inhibitor are not due to off-target effects since the functionality was restored by glucose addition.
Figure 4. Glycogenolysis is more important when external glucose is limiting mouse (C57bl6/J) platelets (5 107 platelets/mL, harvested in the morning) were incubated with 50 μM CP316819 for 30 min in the presence of 0.5 mM CaCl2. Clot contraction was started by the simultaneous addition of 250 μg/mL fibrinogen and 0.02 U/mL thrombin. Shown are representative clot contraction curves where mouse platelets were isolated in buffers containing 2.5 (A), and 25 mM (B) glucose. Lag time (C), average contraction velocity (D), the extent of contraction (E), and area under the curve (AUC; F) (n = 3) were calculated as described in Prakhya et al.Citation15 the error bars are SEM; P ≤ .0001: ****. Statistical significance was assessed as described in the methods.
Our data suggest that glycolysis of external glucose, taken up through glucose transporters, can compensate for the loss of glycolysis of glucose liberated from internal glycogen stores. To further investigate this, platelets were treated with the glycolysis inhibitor 2-Deoxy-D-glucose (2DG), which enters via glucose transporters but cannot be converted to fructose-1,6 bisphosphate and thus competitively blocks glycolysis. Our previous work demonstrated how 2DG blocks clot contractionCitation15 and here we show that that block is reversed by the addition of pyruvate, a substrate that is used directly by the tricarboxylic acid (TCA) cycle (). The addition of pyruvate reversed the inhibition caused by CP316819 (), suggesting the requirements for glycogen can be bypassed with a fuel that is used in the TCA cycle and oxidative phosphorylation to produce ATP. Consistent with the expected metabolic route of glucose mobilized from glycogen, the addition of CP316819 did not significantly affect the inhibition caused by 2DG. These rescue experiments further demonstrate that the inhibitors are unlikely to be nonspecifically degrading platelet function since the activity was restored by an alternate fuel.
Figure 5. The effects of glycogenolysis inhibition are partially reversed with mitochondrial fuels mouse (C57bl6/J) platelets (5 107 platelets/mL, harvested in the morning) were incubated with different inhibitors as indicated for 30 min (50 μM CP316819, 10 mM 2DG and 5mM pyruvate) in the presence of 0.5 mM CaCl2. Clot contraction was started by the addition of 250 μg/mL fibrinogen and 0.02 U/mL thrombin. Shown are representative clot contraction curves for 2DG and pyruvate rescue (A) and pyruvate rescue with CP316819 (B). Lag time (C), average contraction velocity (D), extent of contraction (E), and area under the curve (AUC; F) (n = 3–6) were calculated as described in Prakhya et al.Citation15 the error bars are SEM; P ≤ .05: *; P ≤ .001: ***; P ≤ .0001: ****. Statistical significance was assessed as described in the methods.
Inhibition of glycogenolysis affects ECAR and OCR in resting and activated platelets
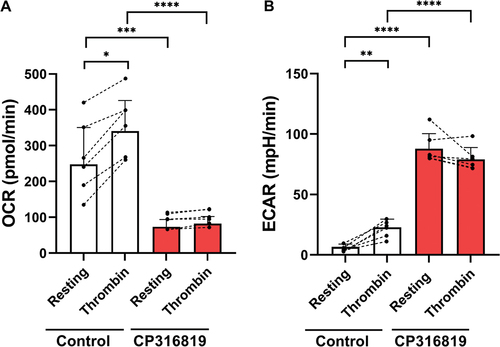
Upon platelet activation, there is a shift to increased aerobic glycolysis as evidenced by increased lactate production and extracellular acidification rate (ECAR).Citation3,Citation19 Oxidative phosphorylation (OxPhos) also increased as evidenced by increased oxygen consumption rate (OCR).Citation19 To examine how glycogenolysis affects the flux of glucose through aerobic glycolysis and OxPhos, platelets were treated with GP inhibitors and ECAR/OCR were measured via the Seahorse with or without platelet activation (thrombin; 0.02 U/mL). These experiments were performed in the presence of 5 mM glucose. In resting platelets, blocking glycogenolysis significantly reduced OCR and increased ECAR (), suggesting a shift in resting platelet bioenergetics to aerobic glycolysis. While both OCR and ECAR increased upon activation of untreated platelets, as reported previously,Citation18,Citation20 inhibited GP blocked those increases.
Figure 6. Inhibition of glycogenolysis affects aerobic glycolysis and oxygen consumption. Extracellular acidification rate (ECAR; A) and oxygen consumption (OCR: B) were measured using a Seahorse instrument (Agilent Seahorse XFe96, Santa Clara, CA) with the addition of substrates and inhibitors in resting and upon thrombin stimulation (0.1 U/mL) Extracellular acidification rate (ECAR) and oxygen consumption (OCR) were measured and calculated as described inCitation17 (n = 6). (B). the error bars are SEM; P ≤ .05: *; P ≤ .01: **; P ≤ .001: ***; P ≤ .0001: ****; Statistical significance was assessed as described in the methods.
Discussion
In this manuscript, we demonstrate that resting platelets actively generate and utilize glycogen under normoglycemic conditions (i.e., 5 mM). There is a steady-state turnover of glycogen in resting platelets that is shifted to net degradation/consumption upon activation (see ). This is consistent with several previous studies showing evidence of glycogen degradation in activated platelets.Citation4 Our data demonstrate a role for glycogenolysis in platelet function, especially in the energy-requiring steps associated with clot contraction. This role is more important when external glucose levels are reduced below normoglycemic levels and much less so under hyperglycemic conditions. This balanced energy production from both internal and external fuels appears to be an important aspect of platelet functionality. Previous studies using glucose transporter (GLUT1 and 3) deficient mice and platelets suggested that while increased uptake of glucose is important to power platelet function, residual energy sources, such as glycogen, can account for some energy production in the early phases of activation before full mobilization of GLUT3 from α granules to the plasma membrane occurs.Citation5 Our data are consistent with this view (see ).
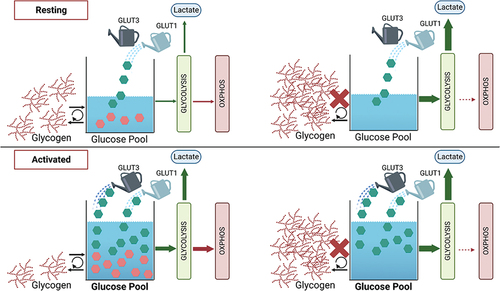
Figure 7. Model for glycogen and glucose metabolism in resting and activated platelets. Depicted is a working model to explain glycogen and glucose usage in resting and activated platelets. In resting platelets, an influx of glucose via GLUT1 fuels basal platelet bioenergetics and glycogen biosynthesis. The glycogen pools dynamically cycle (biosynthesis/degradation). When glycogen phosphorylase is inhibited (red X), glycogen accumulates and the bioenergetic balance shifts to aerobic glycolysis (high ECAR, low OCR). Upon activation with thrombin, glycogen stores are degraded plus additional glucose enters via GLUT3 from α-granules that mobilize to the platelet surface. This increases the flux of glucose through aerobic glycolysis, enhancing lactate production and shifting the bioenergetic balance. However, when glycogen phosphorylase is inhibited (red X), there is no additional activation-dependent increase in aerobic glycolysis or oxygen consumption. Our data suggest a biasing in the metabolic fates for the two pools of glucose, with that from glycogen being selectively directed to the TCA cycle and oxidation (OCR), while the extra-platelet glucose is channeled to lactate production (ECAR).
Platelets become highly glycolytic upon activation, increasing lactate production and media acidification. This shift to aerobic glycolysis can rapidly increase the rate of ATP production and is facilitated by the increased glucose influx, as noted above.Citation3 In many cells and tissues, the increased glucose/glycolysis can cause OxPhos (OCR/O2 consumption) to decrease, in a process known as the Crabtree effect which is thought to occur when glycolysis (with NAD+ regeneration) can produce sufficient ATP for function.Citation21 This does not completely explain the response of activated platelets where both ECAR and OCR increase (). Metabolomic studies show an increased flux of glucose through the glycolytic pathways upon activation.Citation22 In our studies when glycogenolysis is blocked, OCR is greatly reduced in resting platelets and does not increase upon activation (). Our data imply that the metabolic fate of the glucose from platelet glycogen could be through both glycolysis and the TCA cycle (and by extension OxPhos) with a bias toward TCA/OxPhos. Under resting conditions, platelet energy production appears balanced between aerobic glycolysis and TCA/OxPhos. Flux studies have suggested that resting platelets rely on the two sources of ATP, equally.Citation20 Blocking glycogenolysis shifts the balance, increasing lactate production (ECAR) and decreasing OxPhos (OCR; ). This increased aerobic glycolysis could be compensatory for lost ATP production to rebalance the platelets’ resting state. Upon activation, there is a shift to aerobic glycolysis, likely due to the robust increase in glucose influx via the GLUTs (specifically GLUT3) now mobilized to the platelet plasma membrane from fused α granules. The fate of glycolytic products (i.e., pyruvate) from this pool of glucose may be shifted toward lactate production to regenerate cytosolic NAD+ so that glycolysis can continue. The glycolytic products from the glycogen-derived glucose may be differently routed to the TCA cycle and ultimately to oxidation (OxPhos). Thus, the glycogen pool could act as a reserve to fuel more efficient ATP production via TCA/OxPhos instead of being directed exclusively to the more rapid but less efficient aerobic glycolysis. Similar metabolic routes for glucose have been implied from whole-animal metabolomic experiments.Citation22 In these studies, circulating glucose was acutely metabolized by aerobic glycolysis while the carbons from preloaded glycogen pools went into TCA cycle intermediates. This occurred in several tissues, especially those that normally had glycogen stores, suggesting that these two pools of glucose may have unique metabolic fates.Citation22 Whether this is reflective of an organism-wide control system or intrinsic to specific cells or cell types remains to be defined. Future metabolomic studies will be needed to understand how this is relevant to platelet function.
Since glycogen breakdown fuels high-energy processes like clot contraction and thrombus formation under shear, our data offer a potential mechanistic explanation for the bleeding diatheses associated with glycogen storage diseases and caused by GP inhibitors in preclinical studies. However, this is almost assuredly an over-simplification since the pathology and the inhibitors would also affect the liver and potentially the production of coagulation factors. Hepatic pathology is an aspect of glycogen storage disorders.Citation23,Citation24 Similarly, GP-targeted anti-diabetic drugs could exert their effects through some hepatotoxicity. Further analysis with platelet-specific manipulations of glycogen levels will ultimately be needed to fully define the importance of glycogen’s contribution to platelets, in vivo, and its role in hemostasis.
Author contributions
K.S.P. designed and performed the experiments, analyzed data and wrote the manuscript. H.V., D.C., L.O. J.L., S.J., H.R.A. assisted with some of the experiments., Q.J.W. and P.S. advised on the interpretation of the results. S.W.W. directed the research and edited the manuscript.
Acknowledgments
The authors thank Dr. Jeremy P. Wood and the members of the Whiteheart Laboratory for their careful perusal of this manuscript.
Disclosure statement
No potential conflict of interest was reported by the author(s).
Additional information
Funding
References
- Kanungo S, Wells K, Tribett T, El-Gharbawy A. Glycogen metabolism and glycogen storage disorders. Ann Transl Med. 2018;6(24):474. doi:10.21037/atm.2018.10.59.
- Kramer PA, Ravi S, Chacko B, Johnson MS, Darley-Usmar VM. A review of the mitochondrial and glycolytic metabolism in human platelets and leukocytes: implications for their use as bioenergetic biomarkers. Redox Biol. 2014;2:206–10. doi:10.1016/j.redox.2013.12.026.
- Aibibula M, Naseem KM, Sturmey RG. Glucose metabolism and metabolic flexibility in blood platelets. J Thromb Haemost. 2018;16(11):2300–14. doi:10.1111/jth.14274.
- Scott RB, Cooper LW. Activation of glycogen phosphorylase in blood platelets. Blood. 1967;30(3):321–30. doi:10.1182/blood.V30.3.321.321.
- Fidler TP, Campbell RA, Funari T, Dunne N, Balderas Angeles E, Middleton EA, Chaudhuri D, Weyrich AS, Abel ED. Deletion of GLUT1 and GLUT3 reveals multiple roles for glucose metabolism in platelet and megakaryocyte function. Cell Rep. 2017;20(4):881–94. doi:10.1016/j.celrep.2017.06.083.
- Czapek EE, Deykin D, Salzman EW. Platelet dysfunction in glycogen storage disease type I. Blood. 1973;41(2):235–47. doi:10.1182/blood.V41.2.235.235.
- Marti GE, Rick ME, Sidbury J, Gralnick HR. DDAVP infusion in five patients with type Ia glycogen storage disease and associated correction of prolonged bleeding times. Blood. 1986;68(1):180–4. doi:10.1182/blood.V68.1.180.180.
- Gilchrist GS, Fine RN, Donnell GN. The hemostatic defect in glycogen storage disease, type 1. Acta Paediatr Scand. 1968;57(3):205–8. doi:10.1111/j.1651-2227.1968.tb04679.x.
- Austin SL, El-Gharbawy AH, Kasturi VG, James A, Kishnani PS. Menorrhagia in patients with type I glycogen storage disease. Obstet Gynecol. 2013;122(6):1246–54. doi:10.1097/01.AOG.0000435451.86108.82.
- Mühlhausen C, Schneppenheim R, Budde U, Merkel M, Muschol N, Ullrich K, Santer R. Decreased plasma concentration of von Willebrand factor antigen (VWF:Ag) in patients with glycogen storage disease type Ia. J Inherit Metab Dis. 2005;28(6):945–50. doi:10.1007/s10545-005-0184-9.
- Zois CE, Harris AL. Glycogen metabolism has a key role in the cancer microenvironment and provides new targets for cancer therapy. J Mol Med (Berl). 2016;94(2):137–54. doi:10.1007/s00109-015-1377-9.
- Suh SW, Bergher JP, Anderson CM, Treadway JL, Fosgerau K, Swanson RA. Astrocyte glycogen sustains neuronal activity during hypoglycemia: studies with the glycogen phosphorylase inhibitor CP-316,819 ([R-R*,S*]-5-chloro-N-[2-hydroxy-3-(methoxymethylamino)-3-oxo-1-(phenylmethyl)propyl]-1H-indole-2-carboxamide). J Pharmacol Exp Ther. 2007;321(1):45–50. doi:10.1124/jpet.106.115550.
- Baker DJ, Timmons JA, Greenhaff PL. Glycogen phosphorylase inhibition in type 2 diabetes therapy: a systematic evaluation of metabolic and functional effects in rat skeletal muscle. Diabetes. 2005;54(8):2453–9. doi:10.2337/diabetes.54.8.2453.
- Floettmann E, Gregory L, Teague J, Myatt J, Hammond C, Poucher SM, Jones HB. Prolonged inhibition of glycogen phosphorylase in livers of Zucker diabetic fatty rats models human glycogen storage diseases. Toxicol Pathol. 2010;38(3):393–401. doi:10.1177/0192623310362707.
- Prakhya KS, Luo Y, Adkins J, Hu X, Wang QJ, Whiteheart SW. A sensitive and adaptable method to measure platelet-fibrin clot contraction kinetics. Res Pract Thromb Haemost. 2022;6(5):e12755. doi:10.1002/rth2.12755.
- Joshi S, Banerjee M, Zhang J, Kesaraju A, Pokrovskaya ID, Storrie B, Whiteheart SW. Alterations in platelet secretion differentially affect thrombosis and hemostasis. Blood Adv. 2018;2(17):2187–98. doi:10.1182/bloodadvances.2018019166.
- Hubbard WB, Banerjee M, Vekaria H, Prakhya KS, Joshi S, Wang QJ, Saatman KE, Whiteheart SW, Sullivan PG. Differential leukocyte and platelet profiles in distinct models of traumatic brain injury. Cells. 2021;10(3):500. doi:10.3390/cells10030500.
- George MJ, Bynum J, Nair P, Cap AP, Wade CE, Cox CS Jr, Gill BS. Platelet biomechanics, platelet bioenergetics, and applications to clinical practice and translational research. Platelets. 2018;29(5):431–9. doi:10.1080/09537104.2018.1453062.
- Ravi S, Chacko B, Sawada H, Kramer PA, Johnson MS, Benavides GA, O’Donnell V, Marques MB, Darley-Usmar VM, Tan M. Metabolic plasticity in resting and thrombin activated platelets. PLos One. 2015;10(4):e0123597. doi:10.1371/journal.pone.0123597.
- Sake CL, Metcalf AJ, Meagher M, Di Paola J, Neeves KB, Boyle NR. Isotopically nonstationary 13C metabolic flux analysis in resting and activated human platelets. Metab Eng. 2022;69:313–22. doi:10.1016/j.ymben.2021.12.007.
- Detwiler TC, Zivkovic RV. Control of energy metabolism in platelets. A comparison of aerobic and anaerobic metabolism in washed rat platelets. Biochim Biophys Acta Bioenerg. 1970;197(2):117–26. doi:10.1016/0005-2728(70)90022-8.
- TeSlaa T, Bartman CR, Jankowski CSR, Zhang Z, Xu X, Xing X, Wang L, Lu W, Hui S, Rabinowitz JD. The source of glycolytic intermediates in mammalian tissues. Cell Metab. 2021;33(2):367–78.e5. doi:10.1016/j.cmet.2020.12.020.
- Szymańska E, Jóźwiak-Dzięcielewska DA, Gronek J, Niewczas M, Czarny W, Rokicki D, Gronek P. Hepatic glycogen storage diseases: pathogenesis, clinical symptoms and therapeutic management. Arch Med Sci. 2019;17(2):304–13. doi:10.5114/aoms.2019.83063.
- Bhattacharya K. Investigation and management of the hepatic glycogen storage diseases. Transl Pediatr. 2015;4(3):240–8. doi:10.3978/j.issn.2224-4336.2015.04.07.