
Abstract
Arterial tonometry and vascular calcification measures are useful in cardiovascular disease (CVD) risk assessment. Prior studies found associations between tonometry measures, arterial calcium, and CVD risk. Activated platelets release angiopoietin-1 and other factors, which may connect vascular structure and platelet function. We analyzed arterial tonometry, platelet function, aortic, thoracic and coronary calcium, and thoracic and abdominal aorta diameters measured in the Framingham Heart Study Gen3/NOS/OMNI-2 cohorts (n = 3,429, 53.7% women, mean age 54.4 years ±9.3). Platelet reactivity in whole blood or platelet-rich plasma was assessed using 5 assays and 7 agonists. We analyzed linear mixed effects models with platelet reactivity phenotypes as outcomes, adjusting for CVD risk factors and family structure. Higher arterial calcium trended with higher platelet reactivity, whereas larger aortic diameters trended with lower platelet reactivity. Characteristic impedance (Zc) and central pulse pressure positively trended with various platelet traits, while pulse wave velocity and Zc negatively trended with collagen, ADP, and epinephrine traits. All results did not pass a stringent multiple test correction threshold (p < 2.22e-04). The diameter trends were consistent with lower shear environments invoking less platelet reactivity. The vessel calcium trends were consistent with subclinical atherosclerosis and platelet activation being inter-related.
Plain lanugage summary
What is the context?
Prior research has reported that measures of vascular system-influencing proteins such as angiopoietin-2, arterial calcium plaque formation, and arterial stiffness assessed by tonometry are associated with CVD risk.
Since activated platelets produce and release vascular proteins like angiopoietin when activated, and microparticles that interact with endothelium, release of the foregoing mediators could provide one way in which vascular structure and platelet function influence each other.
To our knowledge, no prior studies have directly investigated associations between these measures in a large sample. This investigation relates platelet function to arterial tonometry, aortic and arterial diameter, and arterial calcium measures in the Framingham Heart Study (FHS) Gen3/NOS/OMNI-2 cohorts (n = 3,429).
What’s new?
Generally, higher arterial calcium measures trended with higher platelet reactivity, whereas larger aortic diameters trended with lower platelet reactivity.
Arterial tonometry measures had positive and negative trends with platelet functions, including platelet measures with opposite relations to negative-inverse carotid-femoral pulse wave velocity (niCFPWV) and characteristic impedance (Zc). All tonometry, calcium, and diameter results did not reach a more stringent multiple testing threshold (p < 2.22e-04).
What’s the impact?
The aortic diameter trends are consistent with lower shear stress invoking less platelet reactivity.
The vessel calcium trends are consistent with increased vascular calcium buildup that could provoke platelet activation, thereby contributing to increased blood clot risk. Conversely, increased platelet activation could contribute to increased inflammation and thrombosis, leading to calcification in the arterial wall.
Introduction
Platelet reactivity measures can be useful in cardiovascular disease (CVD) risk determination. For example, Berger et al. found that adenosine diphosphate (ADP) and trimethylamine N-oxide-induced platelet reactivity were significant independent predictors of cardiovascular and all-cause mortality in the LUdwigshafen RIsk and Cardiovascular Health (LURIC) Study.Citation1 Measures such as increased platelet count, volume, and reactivity have been correlated with increased risk for acute myocardial infarction and poor cardiovascular outcomes.Citation1–4 Platelets have been shown to release angiopoietin-1, endothelial, and transforming growth factors, which decrease endothelial permeability to plasma under normal circumstances.Citation5,Citation6 In cases of endothelial barrier breaks and impairments, the exposed collagen layer that normally lies beneath the endothelium promotes platelet binding to the injury site, allowing clots to form.Citation7 When this occurs, platelets can release endothelial cell adhesion molecules, such as P-selectin and recruit leukocytes, facilitating the inflammatory response.Citation8,Citation9 In addition, von Willebrand factor (vWF) generated from platelet alpha-granules and endothelial cells helps initiate platelet–platelet adhesion and binding to sites of injury along the vascular wall, aiding in thrombus formation.Citation10 Under shear stress conditions, platelets can release microparticles with various pro-coagulant factors, including exposure of phosphatidylserine and glycoproteins (GPs) like GPIIb/IIIa and GPIb/IX.Citation11–13 Hence, platelets have an important influence on hemostasis and vascular function under a variety of conditions in the human body.
One way to measure arterial function is through tonometry methods such as carotid-femoral pulse wave velocity (CFPWV), which is a measure of aortic wall stiffness.Citation14,Citation15 In conjunction with computed tomography (CT) scans for coronary artery calcium (CAC),Citation16 endothelial function and tonometry data may aid in CVD risk determination.Citation17–19 In one study, Zachariah et al. found positive associations between serum vascular endothelial growth factors like angiopoietin-2, CFPWV, and mean arterial pressure, as well as negative associations between insulin-like growth factor 1 concentrations, CFPWV, and mean arterial pressure.Citation20 This community-based cross-sectional study indicated that vascular growth factor levels were related to measures of mean and pulsatile hemodynamic load.Citation20
Few studies have effectively assessed the associations between platelet activation markers, arterial calcium, vessel diameter, and tonometry measures. Other researchers have primarily analyzed data gathered from high-resolution ultrasound and peripheral artery tonometry to measure vascular functioning, all while not factoring in direct measures of platelet function or arterial bed calcium burden measurements.Citation21,Citation22 Studies that have investigated the connections between tonometry measures, either direct or indirect platelet activation markers, and cardiovascular outcomes under various medical conditions and treatment regimens tended to have sample sizes of approximately 50 or fewer individuals, which may lack statistical power and generalizability.Citation23–27 Given that various platelet,Citation1–4 tonometry,Citation14,Citation15 diameter,Citation28,Citation29 and calciumCitation16 measures were found to be independently associated with CVD outcomes, it may be possible that the latter three sets of traits have an influence on platelet reactivity, and vice versa. In this study, we sought to unify these quantitative measurement types in a single large cohort with comprehensive platelet phenotyping to address whether platelet reactivity is interrelated to other vessel and CVD-associated measures.
Here, we examine relations between platelet function, arterial tonometry, arterial calcium CT scans, and aortic and arterial diameter measures in the large, community-based Framingham Heart Study (FHS) Generation 3, New Offspring Spouse (NOS), and diverse OMNI-2 cohorts of middle-aged and older adult men and women. Due to the previous independent associations between platelet, arterial tonometry, diameter, and calcium measures, we hypothesized that higher arterial wall calcium burden and higher arterial stiffness are related to higher platelet aggregation measures, whereas higher aortic diameter measures are negatively related to platelet aggregation.
Methods and materials
Cohort information
This study included participants from the FHS Generation 3, NOS, and OMNI-2 cohorts, which have been previously described.Citation30–32 Participants return to the FHS clinic with gaps of several years to undergo examinations for various CVD risk factors and physical examinations. This research protocol was approved by the FHS and the Boston University Institutional Review Board. Informed consent was obtained from participants on the day of their examinations. Figure S1 provides timelines of when each phenotype was measured during their respective Exam periods. Platelet and tonometry measures were gathered from Gen3/NOS/OMNI-2 cohorts during Exam 3 (2016–2019), vessel calcium measures were gathered from Gen3/OMNI-2 cohorts during Exam 2 (2008–2011), and vessel diameter measures were gathered from Gen3 cohort during Exam 1 (2002–2005). Diameter and calcium data were not available for the NOS cohort, and diameter, CAC, and AAS data were not available for the OMNI-2 cohort. There were large discrepancies in the calcium trait sample sizes because ~50% of participants did not participate in the imaging call-back examination.Citation33 There were also exclusions applied for CT measures based on age (<35 years of age for men or <40 years of age for women), weight (≥160 kg), and pregnancy;Citation33 those individuals with imaging measures had higher mean BMI, diabetes rates, and medication use at the time of the platelet function exam (Exam 3). Demographic differences between those with and without vessel imaging measures are included in Table S2.
Physical examinations were used to gather CVD risk factor measures such as blood pressure, and laboratory evaluations of participant blood samples were conducted. Enzymatic methods were used to measure plasma cholesterol and triglyceride concentrations, and high-density lipoprotein cholesterol (HDL-C) was measured after using dextran sulfate-magnesium precipitation of apolipoprotein B-containing lipoproteins. Blood glucose measurements were done using a hexokinase reagent. We included all participants with available data on arterial tonometry, aortic diameter, arterial wall calcium scores, and platelet function parameters.
Blood collection
Fasting blood was collected from research participants via venipuncture of the antecubital vein in a supine position, and either platelet-rich plasma (PRP) or whole blood (WB) were used in platelet function assays. Phlebotomists used a 21 gauge safety lock blood collection system (BD Biosciences; San Jose, CA).Citation34
We used two hirudin blood tubes (3.0 mL; Diapharma; Westchester, OH) for WB assays. These tubes rested at room temperature for 30 minutes prior to platelet testing. In addition, three 4.5 mL sodium citrate (3.2%) tubes (BD; San Jose, CA) were collected for PRP assays.Citation34
Platelet-rich plasma isolation
We centrifuged the sodium citrate tubes at 200 × g for 10 minutes with no brake to isolate PRP (Sorvall ST8 centrifuge, Thermo Sci 75 003 181 rotor), and 1500 × g for 15 minutes with no brake to isolate platelet-poor plasma. Sodium citrate tubes were rested at room temperature for 15 minutes before centrifugation. These preparations were made in accordance with the International Society on Thrombosis and Hemostasis guidelines.Citation34
Platelet reactivity measurements
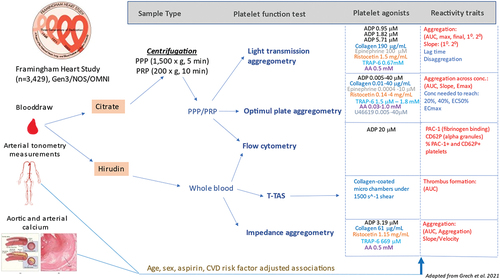
We utilized a variety of assays to measure different platelet reactivity traits in both WB and PRP samples when exposed to different agonists. These measurements were recently described in detail.Citation34 They are summarized below, and a more detailed list of assay components and platelet agonist concentrations is found in . Agonists used for these platelet reactivity assays were acquired in large lots from Bio/Data (Horsham, PA) and Roche Diagnostics (Mannheim, Germany) to reduce batch variability. Assay platform details, platelet reactivity variable definitions, and agonist concentrations are summarized in Table S1.
Figure 1. Overview of study design (adapted from Grech et al. 2021).
Whole blood impedance aggregometry
We utilized a 5-channel Multiplate analyzer (Roche Diagnostics; Mannheim, Germany) to collect whole blood impedance aggregometry traits, including area-under-the-curve (AUC), velocity, and aggregation for each agonist. The platelet agonists used for this assay were 0.22 mM thrombin receptor activator peptide-6 (TRAP-6), 3.19 µM ADP, 1.15 mg/mL ristocetin, 0.5 mM arachidonic acid (AA), and 61 µg/mL collagen.
Shear-stress mediated platelet thrombus formation
We used the Total-Thrombus Formation Assay System (T-TAS) Plus (Zacros; Tokyo, Japan) to assess shear stress-mediated platelet occlusion from whole blood samples when exposed to collagen. Measurements were made under the “PL chip” and “mid-shear” 1500 1/s settings. T-TAS AUC was analyzed as a platelet trait.
Light transmission aggregometry (LTA)
We used an eight-channel PAP-8E light transmission aggregometer (Bio/Data; Horsham, PA, USA) to collect aggregation measures from PRP. Measurements were made in accordance with the International Society on Thrombosis and Hemostasis guidelines.Citation35 The agonists used were 0.95 µM, 1.82 µM, and 5.71 µM ADP, 190 µg/mL collagen, 1.6 mM AA, 100 µM epinephrine, 0.67 mM TRAP-6, and 1.5 mg/mL ristocetin. AUC, percent final aggregation, percent maximal aggregation, primary aggregation, and primary slope were collected for each agonist. Lag time for AA and collagen, secondary aggregation and secondary slope for ADP, and epinephrine, and disaggregation to ADP and ristocetin were also calculated. The AUC provided by the instrument corresponds to the sum of the average aggregation percentage measured each second, divided by 60 seconds. This method could induce bias if samples were not processed for the same duration, resulting in potentially inaccurate comparisons between samples. To address this, we recomputed the AUC from the aggregation percentages, rescaled between 0 and 1, and divided the result by the total duration of the assay after agonist injection, in seconds (in most cases 360 seconds). This resulted in a standardized AUC with values ranging from 0 to 1.
Optimul 96-well plate assay
We used the Optimul 96-well plate assay to assess platelet reactivity to varying concentrations of the following platelet agonists: 0.03–1.0 mM AA, 0.005–40 µM ADP, 0.01–40 µg/mL collagen, 0.0004–10 µM epinephrine, 0.14–4.0 mg/mL ristocetin, 1.5 µM–1.8 mM TRAP-6, and 0.005–40 µM U46619.Citation34,Citation36 The plates used for the assay were made by members of our research group in Framingham, MA, USA. Optimul AUC mean, ec50, eMax, concentration to reach 20% (Agg20) and 40% aggregation (Agg40), ecMax, and slope were collected for each agonist. These calculations were done using the NPLR package.Citation37
Flow cytometry data preparation, cleaning, and analysis
Flow cytometry data was acquired using the BD Accuri C6 instrument, and the BD Accuri analysis software (BD Biosciences; San Jose, CA, USA) was used for gating and export of data for analysis by linear mixed effects models in R. Flow cytometry traits, all of which measured in both PRP and WB, include percent positive PAC-1 and P-selectin platelets; and normal saline estimated platelet count. We prepared a 1:40 dilution of both PRP and WB by adding 10 µL of PRP and WB, respectively, to 390 µL of phosphate buffered solution. 45 µL of each dilution mix was added to 5 µL of normal saline and 5 µL of 200 µM ADP, respectively, and incubated at 37°C for 15 minutes. Following incubation, 50 µL of antibody cocktail containing 1:20 anti-CD61 antibody (PerCP-Cy5.5 Mouse Anti-Human CD61 Clone VI-PL2), 1:5 anti-CD62P antibody (APC Mouse Anti-Human CD62P; Clone AK-4), and 1:5 anti-PAC-1 antibody (FITC Mouse Anti-Human PAC-1; Clone PAC-1) was added to each tube and incubated at 37°C for 15 minutes. Finally, 1150 µL of staining mix containing three parts stain buffer and one part cytofix solution (BD Biosciences; San Jose, CA, USA) was added to complete the sample preparations.
Each sample was run on a “slow” flow-rate and a primary stop condition set at “10,000 CD61+ events.” Gates were drawn based on experiments with different antibody combination and stimulated or unstimulated conditions, and were cross-checked across random samples throughout every month of the exam period and fine-tuned before developing a final analysis template. To minimize the impact of abnormal events during data acquisition and to exclude events affected by technical artifacts, we performed quality control on all compensated Flow Cytometric Standard (fcs) files using the Flow AI package (version 1.12.7) on FlowJo (version 10.7.1).Citation38 The FlowAI package allows for the screening, selection, and exclusion of bad-quality events, based on the evaluation of flow rate abnormalities, parameter instability and omission of fluorescence signals or events that fall out of the specific dynamic range of each fluorescence channel.Citation38
Arterial tonometry and diameter measurements
Participants underwent applanation tonometry in a supine position after 5 minutes of rest as described previously.Citation39,Citation40 Systolic and diastolic blood pressure measures were taken in the right arm using a semiautomated auscultatory method (Cardiovascular Engineering Inc, Norwood, MA).Citation40 A caliper was used to measure the distance from the suprasternal notch to the femoral site and a tape measure to measure from the suprasternal notch to other sites.Citation40
Carotid-femoral pulse wave velocity (CFPWV) was calculated by dividing the carotid-femoral transit distance by the pulse transit time difference between carotid and femoral sites. The difference between transit distances from the suprasternal notch to femoral and carotid sites was used to account for parallel transmission in the brachiocephalic artery and the aortic arch. Raw CFPWV was inverted (1/CFPWV) to limit heteroscedasticity and skewness, then multiplied by −1000 to convert units to ms/m and restore directionality of relations, yielding niCFPWV. Higher values of niCFPWV correspond to higher aortic stiffness.Citation40 Central pulse pressure (CPP) was calculated as the difference between carotid systolic and diastolic pressure. Characteristic impedance (Zc), the impedance to pulsatile flow during systole, was calculated in the time domain by dividing the change in pressure by the change in flow in the interval between the flow onset and 95% of peak flow.Citation41
The three diameter variables were as follows: ascending aorta (AAo), descending thoracic aorta (DAo), and abdominal aorta (below renal arteries; AbAo). Each diameter variable was the average of orthogonal anteroposterior and mediolateral diameters measured at each respective position.
Primary stiffness measurements included niCFPWV. Secondary stiffness measurements included Zc and central pulse pressure (CPP).
CT imaging
The cardiac CT examination methods have been previously described.Citation33 In summary, CT exams were performed with an eight-slice MDCT scanner (LightSpeed Ultra, General Electric, Milwaukee, WI).Citation33
Image segmentation and traditional Agatston score
Coronary artery scans were segmented into eight segments, and experienced readers labeled all CT scans for both the presence and amount of CAC using open-source software (3DSlicer, v.4.7.0). Agatston scores were multiplied by the area of each lesion along with a weighted attenuation score dependent on the maximal attenuation within the lesion to define the CAC amount.Citation33,Citation42
The following scores were calculated: coronary artery calcium (CAC), abdominal aorta calcium (AAS), and thoracic aorta calcium (TAC; average of ascending and descending thoracic aorta diameters). The scores were then dichotomized, such that positive scores had value of 1, due to many 0 values in the three scores (>54%).
Statistical analyses
Baseline characteristics are shown in . In brief, CVD risk factors, clinical, and demographic information were gathered from individuals in the NOS, Gen3, and OMNI-2 cohorts at Exam 3. Data gathered from a total of 3,429 participants who minimally had platelet function at Exam 3 and tonometry, vessel calcium, or vessel diameter data were included in this study. Overall, the 3,429 FHS participants had a mean age of 54.4 ± 9.3 years, 53.7% were women, and overall had moderate burden of cardiovascular risk factors. The population had moderate prescription rates for anti-lipid treatment (25.2%), anti-hypertensive treatment (28.1%), and based on sensitive AA LTA platelet function assays, 21.3% of individuals had taken recent aspirin and 0.95% of individuals reported taking P2Y12 inhibitors. Platelet and tonometry data were available for all participants included in this study from Exam 3. Demographics of the group with these phenotypes are shown in .
Table I. Demographic information.
We applied inverse normal transformation to platelet aggregation traits. We then conducted an association analysis between the transformed platelet outcomes and tonometry/calcium/diameter traits using a linear mixed effects model implemented in the R package GMMAT (https://cran.r-project.org/web/packages/GMMAT/index.html) to account for familial correlation. We adjusted for common cardiovascular risk factors, which included height, weight, body mass index, heart rate, fasting plasma total cholesterol, and high-density lipoprotein cholesterol (HDL-C) modeled as the ratio of total to HDL-C, triglycerides (TG), glucose, self-report of smoking within the past year, prevalent diabetes or CVD, and treatment for hypertension or hyperlipidemia. As previously described, independent trait analysis suggests correction for 45 platelet traits.Citation34 Here as five principal components explained 90% of trait variation among tonometry, diameter, and calcium traits, we considered p < .05/(45 × 5) = 2.22e-04 to be statistically significant in analyses. We describe results with p < .05 in a two-sided test as “trends.” Following the analyses, Z-scores were calculated from beta (β) and standard error values (β/SE). To accurately represent the directionality of the associations with regard to increased platelet reactivity, the β and Z-statistics presented in , , and Tables S3-S5 for following variables were transformed by multiplying a factor of −1: Agg20, Agg40, ecMax, EC50, disaggregation traits (4 total), and lag time traits (2 total). Results from the cardiovascular risk factor-adjusted model are shown in . Results from the age-, sex-, and aspirin use-adjusted model are shown in Tables S3-S5. The independent variables were arterial tonometry, aortic and arterial diameter, and aortic and arterial calcium, while the dependent variables were platelet function measures.
Figure 2. Heatmap of Z statistics associating platelet activation, arterial calcium, tonometry, and diameter measures.
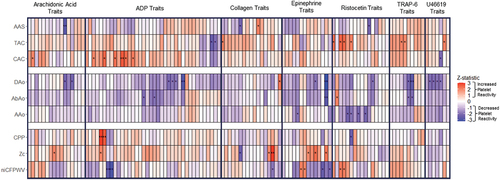
Table II. Aortic and arterial calcium results (risk factor-adjusted model).
Table IV. Arterial tonometry analysis results (risk factor-adjusted model).
Results
The top results from our analysis are shown in . To summarize, all calcium, diameter, and tonometry traits failed to reach a stringent multiple test correction significance threshold (p < 2.22e-04). However, numerous traits across all three categories had p-values <0.05. In order to better visualize the results by agonist tests and traits, we created ; this is a heatmap of the z-statistics of associations between calcium, diameter, tonometry, and platelet activation measures, grouped by independent variable type with p-value trends marked (*p ≤ .05, **p ≤ .01). This plot emphasizes trends between individual platelet activation traits and calcium, diameter, and tonometry traits.
Arterial calcium and platelet reactivity
Generally, arterial calcium measures showed positive trends with platelet reactivity traits as shown by the greater number of red boxes for calcium traits in . The most significant trends were between abdominal aorta calcium scores (AAS) and AA platelet reactivity in Optimul and collagen platelet reactivity in LTA, and ristocetin-induced platelet agglutination in Optimul (p = 4.8e-03–0.04) [, ]. The trends mostly reflected higher abdominal calcium being associated with lower platelet reactivity, except for collagen in the Optimul assay. TAC trended with increased platelet reactivity for TRAP-6 in LTA, U46619 in Optimul, as well as increased ristocetin-induced platelet agglutination in LTA (p = .01–0.05) [, ]. WB ADP reactivity results by flow cytometry trended in a counter direction with TAC (p = .01–0.04). For CAC, there were trends with 1.82 µM ADP in LTA (p = 7.5e-03–0.04) [, ]. 0.95 µM ADP in LTA showed similar trends of increased reactivity with higher CAC (p = .01–0.04). In addition, higher CAC trended with lower U46619-induced platelet reactivity (p = .03) and higher AA-induced reactivity in LTA (p = .04).
Aortic and arterial diameter measures
The majority of aortic and arterial diameter measures had negative trends with platelet reactivity traits as shown by the greater number of blue boxes for diameter traits in . Abdominal aorta and ascending, descending thoracic aorta diameters had the most significant negative trends with various epinephrine, ADP, and U46619-induced aggregation, T-TAS collagen-induced thrombus formation, and ristocetin-induced platelet agglutination in LTA and Optimul (p = 1.1e-03–0.05) [, ].
Table III. Vessel diameter results (risk factor-adjusted model).
Arterial tonometry measures and platelet reactivity
There was a combination of positive and negative trends between various tonometry and platelet reactivity traits as shown by the combination of red and blue boxes for tonometry traits in . There were positive trends between Zc and Multiplate collagen AUC, LTA collagen primary slope, as well as various AA and epinephrine-induced aggregation traits (p = 2.6e-03–0.0498). There was a negative trend between Zc and collagen primary slope (p = .01) [, ].
In addition, there were negative trends between niCFPWV, 0.95 µM ADP secondary aggregation and secondary slope in LTA and epinephrine ecMax and slope (p = 2.4e-03–7.4e-03; p = .01–0.03, respectively). There were positive trends between CPP and 0.95 µM ADP primary aggregation and primary slope in LTA (p = 2.8e-03–8.5e-03) [, ].
Discussion
We observed a pattern of negative trends for larger measured mean blood vessel diameters with lower platelet activation. Ascending, descending thoracic aorta, and abdominal aorta measures had the most significant trends with ADP in Optimul, epinephrine in Optimul, and shear-mediated collagen-induced thrombus formation, among other platelet reactivity variables. Arterial calcium measures mostly displayed positive trends with platelet reactivity, with AAS having the most significant trends with AA reactivity in LTA, collagen-induced platelet reactivity in LTA, and ristocetin-induced platelet agglutination in Optimul. CAC and response to 1.82 µM ADP in LTA; and TAC, TRAP-6 platelet reactivity in LTA, and U46619-induced platelet reactivity in Optimul also showed positive trends. WB ADP reactivity measured by flow cytometry showed a negative trend with TAC. For the arterial tonometry measures, Zc, and CPP trended positively with multiplate collagen, Optimul epinephrine, LTA ADP, and other platelet reactivity traits. niCFPWV and Zc trended negatively with ADP, collagen, and epinephrine measures.
The vessel diameter results are consistent with the concept of a lower shear stress environment that may provide a milieu of decreased platelet reactivity. Prior research has shown that platelet activation can be provoked by shear forces and potentiated by higher shear stress. For instance, the shear-mediated interaction between GPIbα on the surface of platelets and vWF on the exposed subendothelial extracellular matrix that is exposed at sites of vascular injury initiates a signaling cascade that results in platelet adhesion, activation, and thrombus formation.Citation43–45 In addition to yield stress and the other non-Newtonian rheological behaviors of blood, this action can promote thrombosis and pathological blockages seen in CVDs such as strokes.Citation46
Second, the pattern of our nominally associated calcium results is consistent with other evidence suggesting that subclinical atherosclerosis and calcium buildup may provoke platelet activation through various pathways, contributing to higher thrombosis risk. For example, Chirumamilla et al. studied patients who were undergoing percutaneous coronary intervention and were receiving clopidogrel therapy; high on-treatment platelet reactivity was associated with longer atherosclerotic lesions with greater volumetric dimensions.Citation47 Various mechanisms have been proposed to explain the relationship between atherosclerotic burden and platelet reactivity, such as platelet activating factor (PAF) activating platelets and leukocytes, enhancing leukocyte adhesion to the vessel wall, and by extension, plaque formation.Citation48,Citation49 Also, Marx et al. illustrated that eosinophils support atherosclerotic plaque formation by facilitating endothelial cell vWF exposure, which promoted greater platelet adhesion.Citation50 Furthermore, it is known that atherosclerotic plaque rupture results in the exposure of the procoagulant subendothelial matrix, which can promote platelet and leukocyte recruitment and activation, leading to pathogenic arterial thrombosis.Citation51 Prior work in the FHS showed that ADP platelet hyperreactivity was associated with future CVD after accounting for traditional CVD risk factors.Citation4 Likewise, Berger et al.’s study in the LURIC cohort indicated higher ADP platelet reactivity may be an independent predictor of future CVD mortality.Citation1 The observed positive trends between higher concentration (1.82 µM) ADP platelet activation and coronary artery calcium levels suggests a connection between atherosclerotic burden and ADP platelet activation pathways, and is consistent with platelet P2Y12 inhibitor therapy in CVD prevention.
It is known that activated platelets and endothelial cells recruit other immune cells, such as monocytes and neutrophils, promoting thrombus stabilization by delivering tissue factor and neutrophil extracellular trap formation.Citation52,Citation53 Increased calcium area and volume are associated with increased atherosclerotic plaque area and volume,Citation16,Citation54 and calcified plaque is also a well-established marker for adverse cardiovascular events and atherosclerotic progression since it is strongly associated with total plaque burden.Citation54 Furthermore, a high CAC burden has been associated with atrial fibrillation, extra coronary atherosclerosis, increased risk of cerebrovascular events, and an unfavorable CVD risk profile.Citation55–57 Our results both reinforce these previous findings and point to a relationship between increased vessel calcium burden, platelet activation, and higher thrombotic and atherosclerotic risk that should be investigated further. However, these results do not establish a causal direction for such trends.
The tonometry results are consistent with a possible diameter-mediated effect on Zc and niCFPWV, even though the link with platelet activation did not reach a stringent multiple testing significance threshold. It is known that increased arterial stiffness, measured by pulse wave velocity, is an independent risk factor of atherosclerotic CVD,Citation58 and in atherosclerotic disease patients, platelets are likely to be activated.Citation59 In addition, Zc and CFPWV were found to be correlated to each other (p < 10−4) with confounders, and both were independently associated with carotid intima-media thickness and endothelial activation markers.Citation60 Both carotid intima-media thickness and carotid artery measures appear to be correlated with one another, and both have been used as predictors of cardiovascular events in large population studies.Citation28,Citation61 From this, there may be a mechanistic relationship between arterial tonometry measures and platelet activation measures that should be elucidated through further research using larger tonometry measure samples gathered from diverse cohorts.
One limitation of this study was the limited amount of tonometry and platelet function data available from the older age NOS and the ethnically diverse OMNI-2 cohort. This may affect the generalizability of the results to the U.S. population, and is a problem shared with most other population studies of platelet function, indicating an important issue to address in future studies. A second potential limitation is the inability to replicate these findings in other cohorts, as there have been few population studies that have gathered platelet function, arterial tonometry, and vascular function data to the extent of FHS. However, this reflects the novelty of our study because, to our knowledge, there have been very few age-, ethnically-and-racially-diverse community-based studies to date that have gathered data on and assessed associations between platelet function, tonometry, arterial and aortic diameter, and arterial calcium measures to the extent of FHS. Most other cardiovascular epidemiological studies have either occurred over shorter periods, have not assessed one of the four aforementioned measures, or have had smaller sample sizes compared to FHS.Citation62–65 A third potential limitation is the time between the aortic and arterial diameter and calcium measures. Since approximately 14 years elapsed between Exams 1 and 3, the time gap could bias the results toward a null association if no or weak relations are observed between variables. Conversely, true associations may be stronger if measured concurrently. However, prior cross-sectional studies of different vessel anatomy and scanning techniques from young adulthood to later age in thousands of individualsCitation66–68 have all suggested that there is a fairly linear increase in vessel diameters throughout these decades across men, women and ancestry groups. Additionally, vessel calcium measures are thought to change slowly in most adults. Previous cross-sectional studies using various scanning techniques and measuring different vessel calcium variables in thousands of individual across a large range of agesCitation69,Citation70 indicate that vessel calcium burden likely shows relatively steady increases throughout adulthood until advanced age, where there may be a more rapid acceleration of calcium burden. Since the time periods covered in our subjects are from early-middle age to later-middle age, we believe the cohort generally would have been in a phase of linear growth in these measurements. Furthermore, after adjusting for the number of years between imaging and platelet function measurements, the trends did not change appreciably and showed high concordance of effect (calcium traits r = 0.999, diameter traits r = 0.919). A fourth limitation is that all the results did not meet a more stringent multiple testing threshold (p < 2.22e-04) and only had suggestive trends (p < .05). Unfortunately, since there are no cohort studies that have gathered similar amounts of tonometry, platelet activation, and calcium measures as FHS; we cannot replicate these results to see if there are more significant relationships. However, our results are consistent with prior research on individual associations between these various measures. A final limitation is that due to the association-based analyses that form the basis of this study, we cannot determine the causal direction for the observed relationships. In the future, it could be worthwhile to apply causal inference methods like Mendelian randomization to genetic data, as there are increasingly well-powered studies for vessel diameters,Citation29 calcium,Citation71,Citation72 tonometry and vessel stiffness measures,Citation73–75 platelet activation,Citation76,Citation77 and CVD outcomes with regard to known risk factors.Citation78–80
To date, this is the largest community-based cohort study to examine the relationships between platelet function, arterial tonometry, aortic and arterial diameter, and calcium arterial bed burden measures. Our exploratory findings should inform further work designed to evaluate various associations between the same or other tonometry and platelet activation measures. More direct measures of endothelial and microvascular function were not assessed in this study. In a prior study, flow-mediated dilation (FMD) was found to be reduced in a sample of 28 unprovoked venous thromboembolism (VTE) patients when compared to non-VTE referents, as well as increased levels of vWF and soluble P-selectin in plasma, both of which are platelet and endothelial activation markers.Citation81 In another study that focused on lone atrial fibrillation parameters, FMD, and diameter measures, FMD was found to be significantly reduced and the lone atrial fibrillation and diameter measures were slightly increased in a sample of 43 lone atrial fibrillation patients.Citation82 From both studies, it is clear that significantly hindered vessel function measures are associated with cardiovascular outcomes. Future investigation using additional data being collected in FHS on tonometry, endothelial and microvascular and platelet activation datasets could yield more insight into the connection between those variables and cardiovascular outcomes.
Abbreviations
| AA | = | arachidonic acid |
| AAo | = | antero-posterior diameter of the ascending thoracic aorta obtained at the level of the right pulmonary artery |
| AbAo | = | antero-posterior diameter of the abdominal aorta 5 cm above the aorto-common iliac bifurcation |
| AAS | = | abdominal aorta calcium score |
| ADP | = | adenosine diphosphate |
| Agg20 | = | agonist concentration needed to reach 20% aggregation |
| Agg40 | = | agonist concentration needed to reach 40% aggregation |
| AUC | = | area-under-the-curve |
| aucMean | = | AUC across concentration range |
| BMI | = | body mass index |
| CAC | = | coronary artery calcium score |
| CT | = | computed tomography |
| CPP | = | central pulse pressure |
| CVD | = | cardiovascular disease |
| DAo | = | Antero-posterior diameter of the descending thoracic aorta obtained at the level of the right pulmonary artery |
| ecMax | = | agonist concentration needed to reach maximal aggregation |
| eMax | = | maximal % aggregation (Optimul) |
| EC50 | = | agonist concentration needed to reach 50% aggregation |
| FHS | = | Framingham Heart Study |
| FinAgg | = | final % aggregation |
| FMD | = | flow-mediated dilation |
| GP | = | glycoprotein |
| HDL-C | = | high-density lipoprotein cholesterol |
| LTA | = | light transmission aggregometry assay |
| LURIC | = | LUdwigshafen RIsk and Cardiovascular Health Study |
| n/a | = | information not available |
| niCFPWV | = | negative inverse carotid femoral pulse wave velocity |
| NOS | = | New Offspring Spouse |
| NSAID | = | non-steroidal anti-inflammatory drug |
| MaxAgg | = | maximal % aggregation |
| PAC1_Psel_DoublePos% | = | Percent PAC1+ and CD62P+ positive platelets |
| PAC1% | = | Percent PAC1+ positive platelets |
| PrimSlope | = | primary wave slope |
| PRP | = | platelet-rich plasma |
| SecAgg | = | secondary wave % aggregation |
| SecSlp | = | secondary wave slope |
| Slope | = | slope across concentration range (Optimul) |
| TAC | = | thoracic aortic calcium score |
| TG | = | triglycerides |
| T-TAS | = | total-thrombus formation assay system |
| TRAP-6 | = | thrombin receptor activator peptide-6 |
| vWF | = | von Willebrand Factor |
| VTE | = | venous thromboembolism |
| WB | = | whole blood |
| Zc | = | characteristic impedance of the aorta |
Author contributions
JAC wrote the initial draft of the manuscript. JAC, MVC, BBN, FT, AL, REP, MHC and ADJ contributed to platelet data cleaning/QC and analysis approaches. AL and ADJ collected platelet data in the lab. RSV, EJB, NMH and GFM contributed to funding, data collection and analysis approach of vessel calcium, diameter and tonometry measurements. JR contributed statistical support for those traits. MHC conducted all statistical analyses. ADJ provided funding for platelet measurements. All authors critically revised the manuscript.
Disclaimer
The views expressed in this manuscript are those of the authors and do not necessarily represent the views of the National Heart, Lung, and Blood Institute; the National Institutes of Health; or the US Department of Health and Human Services.
Supplemental Material
Download TIFF Image (111.3 KB)Supplemental Material
Download MS Excel (127.4 KB)Supplemental Material
Download TIFF Image (41.2 KB)Acknowledgments
We thank Paul C. Armstrong and Tim D. Warner from the Blizard Institute for their help with assay design and setup.
Disclosure statement
Dr. Mitchell is the owner of Cardiovascular Engineering, Inc., a company that develops and manufactures devices to measure vascular stiffness. The other authors report no conflicts.
Data availability statement
Framingham Heart Study variables are deposited in the NIH dbGaP repository under the accession # phs000007.v32.p13 and available for application to access by qualified researchers https://www.ncbi.nlm.nih.gov/gap/.
Supplementary data
Supplemental data for this article can be accessed online at https://doi.org/10.1080/09537104.2023.2238835.
Additional information
Funding
References
- Berger M, Kleber ME, Delgado GE, Marz W, Andreas M, Hellstern P, Marx N, Schuett KA. Trimethylamine N-Oxide and adenosine diphosphate-induced platelet reactivity are independent risk factors for cardiovascular and all-cause mortality. Circ Res. 2020;126(5):660–13. doi:10.1161/CIRCRESAHA.119.316214.
- Klovaite J, Benn M, Yazdanyar S, Nordestgaard BG. High platelet volume and increased risk of myocardial infarction: 39,531 participants from the general population. J Thromb Haemost. 2011;9(1):49–56. doi:10.1111/j.1538-7836.2010.04110.x.
- Ly HQ, Kirtane AJ, Murphy SA, Buros J, Cannon CP, Braunwald E, Gibson CM, Group TS. Association of platelet counts on presentation and clinical outcomes in ST-elevation myocardial infarction (from the TIMI trials). Am J Cardiol. 2006;98(1):1–5. doi:10.1016/j.amjcard.2006.01.046.
- Puurunen MK, Hwang SJ, Larson MG, Vasan RS, O’Donnell CJ, Tofler G, Johnson AD. ADP platelet hyperreactivity predicts cardiovascular disease in the FHS (Framingham heart study). J Am Heart Assoc. 2018;7(5). doi:10.1161/JAHA.118.008522.
- Amable PR, Carias RB, Teixeira MV, da Cruz Pacheco I, Correa Do Amaral RJ, Granjeiro JM, Borojevic R. Platelet-rich plasma preparation for regenerative medicine: optimization and quantification of cytokines and growth factors. Stem Cell Res Ther. 2013;4(3):67. doi:10.1186/scrt218.
- Thurston G, Rudge JS, Ioffe E, Zhou H, Ross L, Croll SD, Glazer N, Holash J, McDonald DM, Yancopoulos GD. Angiopoietin-1 protects the adult vasculature against plasma leakage. Nat Med. 2000;6(4):460–3. doi:10.1038/74725.
- Ho-Tin-Noe B, Demers M, Wagner DD. How platelets safeguard vascular integrity. J Thromb Haemost. 2011;9(Suppl 1):56–65. doi:10.1111/j.1538-7836.2011.04317.x.
- Rodrigues SF, Granger DN. Blood cells and endothelial barrier function. Tissue Barriers. 2015;3(1–2):e978720. doi:10.4161/21688370.2014.978720.
- Stokes KY, Granger DN. Platelets: a critical link between inflammation and microvascular dysfunction. J Physiol. 2012;590(5):1023–34. doi:10.1113/jphysiol.2011.225417.
- Reininger AJ. VWF attributes–impact on thrombus formation. Thromb Res. 2008;122(Suppl 4):S9–13. doi:10.1016/S0049-3848(08)70028-8.
- Miyazaki Y, Nomura S, Miyake T, Kagawa H, Kitada C, Taniguchi H, Komiyama Y, Fujimura Y, Ikeda Y, Fukuhara S. High shear stress can initiate both platelet aggregation and shedding of procoagulant containing microparticles. Blood. 1996;88(9):3456–64. doi:10.1182/blood.V88.9.3456.bloodjournal8893456.
- Pushin DM, Salikhova TY, Zlobina KE, Guria GT. Platelet activation via dynamic conformational changes of von Willebrand factor under shear. PLoS One. 2020;15(6):e0234501. doi:10.1371/journal.pone.0234501.
- Nomura S. Microparticle and atherothrombotic diseases. J Atheroscler Thromb. 2016;23(1):1–9. doi:10.5551/jat.32326.
- Laurent S, Boutouyrie P, Asmar R, Gautier I, Laloux B, Guize L, Ducimetiere P, Benetos A. Aortic stiffness is an independent predictor of all-cause and cardiovascular mortality in hypertensive patients. Hypertension. 2001;37(5):1236–41. doi:10.1161/01.HYP.37.5.1236.
- Meaume S, Benetos A, Henry OF, Rudnichi A, Safar ME. Aortic pulse wave velocity predicts cardiovascular mortality in subjects >70 years of age. Arterioscler Thromb Vasc Biol. 2001;21(12):2046–50. doi:10.1161/hq1201.100226.
- Zaid M, Fujiyoshi A, Kadota A, Abbott RD, Miura K. Coronary artery calcium and carotid artery intima media thickness and plaque: clinical use in need of clarification. J Atheroscler Thromb. 2017;24(3):227–39. doi:10.5551/jat.RV16005.
- Mitchell GF, Parise H, Benjamin EJ, Larson MG, Keyes MJ, Vita JA, Vasan RS, Levy D. Changes in arterial stiffness and wave reflection with advancing age in healthy men and women: the Framingham heart study. Hypertension. 2004;43(6):1239–45. doi:10.1161/01.HYP.0000128420.01881.aa.
- Mitchell GF, Moye LA, Braunwald E, Rouleau JL, Bernstein V, Geltman EM, Flaker GC, Pfeffer MA. Sphygmomanometrically determined pulse pressure is a powerful independent predictor of recurrent events after myocardial infarction in patients with impaired left ventricular function. SAVE investigators. Survival and ventricular enlargement. Circulation. 1997;96(12):4254–60. doi:10.1161/01.CIR.96.12.4254.
- Mitchell GF, Hwang SJ, Vasan RS, Larson MG, Pencina MJ, Hamburg NM, Vita JA, Levy D, Benjamin EJ. Arterial stiffness and cardiovascular events: the Framingham heart study. Circulation. 2010;121(4):505–11. doi:10.1161/CIRCULATIONAHA.109.886655.
- Zachariah JP, Xanthakis V, Larson MG, Vita JA, Sullivan LM, Smith HM, Safa R, Peng X, Hamburg N, Levy D, et al. Circulating vascular growth factors and central hemodynamic load in the community. Hypertension. 2012;59(4):773–9. doi: 10.1161/HYPERTENSIONAHA.111.179242.
- Hamburg NM, Palmisano J, Larson MG, Sullivan LM, Lehman BT, Vasan RS, Levy D, Mitchell GF, Vita JA, Benjamin EJ. Relation of brachial and digital measures of vascular function in the community: the Framingham heart study. Hypertension. 2011;57(3):390–6. doi:10.1161/HYPERTENSIONAHA.110.160812.
- Jakubowski M, Turek-Jakubowska A, Szahidewicz-Krupska E, Gawrys K, Gawrys J, Doroszko A. Profiling the endothelial function using both peripheral artery tonometry (EndoPAT) and laser doppler flowmetry (LD) - complementary studies or waste of time? Microvasc Res. 2020;130:104008. doi:10.1016/j.mvr.2020.104008.
- Lavi S, Alemayehu M, Puka K, Wall S, Lavi R. Association between administration of ticagrelor and microvascular endothelial function. JAMA Cardiol. 2017;2(9):1042–4. doi:10.1001/jamacardio.2017.2378.
- Liberts EA, Willoughby SR, Kennedy JA, Horowitz JD. Effects of perhexiline and nitroglycerin on vascular, neutrophil and platelet function in patients with stable angina pectoris. Eur J Pharmacol. 2007;560(1):49–55. doi:10.1016/j.ejphar.2007.01.001.
- Mannaerts D, Faes E, Goovaerts I, Stoop T, Cornette J, Gyselaers W, Spaanderman M, Van Craenenbroeck EM, Jacquemyn Y. Flow-mediated dilation and peripheral arterial tonometry are disturbed in preeclampsia and reflect different aspects of endothelial function. Am J Physiol Regul Integr Comp Physiol. 2017;313(5):R518–R25. doi:10.1152/ajpregu.00514.2016.
- Rull G, Mohd-Zain ZN, Shiel J, Lundberg MH, Collier DJ, Johnston A, Warner TD, Corder R. Effects of high flavanol dark chocolate on cardiovascular function and platelet aggregation. Vascul Pharmacol. 2015;71:70–8. doi:10.1016/j.vph.2015.02.010.
- Worthley MI, Prabhu A, De Sciscio P, Schultz C, Sanders P, Willoughby SR. Detrimental effects of energy drink consumption on platelet and endothelial function. Am J Med. 2010;123(2):184–7. doi:10.1016/j.amjmed.2009.09.013.
- Eigenbrodt ML, Sukhija R, Rose KM, Tracy RE, Couper DJ, Evans GW, Bursac Z, Mehta JL. Common carotid artery wall thickness and external diameter as predictors of prevalent and incident cardiac events in a large population study. Cardiovasc Ultrasound. 2007;5:11. doi:10.1186/1476-7120-5-11.
- Portilla-Fernandez E, Klarin D, Hwang SJ, Biggs ML, Bis JC, Weiss S, Rospleszcz S, Natarajan P, Hoffmann U, Rogers IS, et al. Genetic and clinical determinants of abdominal aortic diameter: genome-wide association studies, exome array data and Mendelian randomization study. Hum Mol Genet. 2022;31(20):3566–79. doi: 10.1093/hmg/ddac051.
- Dawber TR, Meadors GF, Moore FE Jr. Epidemiological approaches to heart disease: the Framingham study. Am J Public Health Nations Health. 1951;41(3):279–81. doi:10.2105/AJPH.41.3.279.
- Splansky GL, Corey D, Yang Q, Atwood LD, Cupples LA, Benjamin EJ, D’Agostino RB Sr., Fox CS, Larson MG, Murabito JM, et al. The third generation cohort of the national heart, lung, and blood institute’s Framingham heart study: design, recruitment, and initial examination. Am J Epidemiol. 2007;165(11):1328–35. doi: 10.1093/aje/kwm021.
- Tsao CW, Vasan RS. Cohort profile: The Framingham heart study (FHS): overview of milestones in cardiovascular epidemiology. Int J Epidemiol. 2015;44(6):1800–13. doi:10.1093/ije/dyv337.
- Tsao CW, Pencina KM, Massaro JM, Benjamin EJ, Levy D, Vasan RS, Hoffmann U, O’Donnell CJ, Mitchell GF. Cross-sectional relations of arterial stiffness, pressure pulsatility, wave reflection, and arterial calcification. Arterioscler Thromb Vasc Biol. 2014;34(11):2495–500. doi:10.1161/ATVBAHA.114.303916.
- Grech J, Chan MV, Ochin C, Lachapelle A, Thibord F, Schneider Z, Nkambule BB, Armstrong PCJ, de Melendez CW, Tucker KL, et al. Serotonin-affecting antidepressant use in relation to platelet reactivity. Clin Pharma Therapeutics. 2021;111(4):909–18. doi: 10.1002/cpt.2517.
- Cattaneo M, Cerletti C, Harrison P, Hayward CP, Kenny D, Nugent D, Nurden P, Rao AK, Schmaier AH, Watson SP, et al. Recommendations for the standardization of light transmission aggregometry: a consensus of the working party from the platelet physiology subcommittee of SSC/ISTH. J Thromb Haemost. 2013;11(6):1183–9. doi: 10.1111/jth.12231.
- Chan MV, Armstrong PC, Papalia F, Kirkby NS, Warner TD. Optical multichannel (optimul) platelet aggregometry in 96-well plates as an additional method of platelet reactivity testing. Platelets. 2011;22(7):485–94. doi:10.3109/09537104.2011.592958.
- nplr: N-Parameter Logistic Regression [2016].
- Monaco G, Chen H, Poidinger M, Chen J, de Magalhaes JP, Larbi A. flowAI: automatic and interactive anomaly discerning tools for flow cytometry data. Bioinformatics. 2016;32(16):2473–80. doi:10.1093/bioinformatics/btw191.
- Mitchell GF, Guo CY, Benjamin EJ, Larson MG, Keyes MJ, Vita JA, Vasan RS, Levy D. Cross-sectional correlates of increased aortic stiffness in the community: the Framingham heart study. Circulation. 2007;115(20):2628–36. doi:10.1161/CIRCULATIONAHA.106.667733.
- Zachariah JP, Rong J, Larson MG, Hamburg NM, Benjamin EJ, Vasan RS, Mitchell GF. Metabolic predictors of change in vascular function: prospective associations from a community-based cohort. Hypertension. 2018;71(2):237–42. doi:10.1161/HYPERTENSIONAHA.117.10054.
- Mitchell GF, Wang N, Palmisano JN, Larson MG, Hamburg NM, Vita JA, Levy D, Benjamin EJ, Vasan RS. Hemodynamic correlates of blood pressure across the adult age spectrum: noninvasive evaluation in the Framingham heart study. Circulation. 2010;122(14):1379–86. doi:10.1161/CIRCULATIONAHA.109.914507.
- Agatston AS, Janowitz WR, Hildner FJ, Zusmer NR, Viamonte M Jr., Detrano R. Quantification of coronary artery calcium using ultrafast computed tomography. J Am Coll Cardiol. 1990;15(4):827–32. doi:10.1016/0735-1097(90)90282-T.
- Chen Z, Mondal NK, Zheng S, Koenig SC, Slaughter MS, Griffith BP, Wu ZJ. High shear induces platelet dysfunction leading to enhanced thrombotic propensity and diminished hemostatic capacity. Platelets. 2019;30(1):112–19. doi:10.1080/09537104.2017.1384542.
- Reininger AJ, Heijnen HF, Schumann H, Specht HM, Schramm W, Ruggeri ZM. Mechanism of platelet adhesion to von Willebrand factor and microparticle formation under high shear stress. Blood. 2006;107(9):3537–45. doi:10.1182/blood-2005-02-0618.
- McCrary JK, Nolasco LH, Hellums JD, Kroll MH, Turner NA, Moake JL. Direct demonstration of radiolabeled von Willebrand factor binding to platelet glycoprotein Ib and IIb-IIIa in the presence of shear stress. Ann Biomed Eng. 1995;23(6):787–93. doi:10.1007/BF02584477.
- Sochi T. Non-Newtonian rheology in blood circulation. arXiv: Fluid Dynamics. 2013;1–26. doi:10.48550/arXiv.1306.2067.
- Chirumamilla AP, Maehara A, Mintz GS, Mehran R, Kanwal S, Weisz G, Hassanin A, Hakim D, Guo N, Baber U, et al. High platelet reactivity on clopidogrel therapy correlates with increased coronary atherosclerosis and calcification: a volumetric intravascular ultrasound study. JACC Cardiovasc Imaging. 2012;5(5):540–9. doi: 10.1016/j.jcmg.2011.12.019.
- Tselepis AD, John Chapman M. Inflammation, bioactive lipids and atherosclerosis: potential roles of a lipoprotein-associated phospholipase A2, platelet activating factor-acetylhydrolase. Atheroscler Suppl. 2002;3(4):57–68. doi:10.1016/S1567-5688(02)00045-4.
- Zimmerman GA, Prescott SM, McIntyre TM. Platelet-activating factor and cell associated mediator of inflammation. In: Gallin J, Goldstein I, and Snyderman R, editors. Inflammation: basic principles and clinical correlates. 2nd. New York: Raven Press; 1992. p. 149–76.
- Marx C, Novotny J, Salbeck D, Zellner KR, Nicolai L, Pekayvaz K, Kilani B, Stockhausen S, Burgener N, Kupka D, et al. Eosinophil-platelet interactions promote atherosclerosis and stabilize thrombosis with eosinophil extracellular traps. Blood. 2019;134(21):1859–72. doi: 10.1182/blood.2019000518.
- Badimon L, Vilahur G. Thrombosis formation on atherosclerotic lesions and plaque rupture. J Intern Med. 2014;276(6):618–32. doi:10.1111/joim.12296.
- Martinod K, Wagner DD. Thrombosis: tangled up in NETs. Blood. 2014;123(18):2768–76. doi:10.1182/blood-2013-10-463646.
- Celi A, Pellegrini G, Lorenzet R, De Blasi A, Ready N, Furie BC, Furie B. P-selectin induces the expression of tissue factor on monocytes. Proc Natl Acad Sci U S A. 1994;91(19):8767–71. doi:10.1073/pnas.91.19.8767.
- Jin HY, Weir-McCall JR, Leipsic JA, Son JW, Sellers SL, Shao M, Blanke P, Ahmadi A, Hadamitzky M, Kim YJ, et al. The relationship between coronary calcification and the natural history of coronary artery disease. JACC Cardiovasc Imaging. 2021;14(1):233–42. doi: 10.1016/j.jcmg.2020.08.036.
- Lee SH, Lee MY, Shin SY, Lee WS, Kim SW, Park SJ, Kim JS, Sung KC. Relationship between cardiovascular calcium and atrial fibrillation. J Clin Med. 2022;11(2):371. doi:10.3390/jcm11020371.
- Tanne D, Tenenbaum A, Shemesh J, Schwammenthal Y, Fisman EZ, Schwammenthal E, Adler Y. Calcification of the thoracic aorta by spiral computed tomography among hypertensive patients: associations and risk of ischemic cerebrovascular events. Int J Cardiol. 2007;120(1):32–7. doi:10.1016/j.ijcard.2006.08.010.
- Blomberg BA, de Jong PA, Thomassen A, Lam MGE, Vach W, Olsen MH, Mali W, Narula J, Alavi A, Hoilund-Carlsen PF. Thoracic aorta calcification but not inflammation is associated with increased cardiovascular disease risk: results of the CAMONA study. Eur J Nucl Med Mol Imaging. 2017;44(2):249–58. doi:10.1007/s00259-016-3552-9.
- Amar J, Ruidavets JB, Chamontin B, Drouet L, Ferrieres J. Arterial stiffness and cardiovascular risk factors in a population-based study. J Hypertens. 2001;19(3):381–7. doi:10.1097/00004872-200103000-00005.
- Yamasaki F, Furuno T, Sato K, Zhang D, Nishinaga M, Sato T, Doi Y, Sugiura T. Association between arterial stiffness and platelet activation. J Hum Hypertens. 2005;19(7):527–33. doi:10.1038/sj.jhh.1001861.
- Motau TH, Norton GR, Mmopi KN, Bello H, Peterson VR, Libhaber C, Sadiq E, Naran R, Da Silva Fernandes D, Masiu M, et al. Relations of aortic stiffness with arterial damage beyond brachial pressure are both dependent and independent of central arterial pulsatile load. J Hypertens. 2021;39(4):718–28. doi: 10.1097/HJH.0000000000002695.
- Baldassarre D, Hamsten A, Veglia F, de Faire U, Humphries SE, Smit AJ, Giral P, Kurl S, Rauramaa R, Mannarino E, et al. Measurements of carotid intima-media thickness and of interadventitia common carotid diameter improve prediction of cardiovascular events: results of the IMPROVE (carotid intima media thickness [IMT] and IMT-Progression as predictors of vascular events in a high risk European population) study. J Am Coll Cardiol. 2012;60(16):1489–99. doi: 10.1016/j.jacc.2012.06.034.
- Nasir K, Ziffer JA, Cainzos-Achirica M, Ali SS, Feldman DI, Arias L, Saxena A, Feldman T, Cury R, Budoff MJ, et al. The Miami heart study (MiHeart) at Baptist Health South Florida, a prospective study of subclinical cardiovascular disease and emerging cardiovascular risk factors in asymptomatic young and middle-aged adults: The Miami heart study: rationale and design. Am J Prev Cardiol. 2021;7:100202. doi:10.1016/j.ajpc.2021.100202.
- Addison C, Campbell Jenkins BW, White M, Thigpen Odom D, Fortenberry M, Wilson G, McCoy P, Young L, Woodberry C, Herron K, et al. Twenty years of leading the way among cohort studies in community-driven outreach and engagement: Jackson state university/Jackson heart study. Int J Environ Res Public Health. 2021;18(2):696. doi: 10.3390/ijerph18020696.
- Fried LP, Borhani NO, Enright P, Furberg CD, Gardin JM, Kronmal RA, Kuller LH, Manolio TA, Mittelmark MB, Newman A, et al. The cardiovascular health study: design and rationale. Ann Epidemiol. 1991;1(3):263–76. doi: 10.1016/1047-2797(91)90005-W.
- Bild DE, Bluemke DA, Burke GL, Detrano R, Diez Roux AV, Folsom AR, Greenland P, Jacob DR Jr., Kronmal R, Liu K, et al. Multi-ethnic study of atherosclerosis: objectives and design. Am J Epidemiol. 2002;156(9):871–81. doi: 10.1093/aje/kwf113.
- Wolak A, Gransar H, Thomson LE, Friedman JD, Hachamovitch R, Gutstein A, Shaw LJ, Polk D, Wong ND, Saouaf R, et al. Aortic size assessment by noncontrast cardiac computed tomography: normal limits by age, gender, and body surface area. JACC Cardiovasc Imaging. 2008;1(2):200–9. doi: 10.1016/j.jcmg.2007.11.005.
- Turkbey EB, Jain A, Johnson C, Redheuil A, Arai AE, Gomes AS, Carr J, Hundley WG, Teixido-Tura G, Eng J, et al. Determinants and normal values of ascending aortic diameter by age, gender, and race/ethnicity in the multi-ethnic study of atherosclerosis (MESA). J Magn Reson Imaging. 2014;39(2):360–8. doi: 10.1002/jmri.24183.
- Pham MHC, Ballegaard C, de Knegt MC, Sigvardsen PE, Sorgaard MH, Fuchs A, Kuhl JT, Taudorf M, Nordestgaard BG, Kober LV, et al. Normal values of aortic dimensions assessed by multidetector computed tomography in the copenhagen general population study. Eur Heart J Cardiovasc Imaging. 2019;20(8):939–48. doi: 10.1093/ehjci/jez012.
- Wong ND, Sciammarella M, Arad Y, Miranda-Peats R, Polk D, Hachamovich R, Friedman J, Hayes S, Daniell A, Berman DS. Relation of thoracic aortic and aortic valve calcium to coronary artery calcium and risk assessment. Am J Cardiol. 2003;92(8):951–5. doi:10.1016/S0002-9149(03)00976-7.
- Hoffmann U, Massaro JM, Fox CS, Manders E, O’Donnell CJ. Defining normal distributions of coronary artery calcium in women and men (from the Framingham heart study). Am J Cardiol. 2008;102(9):1136–41. doi:10.1016/j.amjcard.2008.06.038.
- Malhotra R, Mauer AC, Lino Cardenas CL, Guo X, Yao J, Zhang X, Wunderer F, Smith AV, Wong Q, Pechlivanis S, et al. HDAC9 is implicated in atherosclerotic aortic calcification and affects vascular smooth muscle cell phenotype. Nat Genet. 2019;51(11):1580–7. doi: 10.1038/s41588-019-0514-8.
- de Haan A, Ahmadizar F, van der Most PJ, Thio CHL, Kamali Z, Ani A, Ghanbari M, Chaker L, van Meurs J, Ikram MK, et al. Genetic determinants of serum calcification propensity and cardiovascular outcomes in the general population. Front Cardiovasc Med. 2021;8:809717. doi:10.3389/fcvm.2021.809717.
- Fung K, Ramirez J, Warren HR, Aung N, Lee AM, Tzanis E, Petersen SE, Munroe PB. Genome-wide association study identifies loci for arterial stiffness index in 127,121 UK Biobank participants. Sci Rep. 2019;9(1):9143. doi:10.1038/s41598-019-45703-0.
- Rode M, Teren A, Wirkner K, Horn K, Kirsten H, Loeffler M, Scholz M, Pott J, Eller K. Genome-wide association analysis of pulse wave velocity traits provide new insights into the causal relationship between arterial stiffness and blood pressure. PLoS One. 2020;15(8):e0237237. doi:10.1371/journal.pone.0237237.
- Mitchell GF, Verwoert GC, Tarasov KV, Isaacs A, Smith AV, Yasmin, Rietzschel ER, Tanaka T, Liu Y, Parsa A, et al. Common genetic variation in the 3’-BCL11B gene desert is associated with carotid-femoral pulse wave velocity and excess cardiovascular disease risk: the AortaGen consortium. Circ Cardiovasc Genet. 2012;5(1):81–90. doi: 10.1161/CIRCGENETICS.111.959817.
- Keramati AR, Chen MH, Rodriguez BAT, Yanek LR, Bhan A, Gaynor BJ, Ryan K, Brody JA, Zhong X, Wei Q, et al. Genome sequencing unveils a regulatory landscape of platelet reactivity. Nat Commun. 2021;12(1):3626. doi: 10.1038/s41467-021-23470-9.
- Rodriguez BAT, Bhan A, Beswick A, Elwood PC, Niiranen TJ, Salomaa V, FinnGen S, Tregouet DA, Morange PE, Civelek M, et al. A Platelet function modulator of thrombin activation is causally linked to cardiovascular disease and affects PAR4 receptor signaling. Am J Hum Genet. 2020;107(2):211–21. doi: 10.1016/j.ajhg.2020.06.008.
- Larsson SC, Back M, Rees JMB, Mason AM, Burgess S. Body mass index and body composition in relation to 14 cardiovascular conditions in UK Biobank: a Mendelian randomization study. Eur Heart J. 2020;41(2):221–6. doi:10.1093/eurheartj/ehz388.
- Karhunen V, Bakker MK, Ruigrok YM, Gill D, Larsson SC. Modifiable risk factors for intracranial aneurysm and aneurysmal subarachnoid hemorrhage: a Mendelian randomization study. J Am Heart Assoc. 2021;10(22):e022277. doi:10.1161/JAHA.121.022277.
- Lind L, Ingelsson M, Sundstrom J, Arnlov J. Impact of risk factors for major cardiovascular diseases: a comparison of life-time observational and Mendelian randomisation findings. Open Heart. 2021;8(2):e001735. doi:10.1136/openhrt-2021-001735.
- Migliacci R, Becattini C, Pesavento R, Davi G, Vedovati MC, Guglielmini G, Falcinelli E, Ciabattoni G, Dalla Valle F, Prandoni P, et al. Endothelial dysfunction in patients with spontaneous venous thromboembolism. Haematologica. 2007;92(6):812–8. doi: 10.3324/haematol.10872.
- Heshmat-Ghahdarijani K, Jangjoo S, Amirpour A, Najafian J, Khosravi A, Heidarpour M, Hekmat M, Shafie D. Endothelial dysfunction in patients with lone atrial fibrillation. ARYA Atheroscler. 2020;16(6):278–83. doi:10.22122/arya.v16i6.2095.