
Abstract
Platelets contribute to COVID-19 clinical manifestations, of which microclotting in the pulmonary vasculature has been a prominent symptom. To investigate the potential diagnostic contributions of overall platelet morphology and their α-granules and mitochondria to the understanding of platelet hyperactivation and micro-clotting, we undertook a 3D ultrastructural approach. Because differences might be small, we used the high-contrast, high-resolution technique of focused ion beam scanning EM (FIB-SEM) and employed deep learning computational methods to evaluate nearly 600 individual platelets and 30 000 included organelles within three healthy controls and three severely ill COVID-19 patients. Statistical analysis reveals that the α-granule/mitochondrion-to-plateletvolume ratio is significantly greater in COVID-19 patient platelets indicating a denser packing of organelles, and a more compact platelet. The COVID-19 patient platelets were significantly smaller –by 35% in volume – with most of the difference in organelle packing density being due to decreased platelet size. There was little to no 3D ultrastructural evidence for differential activation of the platelets from COVID-19 patients. Though limited by sample size, our studies suggest that factors outside of the platelets themselves are likely responsible for COVID-19 complications. Our studies show how deep learning 3D methodology can become the gold standard for 3D ultrastructural studies of platelets.
Plain Language Summary
COVID-19 patients exhibit a range of symptoms including microclotting. Clotting is a complex process involving both circulating proteins and platelets, a cell within the blood. Increased clotting is suggestive of an increased level of platelet activation. If this were true, we reasoned that parts of the platelet involved in the release of platelet contents during clotting would have lost their content and appear as expanded, empty “ghosts.” To test this, we drew blood from severely ill COVID-19 patients and compared the platelets within the blood draws to those from healthy volunteers. All procedures were done under careful attention to biosafety and approved by health authorities. We looked within the platelets for empty ghosts by the high magnification technique of electron microscopy. To count the ghosts, we developed new computer software. In the end, we found little difference between the COVID patient platelets and the healthy donor platelets. The results suggest that circulating proteins outside of the platelet are more important to the strong clotting response. The software developed will be used to analyze other disease states.
Introduction
In March 2020, the World Health Organization declared COVID-19 as a global pandemic. This disease, caused by the SARS-CoV-2 virus, is highly complex often presenting with a wide variety of clinical manifestations, ranging from no symptoms to multi-organ failure. Some symptoms persist for extended periods in a condition called post-acute sequelae SARS-CoV-2 infection (PASC; aka long Covid). Thrombosis is frequently seen in patients with COVID-19, notably in the pulmonary microvasculature.Citation1–4 Patients presenting with prior cardiovascular or cardiopulmonary diagnoses, including diabetes, hypertension, and vascular diseases, are at a higher risk for thrombotic-related complications (predominantly venous), with studies reporting a prevalence ranging from 0% to 79% of COVID-19 patients.Citation5–10 Platelet hyperactivation, in particular, has been correlated with the formation of pulmonary microclots.Citation11,Citation12 Therefore, understanding the role of platelets in the pathogenesis of COVID-19 has become increasingly important.
Platelets are small, discoid cells found within the blood that play a vital role in hemostasis and thrombosis. They contain numerous secretory granules, the most abundant being α-granules.Citation13 α-Granules contain a range of bioactive proteins including ones involved in inflammation, cell growth regulation, immune responses, and hemostasis. These proteins are released to varying extents in response to agonist interactions with plasma membrane receptors during platelet activation.Citation14–16 The mitochondria, the site of oxidative energy production, have been identified as a major contributor to platelet activation and have significant roles in platelet bioenergetics, reactive oxygen species generation, and Ca++ mobilization.Citation17–19 As the platelet plasma membrane and organelles are central players in platelet hyperactivation and thus could inform on platelet activation, we took a 3D, ultrastructural approach to investigate the potential diagnostic contribution of overall platelet morphology and their α-granules, and mitochondria to understanding the platelet hyperactivation and micro-clotting seen in COVID-19 patients.
Upon normal platelet activation, several morphological changes occur, from cytoskeletal-mediated shape changes (i.e., filopodia and lamellipodia) to granule fusion and decondensation. Thus, high-resolution morphometrics should provide a valuable readout of platelet activation and apparent hyperactivation in circulation. To yield quantitatively meaningful outcomes, we analyzed hundreds of platelets, which required state-of-the-art technology. The 3D image collection was predominantly through the use of the high-contrast, the high-resolution technique of focused ion beam scanning EM (FIB-SEM), and the analysis employed deep learning computational methods. We evaluated approximately 30 000 included organelles in 600 individual platelets from three healthy controls and three severely ill COVID-19 patients, which is a twenty-fold increase in throughput relative to our previous work.Citation20 Our analysis identified significant changes in platelet and organelle morphology in COVID-19 patients. In brief, our detailed 3D data revealed a platelet population that was smaller and more densely packed with α-granules and mitochondria that were present at the same numbers as Control but smaller in size in the mitochondrial case. The Control equivalent α-granule count and individual organelle size in COVID-19 patient platelets strongly suggest that circulating patient platelets have no increased tendency to secrete α-granules than healthy controls. Moreover, we conclude that the approach and results suggest that our methodology could be applicable to other disease states to evaluate how platelets might be altered.
Materials and methods
Sample preparation
Blood from patients with COVID-19 was drawn in the Intensive Care Unit (ICU) at the University of Kentucky Hospital, under full clinical supervision with the appropriate personnel protective equipment. Deidentified information on the patients involved in the study can be found in . During initial laboratory steps in the processing of COVID-19 patient blood, a mask, face shield, full hand coverings, lab coat, and gloves were worn. After processing, all items were autoclaved.
Table I. Demographics and relevant clinical parameters for COVID-19 patients and Control blood donors.
Blood was collected from three healthy Control donors and three severely ill patients in citrated tubes (Becton Dickinson vacutainer A/ACD tubes, containing 22.0 g/L trisodium citrate, 8.0 g/L citric acid, and 24.5 g/L dextrose). Samples were walked to the laboratory at room temperature in a sealed container following appropriate hazardous material protocols. The time between sample collection and processing was just under 30 min. In the laboratory, the blood was supplemented with PBS, prostaglandin I2 (PGI2; Cayman Chemical, Item no. 18220, 10 ng/ml), and apyrase (Sigma-Aldrich, A6410, 0.2 U/ml) and centrifuged at 240 ×g for 10 min. Platelet-rich plasma (PRP) was collected and fixed with a 4% paraformaldehyde (PFA) 0.1% glutaraldehyde mixture (an equal volume of PRP was mixed with 2X fixative 8% PFA + 0.2% glutaraldehyde mixture prepared in PBS). Fixation was for 1 h at room temperature. The platelets were then recovered by centrifugation at 660 × g for 15 min and the pellet was covered with 1% PFA and shipped on ice to the University of Arkansas for Medical Sciences (UAMS) for further processing. Because of the small sample volumes, three samples, Control sample 2, Control sample 3, and COVID-19 sample 3 were embedded into 4% ultra-low melt agarose (Sigma Chemical, A5030) before further processing to minimize loss during processing.
For pre-embedding staining, purified platelet suspensions were postfixed using 0.1 M cacodylate buffer containing 2.5% glutaraldehyde and 2 mM CaCl2, for 1 h on ice. Cells were washed three times with cold 0.1 M sodium cacodylate buffer containing 2 mM CaCl2 and centrifuged at 600 × g for 5 min. Samples were stained with 3% potassium ferrocyanide in 0.3 M cacodylate buffer with 4 mM CaCl2, combined with an equal volume of 4% aqueous osmium tetroxide for 1 h on ice. After washing five times with double-distilled H2O (ddH2O), samples were placed in a 0.22 μm-Millipore-filtered 1% thiocarbohydrazide (TCH) solution in ddH2O for 20 min following five washes with ddH2O at room temperature each for 3 min. Samples were then post-stained in 2% osmium tetroxide in ddH2O for 30 min at room temperature following five washes with ddH2O at room temperature each for 3 min and then placed in 1% uranyl acetate (aqueous) overnight at 4°C. The next day, samples were washed five times with ddH2O at RT each for 3 min and processed for en bloc, Walton’s lead aspartate staining at 60°C for 30 min following five washes with ddH2O at RT each for 3 min. Samples were then dehydrated and processed for resin embedding.
Focused ion beam scanning electron microscopy (FIB-SEM)
Samples embedded in plastic blocks were trimmed and surface coated with carbon and gold before FIB-SEM imaging. The Zeiss Crossbeam 550 FIB-SEM was operated at an accelerating voltage of 1.5 kV and a current of 2 nA, with a 55 µm condenser aperture and under high vacuum conditions. For milling the samples, a FIB voltage of 30 kV was applied, with a baseline current of 700 pA which was adjusted based on the milling depth. For depths larger than 20 µm, the FIB current was increased to a value greater than or equal to 1.5 nA. Both SEM and FIB currents were adjusted and optimized to achieve the highest resolution images while minimizing shelving effects. Image stacks were captured with a pixel size of 7 nm in the XY plane and 15 nm in Z. Before each run, the FIB and SEM apertures were calibrated and aligned. The software used to operate and view the FIB-SEM generated images were Atlas Engine and Atlas 5 (Carl Zeiss Microscopy, LLC, Thornwood, NY, USA; Fibics, Inc. Ottawa, Canada), respectively.
Image segmentation and machine learning
To segment overall platelet plasma membrane and define overall platelet shape, images were processed and segmented with Amira 3D Pro software (Thermo Fisher FEI). Image stacks of each sample were loaded into Amira software and the “Interactive Thresholding” module was used to separate high contrast platelets from the image background. Then, the “Remove Small Spots” module and “Fill Holes” modules were used to remove and fix imperfections in the data. Finally, the “Separate Objects” and “Label Analysis” modules were used to distinguish each platelet in 3D and generate a list of statistics for quantitative evaluation.
To segment the α-granules, a 2-dimensional U-Net deep learning image segmentation model was created.Citation21 This model utilized a patch size of 320 × 320 pixels. The model was trained on a dataset of 28 separate 2279 × 2216 pixels images for which masks were annotated manually by researchers. These images underwent additional augmentations such as rotations and shearing in order to greatly increase the amount of training data. The model was trained over 250 epochs with a batch size of 18, a learning rate of 0.0001, and using Adam optimization. The final model was then utilized to make predictions and segment the images. These segmented results were then processed in Amira in 3D using the same methodology as for the platelets’ plasma membrane.
Due to the lower contrast of the COVID-1 sample platelets, we annotated 30 cells from this sample manually within the Amira software package. Additionally, to segment the mitochondria, we annotated the mitochondria of 10 cells for each sample manually within Amira. This annotation of mitochondria was challenging for the deep learning to succeed. These annotated features could then be analyzed similarly to the platelets.
3D rendering and volume generation
Platelet features in the 3D image volumes were rendered in Amira 3D Pro software. Triangulation was used to generate surface models of the corresponding features.Citation15 Fractional weights, automatically generated during segmentation, were used to produce smooth boundary interfaces. From known voxel dimensions, distances, areas, and volumes were quantified within the software. Results were then exported to Excel spreadsheets for further analysis.
Immediate fixed human platelet data plots
Tabular data presented in of Pokrovskaya et al.Citation20 an open access publication, from the cooperating laboratories was plotted in . In both cases, the plots are novel and do not duplicate published data.
Results
Overall platelet size and shape
A total of three COVID-19 patients and three healthy Control donors were enrolled in the present study. Each COVID patient was severely ill (). Each was obese, diabetic, either type 1 or type 2 and suffered from kidney damage and pneumonia at the time of blood draw. Possibly confounding infections, other factors, and treatment regimens are summarized in . The COVID-19 and Control populations each included both genders and multiple races. Two of the three Controls had a normal BMI, and one was slightly obese. Two out of three of the COVID-19 patients had higher than normal white blood cell count and the third had a lower than normal count. Platelet counts in all three COVID-19 patients were in the normal range.
Each of the three patients was at slightly different stages of the disease. Patients 1 and 2 were at approximately the midpoint of their hospitalization when the samples were taken (33- and 20-days post-diagnosis) and each survived to be discharged to a rehabilitation facility. However, it should be noted that Patient 1 did have a DVT after sampling. Patient 3 was the most severe, and his sample was taken earlier in his hospitalization (12-days post-diagnosis). He did eventually die.
Individual patient timelines
Patient 1 was positive for COVID-19, 7-days before being admitted and intubated. She remained intubated for 13-days and the blood draw was taken 2-days post-extubation (20-days after testing positive). Twelve days after that she developed a DVT. She was discharged to a rehabilitation facility after a total of 40-days of hospitalization.
Patient 2 was positive for COVID-19, 5 days before being intubated. He was transferred from a regional hospital to UKY Hospital 15-days after that and given a tracheotomy 10-days post-admission. The blood draw was taken 2-days after the tracheotomy (33-days after testing positive). He was discharged from a rehabilitation facility 20-days later after 36-days at UKY Hospital.
Patient 3 tested positive for COVID-19 and was intubated on the same day. He was transferred from a regional hospital to UKY Hospital 10 days after that and given a tracheotomy 6 days post-admission. The blood draw was taken 4-days before the tracheotomy (12-days after testing positive). He passed away 46-days after testing positive.
As shown in and Supplemental Movies 1–6, the platelets isolated from all three Control samples and all three COVID-19 samples appeared similar in both single image slices from a 3D stack and when rendered and rotated in 3D space. Significantly, the isolated platelets were more rounded than the elongated discoid platelets found in immediately fixed preparations.Citation20 Most of the platelets when observed in single-plane image slices had extended pseudopods. These pseudopods were a prominent feature in animations when the platelets are rotated in 3D over 360 degrees (Supplemental Movies 1–6). Pseudopods are rare and much shorter in immediately fixed platelets.Citation20 We attribute these shape differences to the fact that the COVID-19 blood samples were drawn under clinical conditions and there was a 30 min interval between blood draw and the addition of prostaglandin and apyrase as platelet passivators. The similar appearance of Control samples reflects the fact that these samples were prepared in a parallel manner. The isolated platelets in both COVID-19 and Control samples were fixed following centrifugation to generate platelet-rich plasma (PRP). Based on these images and the higher magnification images shown in , we conclude that there is little qualitative difference in apparent shape between isolated COVID-19 and Control platelet samples. In brief, based on overall platelet shape, the activation state appeared similar for both COVID-19 and Control samples.
Figure 1. FIB-SEM raw images and 3D surface rendered models of platelets from Control and COVID-19 patients. x-y orthoslices and 3D surface renderings of 17 platelets from each of 3 Control and 3 COVID-19 patients are shown. Scale bars (2 µm) as shown.
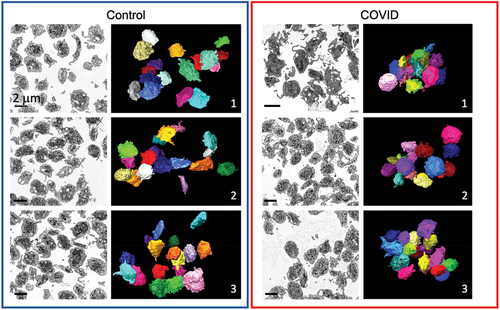
Figure 2. Organelle morphology in platelets from Control and COVID-19 patients. Images with two different magnifications are shown of platelets from a Control (Control donor 3, left) and a COVID-19 patient (COVID 2, right). Identified features are indicated: mitochondria (MIT), α-granules (AG), open canalicular system (OCS), dense tubular system (DTS), possible neutrophil extracellular traps (NETS?), and apoptotic bodies (apoptosis).
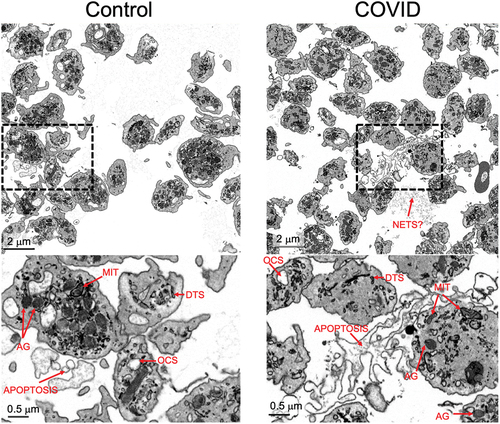
In higher magnification images (), a full set of platelet organelles could be distinguished. There was little, if any apparent difference in organelle appearance between COVID-19 and Control samples with few, if any, decondensed ɑ-granules which would be suggestive of platelet activation and granule release, see also Supplemental Figures S7.8, 3D rendering. In addition, occasional examples of an extracellular fibrous network, possible NETS,Citation22,Citation23 could be seen and were found in both COVID-19 and Control samples. This feature was more prominent in images where the contrast was inverted. Also, found extracellularly were examples of what appeared to be cytoplasm-free membrane fragments potentially indicative of apoptotic platelets. Again, the feature was found at a low level in both COVID-19 and Control samples.
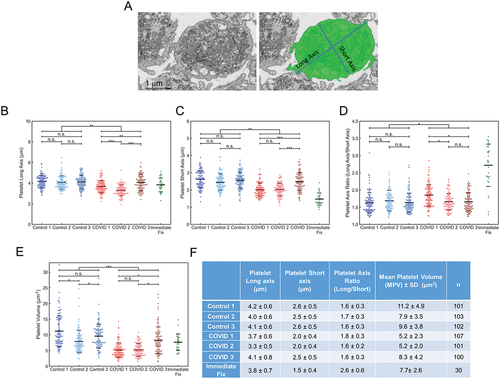
To test for quantitative differences, which are not apparent to the eye, between COVID-19 and Control platelet samples, we quantified overall platelet shape and volume for 100 platelets from each sample and compared the data to that for a pool of 30 immediately fixed platelets from three donors, 10 platelets each.Citation20 For these samples, the platelets were processed similarly post-fixation and manually segmented. Platelet segmentation is demonstrated qualitatively in the top portion of followed by the quantitation. In aggregate when all patient samples were combined, the COVID-19 samples had a slightly more ovoid, i.e., higher long-to-short axis ratio, than the Control donor samples, 3.2%, P = .036. Within the COVID-19 and Control samples, more than half the pairwise comparisons had no significant difference indicating limited heterogeneity between the individual samples. In comparison, immediately fixed platelets were decidedly more elongated. i.e., more discoid, with a nearly two-fold higher long-to-short axis ratio. On a platelet volume basis, the average COVID-19 platelet was smaller, 35% (P < .001), than Control donor platelet and less than that for immediate-fixed platelets.Citation20
Figure 3. Platelet volume measurements from 3D deep learning segmented FIB-SEM images of platelets from Control and COVID-19 patients. (A) depicted is an example of how the cell membrane segmentation was performed. The left image is a representative x-y orthoslice, and the right shows the segmentation of the platelet plasma membrane with the measured interior, highlighted in green. The long and short axis are indicated. Long (B) and short (C) axis lengths for each platelet were plotted (Control 1, n = 101; Control 2, n = 103; Control 3, n = 102; COVID-19 patient 1, n = 107; patient 2, n = 101; patient 3, n = 100). (D) the long-to-short axis ratios were calculated from the values in (B) and (C). For comparison, the ratios were calculated and plotted using published data from platelets that had been immediately fixed.Citation20 in aggregate, the COVID-19 axis ratios were significantly higher compared to controls (p = .001), but intra-patient comparisons showed no differences (p > .05) except when comparing COVID-19 patient 1 to patients 2 and 3 (p < .05). (E) platelet volumes (µm3) were also calculated and plotted for each platelet analyzed. Volumes for immediate fixed platelets were also calculated and plotted. In aggregate, the volumes of platelets from COVID-19 platelets were significantly lower than Control (p < .001). Intra-sample comparisons were significant when comparing the platelets from COVID-19 patient 3 with patient 1 and 2 (p < .05) and Control platelets from donor 2 with those from donor 1 and 3 (p < .05). Other comparisons were not significant. For (B-E) solid lines indicate averages, while dashed lines indicate average ± one standard deviation. (F) summary statistics for the measurements in (B-E). The average, standard deviation, and n for each subject were listed for long axis, short axis lengths, axis ratios and platelet volumes. For multiple group comparison Welch’s ANOVA was used and for the one-to-one comparisons Welch’s t-test was used. Note: * is for p < .05, ** is for p < .005, and *** is for p < .0005.
Platelet organelles – α-granules and mitochondria
An automated, deep-learning, machine network was developed for ɑ-granule segmentation (Materials and Methods). An example of this analysis is shown in , where on the left, there is an unsegmented image on the right, there is a segmented image, with deep learning identified α-granules colored in blue. Using this approach, we segmented α-granules in 5 of the 6 platelet samples, whose volumes were analyzed in . This resulted in the identification of more than 25 000 α-granules. An additional 30 platelets from COVID-19 sample 1 were segmented manually since the signal-to-noise ratio was too low for reliable automated analysis. The mean ɑ-granule count per platelet for all the COVID-19 samples was 47 ± 29, which was significantly lower, by 11.3% (; p = .0271, , standard errors) than Control, 53 ± 31, which compared well with previously reported values for immediately fixed human platelets, 50 ± 27.Citation20 In pairwise comparisons between COVID-19 and Control samples, 4 out of 6 tests failed to show statistical significance for granules per platelets. When the total volume of the granules per platelet was compared for all the COVID-19 vs. control platelets, there was a significant decrease in COVID-19 samples of 17.5% (P = .001, ). But again 4 out of 6 pairwise comparisons failed to show significant differences. However, when considered on a volume ratio basis, the volume concentration of ɑ-granules per platelet was significantly higher because of the decreased size of the COVID-19 patient platelet and the constant mean volume of individual ɑ-granules (, ). Overall, the outcome is suggestive of tighter ɑ-granule packing within COVID-19 patient platelets. Individual COVID-19 patient and Control donor data are summarized in .
Figure 4. Deep learning and manual analysis of α-granules (AGs) in platelets from Control and COVID-19 patients. Analysis of platelets from all three Control samples and COVID-19 samples from patients 2 and 3 were done by deep learning segmentation. COVID-19 patient 1 platelets were analyzed by manual segmentation. (A) depicted is an example of how the platelet AG were analyzed. The left image is a representative x-y orthoslice, and the right shows the segmentation of the platelet AG, highlighted in blue. The number of AGs per platelet (B), AG volumes (C), and the ratios of total AG volume-to-platelet volume were calculated (D). The data for each platelet analyzed was plotted. In aggregate, platelets from COVID-19 patients had fewer AGs compared to controls (p = .022). Intra-sample comparisons showed no significant differences (p > .05) except when comparing COVID-19 patient 2’s platelets with those from COVID-19 patient 1 and 3 (p < .05). In aggregate, AG volumes in platelets from COVID-19 patients were significantly lower compared to Control (p = .001). Intra-sample comparisons showed no significant differences (p > .05) except when comparing Control 1 against Control 2 and 3 (p < .05). In aggregate, the total AG-to-platelet volume ratios were significantly higher in platelets from COVID-19 patients (p = .016). Intra-sample comparisons showed no significant differences (p > .05) except when comparing Control 1 against Control 2 and 3 (p < .05). In (B-D) solid lines indicate averages, while dashed lines indicate one standard deviation from average. (E) AG count, AG volume and total AG-to-platelet volume ratio with standard deviations, for each patient and donor are summarized. n is the number of platelets analyzed per sample. For multiple group comparison Welch’s ANOVA was used and for the one-to-one comparisons Welch’s t-test was used.
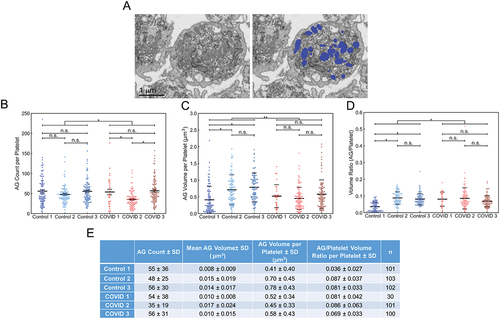
Table II. Comparative quantitative outcomes of COVID-19 patient platelet 3D ultrastructural analysis.
Figure 5. Manual segmentation analysis of mitochondria in platelets from Control and COVID-19 patients. (A) depicted is an example of how the platelet mitochondria were analyzed. The left image is a representative x-y orthoslice, and the right shows the segmentation of the platelet mitochondria, highlighted in magenta. The number of mitochondria per platelet (B), mitochondrial volumes (C), and the ratios of total mitochondrial volume to platelet volume were calculated (D). In aggregate, platelets from COVID-19 patients had similar numbers of mitochondria (p = .833). Intra-sample comparisons showed no significant differences (p > .05) except when comparing mitochondrial numbers from Control 1’s platelets with that from Control 2 and 3 (p < .05) and COVID-19 patient 1’s platelets with those from COVID-19 patient 2 and 3 (p < .05). In aggregate, platelets from COVID-19 patients had significantly lower total mitochondria volumes per platelet compared to Control (p = .038). Intra-sample comparisons showed no differences across all comparisons (p > .05). In aggregate, platelets from COVID-19 patients had significantly higher total mitochondria-to-platelet volume values compared to Control (p = .024). Intra-sample comparisons showed no differences across all comparisons (p > .05). In (B-D) solid black lines indicate sample averages, and the dashed lines indicate one standard deviation from average. (E) mitochondrial count, mitochondria volume and total mitochondria-to-platelet volume ratio with standard deviations, for each patient and donor are summarized. n is the number of platelets analyzed per sample. For multiple group comparison Welch’s ANOVA was used and for the one-to-one comparisons Welch’s t-test was used.
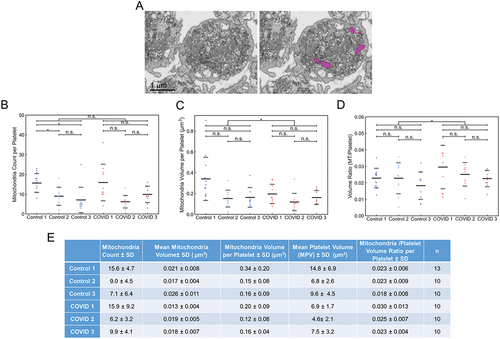
Mitochondria, the site of oxidative phosphorylation and the majority of energy production in circulating platelets, were identified by their cristae and an electron-dense matrix and manually segmented. An example is shown in (left, EM image and right, segmented mitochondria in magenta). There was no significant difference in the overall number of mitochondria per platelet, 11, in COVID-19 and control patient samples (, ) and that determined previously for immediately fixed human platelets.Citation20 Significant differences between COVID-19 mitochondrial parameters and control were noted only when the mitochondria were compared on a pooled basis ( and ). When expressed in this manner, there was a significant difference in individual mitochondrial volume, COVID-19 23% less (, ). As the COVID-19 patient platelets are on the average about 35% smaller than control (N = 300+, ), the volume ratio for mitochondria per platelet was higher than Control.
Histogram analysis indicates a greater platelet size and α-granule parameter dispersity in control than COVID platelets
To the best of our knowledge, the present platelet data sets are at least 10- to 20-fold larger than any previously reported ones. Because of the substantial size of our 3D image data, we reasoned that further analysis might well provide significant evidence not only for morphological variability of COVID platelets but also about platelet organelle heterogeneity. To address such questions, we replotted the data as histograms of platelet and ɑ-granule size/shape. As shown in , Control and COVID-19 data are plotted in three intensity shades to correspond to the three donors and best-curve fits are presented as shaded intensity varied, continuous lines. In the case of the immediate-fixed platelet plots, the previously published, tabular data from the three donors (10 platelets each were pooled, and a single curve fit is shown for each parameter).Citation20 The samples from the three COVID-19 patients, all appeared to fit simple Gaussian distributions with little variation between patients. However, and strikingly, in the case of the samples from the three Control patients, distributions frequently showed shouldering suggestive of heterogeneity in platelet volume, α-granule volume, and α-granule volume ratio. In the case of immediately fixed platelet samples, the curve fits were typically all simple Gaussian distributions. Interestingly, the histogram distribution of the three COVID-19 patient samples more closely approximated that of the immediately fixed donor populations than did those of the Control patient samples. The COVID-19 and Control samples were all fixed at the PRP, platelet-rich plasma step, in platelet isolation. In the case of the three Control donor samples the greater apparent heterogeneity may well reflect the greater mean size of the individual mitochondria.
Figure 6. Comparative histogram analysis of platelet heterogeneity in COVID patient, Control and immediate-fixed samples (A-E). Histograms of platelet volumes, platelet axis ratios, AG counts, AG volumes and total AG-to-platelet volume ratios for platelets from COVID-19 patients (top row, red), from Control donor platelets (middle row, blue) and from immediate-fixed platelets (plotted from raw data in Pokrovskaya et al.Citation20; bottom row, green). (F) graphical depiction of the structural differences between platelets from control donors and COVID-19 patients. Statistical analysis reveals that the α-granule/mitochondrial-to-platelet volume ratio is significantly greater in COVID-19 patient platelets indicating a more densely packed and compact platelet. The COVID-19 patient platelets were 35% smaller, and most of the differences in organelle packing density were due to a decreased platelet size, and not due to organelle count or volume. The cartoon image is illustrative and not strictly to scale.
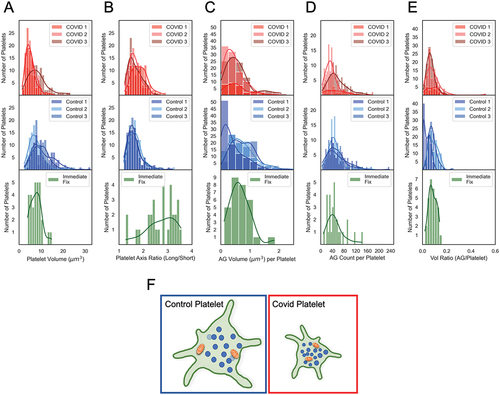
As was apparent in the histogram plots and , the greatest differences between COVID-19 and Control donor platelets and included organelles at the level of 3D ultrastructure were in overall platelet volume, COVID-19 platelets were 35% smaller than Control, and mean mitochondrial volume, almost 27% less than Control. α-Granule number and average volume were similar. In sum, these differences result in smaller COVID-19 platelets that are more tightly packed with α-granules and contain normal numbers of small mitochondria as shown in cartoon form in .
Discussion
Platelets were analyzed from three severely ill COVID-19 patients and three Control donors by 3D electron microscopy (EM) to gain insight into the platelet hyper-reactivity and micro-clotting found in some COVID-19 patients. Of our three COVID-19 patient donors one died in the hospital. In brief, our work points to four main conclusions:
Based on platelet shape and ɑ-granule content, platelets from the three COVID-19 patients analyzed appeared no more activated than those from the three Control donors. COVID-19 and Control platelets were fixed at the PRP stage of isolation and appeared to be similarly swollen about their short axis. Each contained near normal numbers of α-granules, 47 ± 29 and 53 ± 31 versus the 50 ± 5 in our previously published 3D EM characterization of human platelets immediately fixed upon blood draw. The mean ɑ-granule volume in COVID-19 and Control patients was nearly identical.
COVID-19 platelets were 35% smaller in volume than those from Control donors, which results in ɑ-granules being more tightly packed with respect to one another and with respect to the volume enclosed by the plasma membrane. Potentially, this could lead to enhanced α-granule secretion. Our measurements contrast with the widely published data on platelet size in COVID-19 patients. A recent systematic review of platelet volume indices (PVI) and their relationship to COVID-19 severity and potential diagnostic utility showed that, in general, platelet size increased in COVID-19 patients, relative to uninfected controls.Citation24 However, this group pointed out caveats in their survey data that limit this conclusion. Multiple factors can affect platelet size, some are biological (i.e., age, sex, disease type, and stage) and some are related to platelet preparation and analysis. For example, EDTA, a standard anticoagulant used in blood draws, causes platelet swelling.Citation25 Many of these factors were not controlled for in the published studies. In our small sample of severe COVID-19 patients, the measured platelet volumes were reduced, but the organelle numbers and sizes were not affected. Given that our mode of measuring platelet volumes is of higher resolution than what is achieved with the automated analyzers, it is hard to directly compare our results to the published clinical data. However, we note that all samples analyzed in this study were taken with citrate as the anticoagulant, and thus limited swelling of the platelets should have occurred.
COVID-19 patient mitochondria were almost 23% smaller in mean volume per organelle. This raises the possibility of reduced oxidative phosphorylation capacity in COVID-19 versus Control platelets. This number is based upon the analysis of a subpopulation of platelets. A subpopulation was analyzed because we were unable to implement machine learning techniques on an organelle population that was 1/5th as abundant as α-granules, ~11 versus ~50 copies each.
The major limiting factor in our ability to go from the analysis of tens of platelet examples to hundreds of examples proved not to be in imaging the platelets themselves but in the capacity to bring machine learning techniques to the software driven analysis. In stating this, we emphasize that the present study does represent a significant increase in sample number scored for the case of whole platelets and α-granule compartments. More than 600 platelets analyzed with respect to platelet size and shape and over 25 000 α-granules scored, a ~ 20-fold increase over past studies on human platelets.Citation20,Citation26–28 The accuracy of the present methodology is validated by the fact that the automated deep learning approach gave similar outcomes within the margin of manual methodology.Citation20 The number of α-granules reported here for Control donors (PRP fix), 3 donors, 306 platelets total is 53 ± 31 (SD, standard deviation) and COVID donors (PRP fix), 3 donors, 231 platelets total is 47 ± 29 (SD),Citation20 Control (immediate fix), 3 donors, 30 platelets give a mean of 50 ± 27 (SD). Whether this will be a general outcome requires testing further experimental situations.
In quantitative parameters such as long axis length, α-granule numbers and mitochondrial numbers, the COVID patient platelets characterized here differed little from immediately fixed healthy donor platelets, a model for circulating, human platelet.Citation20 On the other hand, both COVID-19 and matched healthy donor Control platelets were more rounded, an indication of low- level activation. We attribute this activation to processing blood draws in a parallel manner in a situation where safety factors in processing blood from infected, seriously ill patients predominated. In comparison to other approaches to characterizing COVID-19 platelets,Citation24,Citation25,Citation29–33 our 3D ultrastructural analysis provided a detailed, multiplane view of intraplatelet morphology. Qualitatively, major differences were not apparent. Quantitatively, significant differences, albeit often small, were found with the largest organellar difference being in mean mitochondrial size. Considering that we were not able to implement machine learning techniques for the quantitation of α-granules in one of the three COVID-19 patient samples and for the mitochondrial population, we concluded that we had reached the limits of our present technology. Hence, we did not attempt to analyze quantitatively the dense tubular or canalicular systems. Overall, the key limitation to the machine learning techniques was the quality of the examples used in a training set. At least in our analysis, the imaging hardware side was not the major limiting factor in increasing data scale. The FIB-SEM was operated at several times the best resolution of a 3 × 3 × 3 nm voxel size, with a voxel size of 7 × 7 × 15 nm. This nominal resolution was decreased by another factor by binning due to software and computer limitations. With a sufficient signal to noise ratio of the image data sets and additional improvements in hardware and software, the approaches taken here could potentially further increase the level of attainable detail.
In conclusion, we have found that the main qualitative and quantitative differences in 3D ultrastructure between platelets from severely ill COVID-19 patients and platelets from healthy Control donors are in cell and organelle size. Platelets from COVID-19 patients were found to be smaller and the mitochondrial volume was reduced relative to the Controls, whereas the number and size of α-granules, the major secretory organelle in platelets, did not differ significantly from those in the Controls. In brief, there is little to no evidence that either the platelets from COVID-19 patients or Control donors were any more activated than would be expected for delayed fixation relative to blood draw. In either case, the platelets were rounded with respect to immediately fixed, discoid-shaped platelets. Statistical analysis reveals that the α-granule-to-platelet volume ratio and the mitochondrial-to-platelet volume ratio were significantly greater in COVID-19 patient platelets, which indicated a more densely packed and more compact platelet in the COVID-19 patients. The COVID-19 patient platelets were 35% smaller than the Control platelets, with most of difference in organelle packing density being attributed to decreased platelet size, and not to differences in organelle count or volume. On one hand, the tighter packing of α-granules in the smaller platelets of COVID-19 patients might facilitate platelet activation as monitored by granule release, while on the other hand the finding of decreased individual mitochondrial size could be energy limiting. Although only a small number of patients and healthy donors were analyzed, these studies do suggest that factors outside of the platelets themselves are likely responsible for such COVID-19 complications as microclotting. In addition to making a unique 3D ultrastructural contribution to the understanding of COVID-19 infection and the effect of this virus on platelets, we suggest that the deep learning 3D methodology applied in these studies moves the gold standard for 3D ultrastructural studies of platelets to a new level.
Author contributions
Patient recruitment and sample procurement were the responsibilities of Kenneth Campbell, Jamie Sturgill, Gail Sievert, James Porterfield, and Jeremy Wood. Smita Joshi, Hammodah Alfar, Chi Peng, and Beth Garvey were involved in post-blood draw steps in sample preparation at the University of Kentucky. Irina Pokrovskaya carried fixed PRP samples through to embedding and sample trimming for FIB-SEM. Her work was supported by Jeffrey Kamykowski. All FIB-SEM imaging was done by the Leapman laboratory at NIH, NIBIB with Sagar Matharu, Cassidy Nordmann, and Kurtis Ottman, Rahul Akkem, Douglas Palumbo and Denzel Cruz, responsible for experimental implementation/data analysis steps and Maria A. Aronova and Richard D. Leapman being major contributors to experimental design and supervision. Data analysis was supervised by Maria A. Aronova, Sidney Whiteheart and Brian Storrie. Sagar Matharu, Cassidy Nordmann, and Kurtis Ottman prepared the first draft and Smita Joshi, Maria A. Aronova, Irina Pokrovskaya and Sidney Whiteheart edited text. Brian Storrie took senior author responsibility for seeing the manuscript through to completion.
Highlights
3D FIB-SEM comparisons of platelets isolated from blood draws of three severely ill COVID-19 patients and three healthy Control donors were compared. Advanced 3D deep learning techniques enabled comparisons between tens of thousands of α-granules. The COVID-19 patients’ platelets were on average smaller and contained numbers of α-granules, secretion indicator, and mitochondria, energetics indicator, that were similar to those of Control donors. Individual α-granule size was unchanged relative to Control while that of individual mitochondria was decreased by 17%. In total, the smaller COVID-19 patient platelets contained a higher density of organelles. Although limited by sample size, the results suggest that factors outside of the platelets are likely responsible for manifested disease complications. The deep learning approach taken should be applicable to other situations.
Supplemental Material
Download QuickTime Video (23.2 MB)Supplemental Material
Download PDF (443.1 KB)Acknowledgments
Thanks are given for what was truly a team effort. Content is solely the responsibility of the authors and does not necessarily represent the official views of the NIH.
Disclosure statement
No potential conflict of interest was reported by the author(s).
Supplementary data
Supplemental data for this article can be accessed online at https://doi.org/10.1080/09537104.2023.2264978.
Additional information
Funding
References
- Rapkiewicz AV, Mai X, Carsons SE, Pittaluga S, Kleiner DE, Berger JS, Thomas S, Adler NM, Charytan DM, Gasmi B, et al. Megakaryocytes and platelet-fibrin thrombi characterize multi-organ thrombosis at autopsy in COVID-19: a case series. EClinicalMedicine. 2020;24:100434. doi:10.1016/j.eclinm.2020.100434.
- Ackermann M, Verleden SE, Kuehnel M, Haverich A, Welte T, Laenger F, Vanstapel A, Werlein C, Stark H, Tzankov A, et al. Pulmonary vascular endothelialitis, thrombosis, and angiogenesis in COVID-19. N Engl J Med. 2020;383(2):120–12. doi:10.1056/NEJMoa2015432.
- Poissy J, Goutay J, Caplan M, Parmentier E, Duburcq T, Lassalle F, Jeanpierre E, Rauch A, Labreuche J, Susen S, et al. Pulmonary embolism in patients with COVID-19: awareness of an increased prevalence. Circulation. 2020;142(2):184–6. doi:10.1161/CIRCULATIONAHA.120.047430.
- Xiong X, Chi J, Gao Q. Prevalence and risk factors of thrombotic events on patients with COVID-19: a systematic review and meta‐analysis. Thromb J. 2021;19(1):32. doi:10.1186/s12959-021-00284-9.
- Nahum J, Morichau-Beauchant T, Daviaud F, Echegut P, Fichet J, Maillet J-M, Thierry S. Venous thrombosis among critically ill patients with coronavirus disease 2019 (COVID-19). JAMA Netw Open. 2020;3(5):e2010478. doi:10.1001/jamanetworkopen.2020.10478.
- Fraissé M, Logre E, Pajot O, Mentec H, Plantefève G, Contou D. Thrombotic and hemorrhagic events in critically ill COVID-19 patients: a French monocenter retrospective study. Crit Care. 2020;24(1):275. doi:10.1186/s13054-020-03025-y.
- Pretorius E, Venter C, Laubscher GJ, Lourens PJ, Steenkamp J, Kell DB. Prevalence of readily detected amyloid blood clots in ‘unclotted’ type 2 diabetes mellitus and COVID-19 plasma: a preliminary report. Cardiovasc Diabetol. 2020;19(1):193. doi:10.1186/s12933-020-01165-7.
- Sattar N, McInnes IB, McMurray JJV. Obesity is a risk factor for severe COVID-19 infection: multiple potential mechanisms. Circulation. 2020;142(1):4–6. doi:10.1161/CIRCULATION-AHA.120.047659.
- Cattaneo M, Bertinato EM, Birocchi S, Brizio C, Malavolta D, Manzoni M, Muscarella G, Orlandi M. Pulmonary embolism or pulmonary thrombosis in COVID-19? is the recommendation to use high-dose heparin for thromboprophylaxis justified? Thromb Haemostasis. 2020;120(8):1230–2. doi:10.1055/s-0040-1712097.
- Cui S, Chen S, Li X, Liu S, Wang F. Prevalence of venous thromboembolism in patients with severe novel coronavirus pneumonia. J Thromb Haemostasis. 2020;18(6):1421–4. doi:10.1111/jth.14830.
- Grobbelaar LM, Venter C, Vlok M, Ngoepe M, Laubscher GJ, Lourens PJ, Steenkamp J, Kell DB, Pretorius E. SARS-CoV-2 spike protein S1 induces fibrin(ogen) resistant to fibrinolysis: implications for microclot formation in COVID-19. Biosci Rep. 2021;41(8):BSR20210611. doi:10.1042/BSR20210611.
- Venter C, Bezuidenhout JA, Laubscher GJ, Lourens PJ, Steenkamp J, Kell DB, Pretorius E. Erythrocyte, platelet, serum ferritin, and p-selectin pathophysiology implicated in severe hypercoagulation and vascular complications in COVID-19. Int J Mol Sci. 2020;21(21):8234. doi:10.3390/ijms21218234.
- Blair P, Flaumenhaft R. Platelet α–granules: basic biology and clinical correlates. Blood Rev. 2009;23(4):177–89. doi:10.1016/j.blre.2009.04.001.
- Jonnalagadda D, Izu LT, Whiteheart SW. Platelet secretion is kinetically heterogeneous in an agonist-responsive manner. Blood. 2012 Dec 20;120(26):5209–16. doi:10.1182/blood-2012-07-445080. Epub 2012 Oct 18.
- Pokrovskaya ID, Joshi S, Tobin M, Desai R, Aronova MA, Kamykowski JA, Zhang G, Whiteheart SW, Leapman RD, Storrie B. SNARE-dependent membrane fusion initiates α-granule matrix decondensation in mouse platelets. Blood Adv. 2018 Nov 13;2(21):2947–58. doi:10.1182/bloodadvances.2018019158.
- Chanzu H, Lykins J, Wigna-Kumar S, Joshi S, Pokrovskaya I, Storrie B, Pejler G, Wood JP, Whiteheart SW. Platelet α-granule cargo packing and release are affected by the luminal proteo-glycan, serglycin. J Thromb Haemost. 2021 Apr;19(4):1082–95. doi:10.1111/jth.15243. Epub 2021 Feb 8.
- Kulkarni PP, Ekhlak M, Dash D. Energy metabolism in platelets fuels thrombus formation: halting the thrombosis engine with small-molecule modulators of platelet methalism. Metabolism. 2023 May 25;145:155596. doi:10.1016/j.metabol.2023.155596. PMID: 37244415.
- Masselli E, Pozzi G, Vaccarezza M, Mirandola P, Galli D, Vitale M, Carubbi C, Gobbi G. ROS in platelet biology: functional aspects and methodological insights. Int J Mol Sci. 2020 Jul 9;21(14):4866. doi:10.3390/ijms21144866.
- Millington-Burgess SL, Harper MT. Cytosolic and mitochondrial Ca2+ signaling in procoagulant platlelets. Platelets. 2021 Oct 3;32(7):855–62. doi:10.1080/09537104.2021.1881951. Epub 2021 Feb 18. PMID: 33600275.
- Pokrovskaya ID, Yadav S, Rao A, McBride E, Kamykowski JA, Zhang G, Aronova MA, Leapman RD, Storrie B. 3D ultrastructural analysis of α-granule, dense granule, mitochondria, and canalicular system arrangement in resting human platelets. Res Pract Thromb Haemost. 2020;4(1):72–85. doi:10.1002/rth2.12260.
- Ronneberger O, Fischer P, Brox T. U-Net: convolutional networks for biomedical image segmentation. 2015. http://arxiv.org/abs/1505.04597.
- Krautgartner WD, Klappacher M, Hannig M, Obermayer A, Hartl D, Marcos V, Vitkov L. Fibrin mimics neutrophil extracellular traps in SEM. Ultrastruct Pathol. 2010 Aug;34(4):226–31. doi:10.3109/01913121003725721.
- Obermayer A, Stoiber W, Krautgartner WD, Klappacher M, Kofler B, Steinbacher P, Vitkov L, Grabcanovic-Musija F, Studnicka M. New aspects on the structure of neutrophil extracellular traps from chronic obstructive pulmonary disease and in vitro generation. PLoS One. 2014 May 15;9(5):e97784. eCollection 2014. doi:10.1371/journal.pone.0097784.
- Daniels S, Wei H, van Tongeren M, Denning DW. Are platelet volume indices of clinical use in COVID-19? A systematic review. Front Cardiovasc Med. 2022;9:1031092. doi:10.3389/fcvm.2022.1031092.
- Jackson SR, Carter JM. Platelet volume. laboratory measurements and clinical application. Blood Rev. 1993 Jun;7(2):104–13. doi:10.1016/s0268-960x(05)80020-7.
- Wang R, Stone RL, Kaelber JT, Rochat RH, Nick AM, Vijayan KV, Afshar-Kharghan V, Schmid MF, Dong JF, Sood AK, et al. Electron cryotomography reveals ultrastructure alterations in platelets from patients with ovarian cancer. Proc Natl Acad Sci USA. 2015 Nov 17;112(46):14266–71. doi:10.1073/pnas.1518628112. Epub 2015 Nov 2.
- Pokrovskaya ID, Aronova MA, Kamykowski JA, Prince AA, Hoyne JD, Calco GN, Kuo BC, He Q, Leapman RD, Storrie B. STEM-tomography reveals that the canalicular system and α-granules remain separate compartments during early secretion stages in blood platelets. J Thromb Haemost. 2016 Mar;14(3):572–84. doi:10.1111/jth.13225. Epub 2016 Feb 4.
- Eckly A, Rinckel JY, Proamer F, Ulas N, Joshi S, Whiteheart SW, Gachet C. Respective contributions of single and compound granule fusion to secretion by activated platelets. Blood. 2016 Nov 24;128(21):2538–49. doi:10.1182/blood-2016-03-705681. Epub 2016 Sep 13. PMID: 27625359.
- Moskalensky AE, Yurkin MA, Konokhova AI, Strokotov DI, Nekrasov VM, Chernyshev AV, Tsvetovskaya GA, Chikova ED, Maltsev VP. Accurate measurement of volume and shape of resting and activated blood platelets from light scattering. J Biomed Opt. 2013;18(1):017001. doi:10.1117/1.JBO.18.1.017001.
- Schmoeller D, Picarelli MM, Paz Munhoz T, Poli de Figueiredo CE, Staub HL. Mean platelet volume and immature platelet fraction in autoimmune disorders. Front Med. 2017;4:146. doi:10.3389/fmed.2017.00146.
- Tahtabasi M, Hosbul T, Karaman E, Akin Y, Konukoglu O, Sahiner F. Does COVID-19 cause an increase in spleen dimensions? Possible effects of immune activation, hematopoietic suppression and microthrombosis. Clin Imaging. 2021;79:104–9. doi:10.1016/j.clinimag.2021.04.035.
- Park Y, Schoene N, Harris W. Mean platelet volume as an indicator of platelet activation: methodological issues. Platelets. 2002;13(5–6):301–6. doi:10.1080/095371002220148332.
- Wolny M, Dittrich M, Knabbe C, Birschmann I. Immature platelets in COVID-19. Platelets. 2023 Dec;34(1):2184183. doi:10.1080/09537104.2023.2184183.