
Abstract
In contrast to red blood cells, platelets float rather than sediment when a column of blood is placed in the gravitational field. By the analogy of erythrocyte sedimentation (ESR), it can be expressed with the platelet antisedimentation rate (PAR), which quantitates the difference in platelet count between the upper and lower halves of the blood column after 1 h of 1 g sedimentation. Venous blood samples from 21 healthy subjects were analyzed for PAR. After a 1-h sedimentation, the upper and lower fractions of blood samples were analyzed for platelet count, mean platelet volume (MPV), immature platelet fraction (IPF), and high-fluorescence IPF (H-IPF). The mechanisms behind platelet flotation were explored by further partitioning of the blood column, time-dependent measurements of platelet count and comparison with ESR. The structure and function of the platelets were assessed by electron microscopy (EM) and atomic force microscopy (AFM), and platelet aggregometry, respectively. Platelet antisedimentation is driven by density differences and facilitated by a size-exclusion mechanism caused by progressive erythrocyte sedimentation. The area under the curve (AUC) of the whole blood adenosine diphosphate (ADP) aggregation curves showed significant differences between the upper and lower samples (p < .005). AUC in the upper samples of 38% of healthy subjects exceeded the top of the normal range (53–122) suggesting that ascending platelets show an intensified ADP-induced aggregability ex vivo. H-IPF was significantly higher in the upper samples (p < .05). EM and AFM revealed that platelets in the upper samples were larger in volume and contained 1.6 times more alpha granules compared to platelets in the lower samples. Our results indicate that antisedimentation is able to differentiate platelet populations based on their structural and functional properties. Therefore, PAR may be a suitable laboratory parameter in various thromboinflammatory disorders.
Plain Language Summary
It is less known that platelets do not sediment in response to gravitational force but float on the top of the blood column. This phenomenon is called antisedimentation, the rate of which, however, can be different, yet this feature has not been widely studied and used in clinical practice or diagnosis. We tested the idea that antisedimentation of platelets from venous blood samples can be a potential biomarker. We have found that platelet antisedimentation is driven by density differences and facilitated by a size-exclusion mechanism caused by progressive erythrocyte sedimentation and after 1-h upper and lower fractions develop. Interestingly, the aggregation curves showed significant differences between the upper and lower samples, suggesting that the ascending platelets show ex vivo hyperaggregability. Electron and atomic force microscopy revealed that platelets in the upper samples were larger in volume and contained more alpha granules than platelets in the lower samples. Subsequently, antisedimentation can be used to differentiate platelet populations based on their structural and functional properties; thus, it may be a promising biomarker for various thromboinflammatory disorders.
Introduction
Platelets produced by megakaryocytes in the bone marrow are essential not only in primary hemostasis but also in thrombosis, immunity, and inflammation.Citation1–4 The lifespan of the platelets in circulation is 7–10 days.Citation5 The range of normal platelet count in blood is between 150 and 400 G/L. In laboratory diagnostics, the concentration and properties of platelets are assessed with numerous variables and methods: (i) platelet count (PC), mean platelet volume (MPV); (ii) platelet aggregometry (e.g., impedance aggregometry); (iii) platelet flow cytometry, ADP and serotonin release assays; and (iv) transmission electron microscopy.Citation6–9 Upon activation, platelets respond with a change in shape, size, aggregation, protein expression, and release of different cytokines.Citation10 They also exert “thromboinflammatory” activities in a variety of vascular disorders; therefore, identification of such inflammatory and immune activities may contribute to personalized medicine approaches in patients with vascular diseases.Citation11,Citation12 Platelets contain several types of granules in variable amounts, which can be measured by transmission electron microscopy (TEM), the gold standard for assessing their ultrastructure.Citation13,Citation14 While the dense granule content is primarily associated with immature platelet fraction (IPF), suggesting that younger platelets may contain more dense granules,Citation13 the alpha-granule content determines platelet density, which is thought to reflect platelet reactivity.Citation15 Low-density platelets contain fewer alpha granules; hence, they are less reactive than high-density populations.Citation16 Previous studies have shown increased adhesion efficiency in high-density platelets.Citation16 Elevated platelet density was also demonstrated in myocardial infarction.Citation17 Platelets decrease their density while secreting thromboinflammatory molecules such as beta-thromboglobulin.Citation14 The volume and size of the platelets and their subpopulations, such as young reticulated platelets in the circulation, are routinely measured in hematology laboratories. In healthy volunteers, the reference interval is 9.6–13.1 fL for MPV and 1.3–9.0% for IPF, respectively.Citation18,Citation19
By the analogy of erythrocyte sedimentation rate (ESR), the leukocyte antisedimentation rate (LAR) was developed and used as a simple clinical laboratory testCitation20 for the analysis of sedimented leukocytes. Indeed, LAR reflects the flotation of leukocytes in response to gravity, which is proportional to the number of activated leukocytes in the Westergren tube. The clinical utility of this method was proven in the early recognition of infection in several conditions, such as sepsis, post-stroke infection, and burn.Citation21–23 Similarly, the diagnostic power of the platelet antisedimentation rate (PAR) and platelet function test was recently explored in convalescent post-stroke patients on clopidogrel antiplatelet therapy.Citation24 Yet, neither the exact mechanisms of platelet antisedimentation nor its structural and functional implications are known.
Here, we have investigated the motion of platelets during 1-h gravity sedimentation similar to LARCitation20 and developed a modified version of LAR, called platelet antisedimentation rate (PAR). We hypothesized that the platelets segregated into upper and lower fractions after 1-h gravity sedimentation may have different structural and functional characteristics. We show that platelet antisedimentation is driven by the overall lower density of platelets than that of bulk plasma, which is caused by the increased volume of the platelets in the upper fraction. The antisedimentation process is facilitated by the sedimentation of red blood cells by a size-exclusion mechanism. The ascending, upper-fraction platelets also contain more alpha granules, are more immature, and display greater aggregability than the ones in the lower fraction. Thus, PAR may be used as a simple test for assessing the structural and functional characteristics of platelets, which may be relevant and diagnostic in a number of vascular disorders.
Methods
Subjects and blood sampling
Venous blood samples were taken by using 21 G peripheral venous cannula from 21 healthy, fasted volunteers. Exclusion criteria were antiplatelet therapy, acute infection, low platelet count (<150 G/l), and any history of bleeding diathesis or use of drugs with antiplatelet side effects (e.g., oral contraceptives, NSAIDs, etc.). The study protocol was approved by the University of Pécs Clinical Centre Regional and Institutional Research Ethics Committee (Ref. number 6735, Clinical Trial registration number: NTC03679858). Written informed consent was obtained from each subject. The hematological parameters, total blood cell count, and the platelet antisedimentation rate (PAR, see below) were measured and calculated from blood samples taken into vacutainer tubes (BD Vacutainer System/Greiner, Bio-One GmbH, Germany) with EDTA (REF: 368856, 5.4 mg/3 mL K3-EDTA). Blood was collected into hirudin-containing tubes for platelet function test.
Platelet antisedimentation rate (PAR)
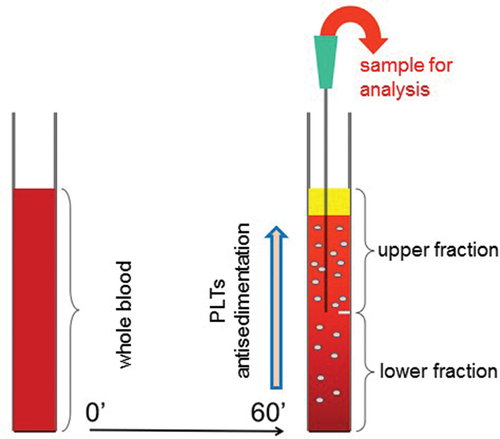
After 1-h gravity sedimentation, the upper and lower halves of each venous blood column were separately removed from the EDTA tube for further analysis (). An automatic cell counter system (Sysmex XN 9000, Sysmex Co, Japan, 2017) was used to count the platelets in the upper and lower fractions which contained the floating (ascending) and sedimenting (descending) platelets, respectively. In order to quantitatively express platelet displacement toward the upper or lower fractions, we hereby introduce a parameter called platelet antisedimentation rate (PAR). PAR indicates platelet displacement from the middle of the blood column along the direction of gravitational force.Citation20
Figure 1. Schematics of the gravity sedimentation technique. Platelet (PLT) antisedimentation rate (PAR) is measured by comparing the platelet count in the upper and lower fractions of the blood column after 1 h of gravity sedimentation at room temperature. PAR (%) is calculated as (Upper − Lower)/(Upper + Lower) × 100.
Mathematical components of PAR
PAR (%) = ((Upper platelet count) − (Lower platelet count))/((Upper platelet count) + (Lower platelet count)) × 100 (1)
According to Equation (1), the value of PAR is 0% if the platelets are equally distributed between the upper and lower parts of the sedimentation tube, whereas it is +100% or −100% if all the platelets are in the upper or lower parts, respectively.
Multiple electrode impedance aggregometry
Platelet functional test was performed on hirudin-anti-coagulated whole blood by using a whole blood impedance aggregometer (Multiplate® Analyzer, Roche Diagnostics, Mannheim, Germany). The whole blood impedance aggregometry measures the change in electrical impedance between two electrodes when platelet aggregation is induced by an agonist. After 1-h gravity sedimentation, the blood column was divided into upper and lower samples. Aggregometry was simultaneously performed from the whole blood, as well as from the upper and the lower halves with adenosine diphosphate (ADP; 6.5 µM final concentration) added as an agonist of aggregation. The aggregation level was expressed as the area under the curve (AUC), which was calculated for 6 min by the program of theMultiplateAnalyzer.Citation12 After ADP stimulation, the normal range of the AUC is 53–122 according to the manufacturer.Citation12 Besides AUC, the arbitrary aggregation unit (AU), and a maximum slope of the curve as the initial velocity were also recorded.
Total blood cell count and immature platelet fraction measurements
The total blood cell count was measured on a Sysmex XN 9000 integrated automated hematology analyzer (Sysmex Co, Japan, 2017). The platelet number (PLT-F) and immature platelet fraction (IPF) were measured by using the fluorescence platelet channel of the analyzer. In this channel, platelets are specifically stained intracellularly with a fluorescent dye and counted according to the principle of flow cytometry, by analyzing the forward scattered light (FSC), the side scattered light (SSC), and fluorescence emission (SFL). Platelets displaying high fluorescence intensity constitute an immature platelet fraction. The mean platelet volume (MPV), platelet large cell ratio (LCR), and high fluorescence immature platelet fraction (H-IPF) were also recorded.
Electron microscopy
Blood was collected from the subjects in EDTA tubes, and after 1-h gravity sedimentation, the supernatant was pipetted into another tube. Both tubes were centrifuged at 200 g for 5 min. Subsequently, the supernatants of both tubes were transferred to a new native tube, and this platelet-rich plasma (PRP) was immediately transferred to the electron microscope laboratory for further processing. Platelets were fixed with 2.5% glutaraldehyde (in a PB solution, phosphate buffer 0.1 M, pH 7.4) overnight at 4°C. Specimens were centrifuged, and the sediments were post-fixed with 1% osmium tetroxide diluted in PB for 60 min at 4°C. The fixed sediments were mixed in 3% agar solution. Following the hardening of agar, 1 mm3 blocks were cut and washed in phosphate buffer three times for 10 min. Following dehydration with ethyl alcohol, samples were washed and placed in propylene oxide and then embedded in Durcupan resin (Sigma, Budapest, Hungary). Semi-thin sections were stained with toluidine-blue and examined under a light microscope. Ultrathin sections were placed on mesh grids, contrasted with solutions of lead-citrate and uranyl-acetate, and examined in a JEOL JEM 1200EX transmission electron microscope (TEM).Citation13 Photographs were taken digitally with the iTEM software (Olympus Soft Imaging Solutions, Munster, Germany). The area and perimeter of platelets were analyzed by the iTEM program (Olympus Soft Imaging Solutions, Munster, Germany). Data were obtained by measuring the area and perimeter of 50 platelets from each sample, and then data of upper and lower samples were compared.
Atomic force microscopy
In order to obtain washed platelets (WPL), 0.1 mL of each PRP was pipetted into 10 mL of HBS buffer (HEPES buffered physiological saline, pH 7.4) which contained 1 mM EDTA and 0.1% glucose. After gentle mixing, the platelets were separated by centrifugation (25°C, 2000 g, 5 min). Washing buffer was discarded, and platelets were suspended in HBS containing 0.1% glucose to reach 100 G/L platelet count. Twenty-five microliters of WPL was dropped on freshly cleaved mica and allowed to settle for 20 min, then 0.025 mL of 2% glutaraldehyde diluted with HBS was dropped on the top of the platelet suspension and fixation continued for 30 min.Citation25 Finally, the surface was washed with Milli-Q water and dried with a stream of high-purity N2 gas. AFM images of the fixed and dried platelets were acquired with a Cypher ES atomic force microscope (Asylum Research, Santa Barbara, CA) in non-contact mode (AC mode). Scanning in air was carried out by using silicon-nitride cantilevers with a nominal spring constant of ~42 N/m and a resonance frequency of ~300 kHz (OTESPA-R3, Bruker, Billerica, MA). Free amplitude and setpoint were set to 1 and 0.7 V, respectively. Image data analysis was performed by using the software toolkit of the AFM driver program (based on Igor Pro 6.34 A, Wavemetrics, Lake Oswego, OR). Platelets in the AFM images were analyzed using the Igor AR 16 software for volume and height at the center of the objects.
Statistical analysis
Data were evaluated using the SPSS software package (Version 19.0, SPSS Inc, Chicago, USA). Categorical data were summarized by means of absolute and relative frequencies (counts and percentages). Quantitative data were presented as median and 25th−75th percentiles, as well as mean ± SD. The Kolmogorov–Smirnov test was applied to check for normality. The Student’s t-test and Wilcoxon Signed Rank or Mann–Whitney U tests were used for normally and non-normally distributed variables, respectively. Correlation analysis was performed by calculating Spearman’s correlation coefficient (rho). A p-value < .05 was considered to establish statistical significance.
Results
We present here the gravity sedimentation properties of platelets by applying our modified whole blood gravity sedimentation technique (). A total of 21 healthy nonsmoking subjects (age 36 ± 12 years, male/female ratio 12/9) were recruited for the analysis. Basic platelet parameters in whole blood are summarized in . After a 1-h gravity sedimentation, the upper fraction of the blood column contained significantly more platelets than the lower fraction (mean ± SD: 285 ± 132 G/L vs 88 ± 33 G/L, p = .003), and the PAR value, calculated with equation 1, was mean ± SD: 50.84 ± 18.76% (min: 17.6, max: 89.0). These results clearly demonstrate an antisedimentation phenomenon of platelets. Both the absolute IPF and the percentage of H-IPF were significantly higher in the upper fraction than in the lower one (p = .003, p = .021 respectively). By contrast, the MPV showed no significant difference. The PAR showed an inverse correlation with the absolute platelet number and IPF in the lower samples (r = −0.603, p = .001 and r = −0.588, p = .002 respectively). However, the PAR correlated neither with MPV and LCR nor H-IPF.
Table I. Bulk characteristics and aggregability of platelets after 1-h gravity sedimentation.
Time-dependent measurements of platelet antisedimentation
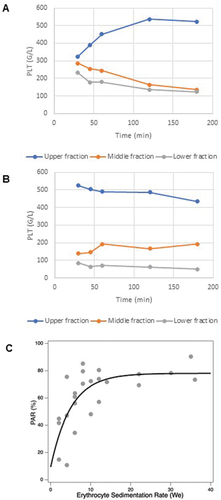
To explore the mechanisms of platelet antisedimentation, we carried out time-dependent (30, 45 min, 1, 2, and 3 h) measurements of platelet count (PLT) in three equal fractions (upper, middle, and lower) of the sedimenting blood sample (). In the case of normal ESR, PLT progressively increased in the upper fraction at the expense of the middle and lower fractions (). In the case of high ESR, PLT was already large in the upper fraction and low in the middle and lower fractions by 30 min. Then, in the following time period, PLT changed little in these fractions (). shows the association between the PAR and ESR. Two main notions can be made. First, PAR is positive across the entire ESR range, indicating that the majority of platelets migrate into the upper fraction under the effect of 1 g gravitation, instead of the lower fraction. Second, there is a strong positive functional relationship between PAR and ESR in the normal ESR range (<15), but PAR stays at a maximum value (~80%) above an ESR of 15. Altogether, the ESR-dependent PAR data () support the time-dependent measurements of PLT ().
Figure 2. Platelet sedimentation kinetics and its association with ESR. Cell counts from three equal fractions (upper, middle, and lower respectively) of the sedimented blood which were separated at five different time points (30, 45 min, and 1, 2, 3 h). (A) Platelet count as a function of time in a subject with physiological ESR; (B) platelet count as a function of time in a subject with high ESR; (C) PAR as a function of we in a cohort of 21 subjects. The data were fit with a monoexponential function with a plateau value of 78.113 (±6.94 SD) and a decay constant of 5.0245 (±2.42 SD).
Functional assessment of platelets
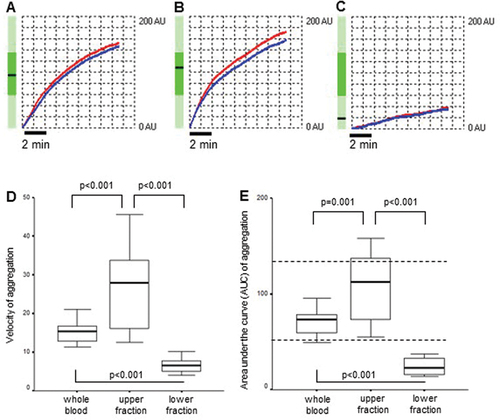
The function of platelet populations was analyzed with platelet aggregometry. The aggregation of platelets in whole blood was analyzed immediately after sample collection, whereas platelet aggregation in the upper and lower samples was measured after the 1-h exposure to gravity sedimentation. depicts representative platelet aggregometry curves obtained on whole blood (A), the upper (B) and the lower (C) samples. The whole blood aggregation expressed in AUC, the arbitrary aggregation unit, and the velocity showed significant differences when compared either to the upper or lower samples separated after 1-h gravity sedimentation (p < .001) (). The differences in AUC values and velocities between whole blood, upper and lower samples were also significant (all, p < .001) (). Remarkably, AUC measured in the upper samples in 38% of healthy individuals (n = 8) exceeded the top of the normal range (AUC: 53–122), suggesting that impedance aggregometry shows ex vivo an increased ADP-induced aggregation capability of upper faction platelets compared to the lower fraction platelets (). In contrast, lower-sample sedimenting platelets seemed to be not activated by ADP ex vivo (); however, this phenomenon can be the consequence of the low platelet count in the lower sample. Therefore, next, we investigated whether the segregated platelet populations differ in the concentration dependence of their aggregation. In other words, it is not enough to simply dilute the upper fraction to a lower value, but a dilution series should have been prepared for both fractions with own platelet-free plasma, and the concentration dependence curves of the aggregation were analyzed (Supplement Table). Based on these, it seemed clear that it was a platelet concentration-dependent dilution effect. To exclude this type of bias, the function was also expressed by the AUC to platelet count ratio, respectively. Notably, the difference in the AUC/PLT ratios remained significant among the upper sample to either whole blood or lower sample (p < .001, p = .042, respectively, ).
Figure 3. ADP-induced platelet aggregation. A–C depicts representative platelet aggregometry curves obtained on whole blood (A), the upper (B) and the lower (C) samples, to demonstrate the curve(s) of the bedside multiplate readings (all measurements provided in duplicate). Red and blue traces refer to two independent measurements. Vertical axis: AU stands for arbitrary unit. Horizontal axis: time (sec). Initial velocity (D) and area under the curve (AUC = arbitrary unit × time) (E) measured by whole blood impedance aggregometry in whole blood from healthy subjects (n = 21) and the upper and lower fractions separated after 1-h gravity sedimentation. Data are shown as median and 25th−75th percentiles (Wilcoxon signed rank test). The horizontal dotted lines mark the normal range of AUC given by the manufacturer.
Unsurprisingly, PAR showed significant negative correlations with AUC, aggregation, and velocity measured in the lower samples (r = −0.661, p < .05, r = −0.700, p = .01, r = −0.636, p < .05 respectively).
Structural analysis of platelets
After a 1-h gravity sedimentation, platelets of healthy subjects from the lower and upper fractions were analyzed by transmission electron microscopy (TEM). Low-magnification images revealed the morphology and differences in both size and number of platelets in the lower and upper fractions. The area and perimeter of platelets were significantly greater in the upper fraction than in the lower one measured with the help of the iTEM program (<0.001 respectively) (). Higher magnification of platelets revealed the alpha- and dense granules used for quantification. Platelets in the upper samples contained 1.6 times more alpha granules compared to platelets in the lower samples evaluated by TEM (). To obtain information about the global shape and size of platelets, we carried out AFM measurements. We observed dendritic platelet shape () with filiform pseudopod formation, indicating that the platelets were viable. The difference in the size of the platelets from the lower (L) and upper parts (U) of the sedimented blood was visible in all cases. Characteristic amplitude-contrast AFM images of platelets shown in demonstrated that platelets in the lower part were smaller (A) than in the upper part (B). Particle analysis allowed us to quantitate the differences. The mean platelet volume was 1.0 fL (SD = 0.60 fL, n = 44) from the lower sample (C) of the blood and 1.6 fL (SD = 0.45 fL, n = 34) from the upper sample. The median height in the center of the platelets was 460 nm in both halves of the separated blood samples (D).
Figure 4. Electron microscopy of platelets. TEM images of platelets of healthy subjects from the lower (A and C) and upper (B and D) fractions. The arrow in C and the asterisk in D point at an alpha-granule and a dense granule, respectively.
Figure 5. Atomic force microscopy of platelets. Amplitude-contrast AFM images of mica-adsorbed washed platelets from the lower (A) and upper (B) fractions. Scale bar 2 µm. Insets show height-contrast AFM images of representative platelets. Scale bar 0.5 µm. Comparison of the volume (C) and central height (D) of the platelets from the different fractions.
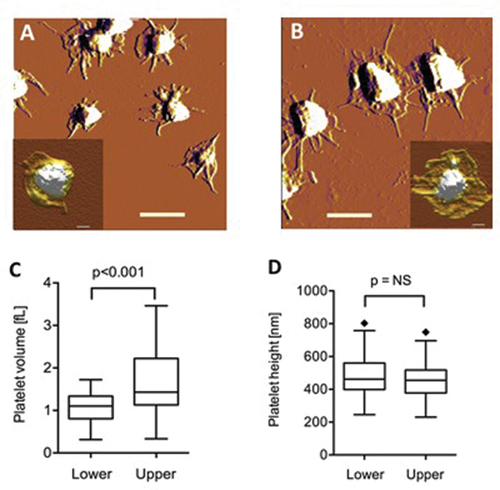
Table II. Transmission electron microscopy data of platelets after one-hour gravity sedimentation.
Discussion
In the present work, we investigated the mechanisms and driving forces behind antisedimentation of human blood platelets and the possible implications of this phenomenon on platelet structure and function. The salient findings may be summarized in the following: (i) a simple method was developed to quantitatively assess the ensemble displacement of platelets in a 1 g gravitational field by analogy of the erythrocyte sedimentation rate (ESR); (ii) the introduced parameter, named platelet antisedimentation rate (PAR), reflects the en masse deviation, in percent value, of the platelets from the midline of the blood column following a 1-h gravity sedimentation; (iii) the antisedimentation process is driven by the overall lower density of platelets than that of blood plasma, and it is assisted by a size-exclusion mechanism facilitated by the sedimenting and compacting red blood cells; and (iv) platelets are segregated into two populations according to structure and function: the ascending, upper-fraction platelets are larger and hence have lower density, contain more alpha granules, are more immature, and display greater aggregability than the lower-fraction ones. Regarding function, we should note that although the lower and upper fractions of platelets differ in their structural properties, the differences in aggregation properties are apparently influenced primarily by the local platelet concentration.
The direction and speed of motion of a particle suspended in bulk fluid in a gravitational field is dictated by its density relative to that of the surrounding fluid. The positive value of PAR in healthy humans (, ), hence the upward displacement of platelets in the blood column, indicates that the average density of platelets is lower than that of blood plasma. However, a certain amount of platelets remain in the lower fraction (), suggesting that low- and high-density platelet populations can be segregated. We also found that PAR scales with ESR in the normal ESR range (), indicating that the sedimentation of red blood cells somehow contributes to the platelet antisedimentation phenomenon. Plausibly, the compaction of the plasma space available for the platelets, which is caused by red blood cell sedimentation, leads to the exclusion of the platelets toward the upper part of the blood column. Thus, platelet antisedimentation, which is primarily driven by density difference, is assisted by a size-exclusion mechanism.
Considering that density is the ratio of mass and volume, there may be two possible mechanisms leading to a change in platelet density: change in platelet mass, or platelet volume. As the mass of platelets is extremely difficult to measure directly, we assessed their volume by using biophysical methods. The mean volume was estimated by light scattering (MPV), and the volume of individual particles was estimated from their diameter by using EM and from global shape analysis by using AFM. Although there was no significant difference between the MPV of the upper and lower fractions (), measurements of size by EM () and AFM () indicated that platelets in the upper fraction are larger than those in the lower one. Conceivably, MPV showed no difference because light scattering depends strongly on particle shape which is generally assumed to be spherical. However, platelets are not at all spherical but display elongated filopodial extensions on their surface (see and ), which are averaged out by the MPV method. In other words, small platelets with many long filopodia appear similar in volume, by the MPV measurement, to platelets with few short filopodia. Lamellipodia and filopodia formation can be explained by the partial activation of platelets from the droplets of its suspension during the binding to the mica surface. This finding is similar to platelet adhesion and spreading on glass surface,Citation26 where Ca2+ is available. Altogether, platelets were segregated in the gravitational field into two populations. The majority (up to ~80%) of the platelets constitute a large-volume, hence low-density population, which becomes antisedimented. By contrast, a smaller population comprises small-volume, hence high-density, platelets which become sedimented.
To uncover functional differences between the segregated platelet populations, we carried out electrode impedance aggregometry. High-volume platelets have been shown to be more prone to aggregation. Whether this, indeed, can be considered hyper-aggregation based on a measurement with a standardized instrument alone is difficult to determine, as aggregation capacity is a parameter validated and confirmed for the whole blood. EM measurements showed an increased number of alpha granules in platelets in the upper fraction, which may explain their increased aggregation capacity due to an increased propensity to release procoagulant molecules. In addition, PAR showed an inverse correlation with IPF in the lower sample, but not with other platelet parameters. It may provide some clinical perspectives as a marker of thromboinflammatory pathology where the role of IPF was already confirmed.Citation26
Limitations of the study. The significant negative correlations between AUC, aggregation, and velocity of platelets measured in the lower blood samples and PAR reflect associations between PAR and platelet function; however, it should be critically evaluated and further explored as AUC, aggregation, and velocity are platelet count-dependent parameters. Similarly, impedance aggregometry revealed an increased ADP-induced aggregation (AUC) of the upper sample platelets, which remained significant also when normalized parameters (AUC/PLT ratio) were compared to either the whole-blood or the lower sample platelets. This finding is in accordance with other reports showing that immature platelets are presumed to be pro-thrombotic and hyperactive compared to mature ones.Citation27 The large number of alpha granules revealed by EM in the upper-fraction platelets also suggest that they may be younger.Citation15 Historically, other platelet separation methods have also shown differences in platelet aggregation characteristics, suggesting that larger platelets may be functionally more active than smaller ones.Citation17 In theory, the differences in the aggregability of the upper- and lower-sample platelets may point to (or indicate) functional differences. The hypothesis that sinking, older platelets have already released their thromboinflammatory molecules from the alpha granules and thus already lost their capability for ex vivo activation in the presence of exogenous ADP should be further elucidated as impedance aggregometry readings depend on platelet count. There was an attempt to exclude such bias in platelet count by using the ratio of AUC to platelet count, thus specific for platelet function.Citation28 In general, the fact that impedance aggregometry uses unprocessed whole blood may implicate that there is no correction for platelet count. In contrast, in our study, the platelet count of the upper- and lower-sample differed significantly, therefore the function was also expressed by the AUC to platelet count ratio and the difference remained significant between the upper fraction and whole blood (p < .001). Importantly, light transmission aggregometry also showed difference comparing the upper vs lower fractions when ADP was used as an agonist (data not shown). Here, we also corrected the agonist concentration to counterbalance the disproportionality of the platelet counts in the upper and lower fractions.
Finally, our data show that AUC/platelet count for expressing the results of whole blood platelet aggregation measured by Multiplate may solve the problem of the confounding effect of platelet count but, at the same time, amplifies the additional confounding effect of MPV and other factors.Citation29 For patients with more severe thrombocytopenia, which would also affect the results obtained by LTA, alternative, surrogate methods should be used, such as, for instance, flow cytometry.Citation29 Overall, we agree that the lower the platelet count in the examined sample, the more we have to take into account the distortion of the result, so new innovative methods are necessary.
In conclusion, platelet antisedimentation rate (PAR) is an easily measurable parameter that may be useful for assessing platelet function. The range of PAR in apparently healthy subjects, according to our study, is about 18–89%. PAR may be of diagnostic significance in patients with various cardiovascular and inflammatory diseases.Citation30,Citation31 PAR may also be utilized in clinical experiments to identify and measure the responsiveness of platelets to antiplatelet drugsCitation26 and functional effects.Citation32 Further studies will undoubtedly uncover the full scope of PAR’s association with a broad range of clinical outcomes.Citation26,Citation31–33
Author contributions
Conceptualization, E.E., M.K., A.K., and T.M.; methodology, J.H., M.T., A.M., H.A., R.B., I.P.; validation, M.K., A.K., and T.M.; formal analysis, T.M.; investigation, E.E., D.S., A.M., H.A., J.H., R.B., I.P., and M.T.; resources, M.K.; data curation, T.M.; writing–original draft preparation, T.M.; writing–review and editing, M.K. and A.K.; visualization, J.H. and H.A.; supervision, M.K. All authors have read and agreed to the published version of the manuscript.
Institutional review board statement
The study was conducted in accordance with the Declaration of Helsinki and was approved by the University of Pécs Clinical Centre Regional and Institutional Research Ethics Committee (Ref. number: 6735, Clinical Trial No: NTC03679858).
Informed consent statement
Informed consent was obtained from all subjects involved in the study.
Supplementary Material
Download PDF (597.5 KB)Acknowledgments
The authors are thankful for valuable comments and EM images of Professor László Seres.
Disclosure statement
No potential conflict of interest was reported by the author(s).
Data availability statement
The data presented in this study are available on request from the corresponding author.
Supplementary material
Supplemental data for this article can be accessed online at https://doi.org/10.1080/09537104.2023.2298341
Additional information
Funding
References
- Wang Y, Andrews M, Yang Y, Lang S, Jin JW, Cameron-Vendrig A, Zhu G, Reheman A, Ni H. Platelets in thrombosis and hemostasis: old topic with new mechanisms. Cardiovasc Hematol Disord Drug Targets. 2012;12(2):126–10. doi: 10.2174/1871529x11202020126.
- Olie RH, van der Meijden PEJ, ten Cate H. The coagulation system in atherothrombosis: implications for new therapeutic strategies. Res Pract Thromb Haemost. 2018;2(2):188–98. doi:10.1002/rth2.12080.
- Semple JW, Freedman J. Platelets and innate immunity. Cell Mol Life Sci. 2010;67(4):499–511. doi:10.1007/s00018-009-0205-1.
- Semple JW, Italiano JE Jr, Freedman J. Platelets and the immune continuum. Nat Rev Immunol. 2011;11(4):264–74. doi: 10.1038/nri2956.
- Machlus KR, Italiano JE Jr. The incredible journey: from megakaryocyte development to platelet formation. J Cell Biol. 2013;201(6):785–96. doi: 10.1083/jcb.201304054.
- Noris P, Melazzini F, Balduini CL. New roles for mean platelet volume measurement in the clinical practice? Platelets. 2016;27(7):607–12. doi:10.1080/09537104.2016.1224828.
- Krekels JPM, Verhezen PWM, Henskens YMC. Platelet aggregation in healthy participants is not affected by smoking, drinking coffee, consuming a high-fat meal, or performing physical exercise. Clin Appl Thromb Hemost. 2018;25:1–9. doi:10.1177/1076029618782445.
- Blair TA, Michelson AD, Frelinger AI. Mass cytometry reveals distinct platelet subtypes in healthy subjects and novel alterations in surface glycoproteins in glanzmann thrombasthenia. Sci Rep. 2018;8(1):10300. doi:10.1038/s41598-018-28211-5.
- White JG. Electron microscopy methods for studying platelet structure and function. Methods Mol Biol. 2004;272:47–63. doi:10.1385/1-59259-782-3:047.
- Thompson CB, Eaton KA, Princiotta SM, Rushin CA, Valeri CR. Size dependent platelet subpopulations: relationship of platelet volume to ultrastructure, enzymatic activity, and function. Br J Haematol. 1982;50(3):509–19. doi:10.1111/j.1365-2141.1982.tb01947.x.
- Thomas MR, Storey RF. The role of platelets in inflammation. Thromb Haemost. 2015;114(3):449–58. doi: 10.1160/TH14-12-1067.
- Moenen FCJI, Vries MJA, Nelemans PJ, van Rooy KJM, Vranken JRRA, Verhezen PWM, Wetzels RJH, Ten Cate H, Schouten HC, Beckers EAM, et al. Screening for platelet function disorders with Multiplate® and platelet function analyzer. Platelets. 2017;14:1–7. doi:10.1080/09537104.2017.1371290.
- Chen D, Uhl CB, Bryant SC, Krumwiede M, Barness RL, Olson MC, Gossman SC, Damgard SE, Gamb SI, Cummins LA, et al. 2018. Diagnostic laboratory standardization and validation of platelet transmission electron microscopy. Platelets. 29(6):574–582. doi: 10.1080/09537104.2018.1476682.
- Chamberlain KG, Froebel M, Macpherson J, Penington DG. Morphometric analysis of density subpopulations of normal human platelets. Thromb Haemost. 1988;60(1):44–9. doi: 10.1055/s-0038-1647632.
- Corash L, Costa JL, Shafer B, Donlon JA, Murphy D. Heterogeneity of human blood platelet subpopulations: III. Density-dependent differences in subcellular constituents. Blood. 1984;64(1):185–93. doi: 10.1182/blood.V64.1.185.185.
- van Oost BA, Timmermans APM, Sixma JJ. Evidence that platelet density depends on the α-granule content in platelets. Blood. 1984;63:482–5. doi:10.1182/blood.V63.2.482.482.
- Polanowska-Grabowska R, Raha S, Gear ARL. Adhesion efficiency, platelet density and size. Br J Haematol. 1992;82(4):715–720. doi:10.1111/j.1365-2141.1992.tb06949.x.
- Joergensen MK, Bathum L. Reference intervals for mean platelet volume and immature platelet fraction determined on a Sysmex XE5000 hematology analyzer. Scand J Clin Lab Invest. 2016;76(2):172–176. doi: 10.3109/00365513.2015.1124448.
- Handtke S, Steil L, Greinacher A, Thiele T. Toward the relevance of platelet subpopulations for transfusion medicine. Front Med. 2018;5:17. doi:10.3389/fmed.2018.00017.
- Bogar L, Tekeres M. Leukocyte flotation during gravity sedimentation of the whole blood. Clin Hemorheol Microcirc. 2000;22:29–335.
- Bogar L, Molnar Z, Kenyeres P, Tarsoly P. Sedimentation characteristics of leucocytes can predict bacteraemia in critical care patients. J Clin Pathol. 2006;59(5):523–5. doi: 10.1136/jcp.2005.033035.
- Molnar T, Peterfalvi A, Szereday L, Pusch G, Szapary L, Komoly S, Bogar L, Illes Z. Deficient leukocyte antisedimentation is related to post-stroke infections and outcome. J Clin Pathol. 2008;61(11):1209–13. doi: 10.1136/jcp.2008.059840.
- Rozanovic M, Csontos C, Bogár L, Szélig L, Bocskai T, Kovács P, Matancic M, Miseta A, Loibl C. Can leukocyte antisedimentation rate (LAR) predict septic complications and critical care survival early in polytrauma and burn victims? Clin Hemorheol Microcirc. 2016;64(4):875–85. doi: 10.3233/CH-168024.
- Schrick D, Ezer E, Tokes-Fuzesi M, Szapary L, Molnar T. Novel predictors of future vascular events in post-stroke patients-a pilot study. Front Neurol. 2021;12:666994. doi: 10.3389/fneur.2021.666994.
- White GC 2nd, Scarborough DE, Brinkhous KM. Morphological study of early phases of platelet adhesion to foreign surfaces: effect of calcium. Ann N Y Acad Sci. 1983;416:351–62. doi:10.1111/j.1749-6632.1983.tb35198.x.
- Ezer E, Schrick D, Tőkés-Füzesi M, Szapary L, Bogar L, Molnar T. A novel approach of platelet function test for prediction of attenuated response to clopidogrel. Clin Hemorheol Microcirc. 2019;73(2):359–369. doi: 10.3233/CH-190580.
- Martin JF, Plumb J, Kilbey RS, Kishk YT. Changes in volume and density of platelets in myocardial infarction. British Med J. 1983;287(6390):456–459. doi: 10.1136/bmj.287.6390.456.
- Soliman M, Hartmann M. Multiplate® platelet aggregation findings are dependent on platelet count but can be corrected by use of a ratio. Appl Sci. 2020;10(22):7971. doi: 10.3390/app10227971.
- Scavone M, Podda GM, Tripodi A, Cattaneo M. Whole blood platelet aggregation measurement by Multiplate™: potential diagnostic inaccuracy of correcting the results for the sample platelet count. Platelets. 2023;34(1):2156493. doi:10.1080/09537104.2022.2156493.
- Hoffmann JJML. Reticulated platelets: analytical aspects and clinical utility. Clin Chem Lab Med. 2014;52(8):1107–17. doi: 10.1515/cclm-2014-0165.
- Bernlochner I, Goedel A, Plischke C, Schüpke S, Haller B, Schulz C, Mayer K, Morath T, Braun S, Schunkert H, et al. 2015. Impact of immature platelets on platelet response to ticagrelor and prasugrel in patients with acute coronary syndrome. Eur Heart J. 36(45):3202–10. doi: 10.1093/eurheartj/ehv326.
- Handtke S, Steil L, Palankar R, Conrad J, Cauhan S, Kraus L, Ferrara M, Dhople V, Wesche J, Völker U, et al. Role of platelet size revisited-function and protein composition of large and small platelets. Thromb Haemost. 2019;119(3):407–20. doi:10.1055/s-0039-1677875.
- Lev EI. Immature platelets: clinical relevance and research perspectives. Circulation. 2016;134(14):987–988. doi:10.1161/CIRCULATIONAHA.116.022538.