
Abstract
Competitive landscape, informed consumers and stringent regulations have forced many manufacturing small- and medium-sized enterprises (SMEs) to focus on operational efficiency along with sustainability issues in recent years. While many manufacturing organisations have been taking lean initiatives for the past few years for operational excellence, an impulsive rush to adopt lean without a strategic deployment vision has led to scattered implementation of lean tools and projects without desired success. Many researchers and practitioners prescribe value stream mapping as a foundation for lean transformation initiatives; however, little empirical work is available on the symbiosis of lean and green paradigms to reap maximum benefits. This research, through a systematic methodology and a novel tool called Green Integrated Value Stream Mapping (GIVSM), integrates both paradigms in a case study on a U.K. packaging-manufacturing SME. Applying the GIVSM demonstrates that simultaneous deployment of lean and green paradigms have synergistic effect for improving both operational efficiency and environmental performance. In addition, continuous improvement framework with sustainable procurement is proposed to overcome the lean-green misalignments. This study also provides a guiding reference for practitioners to undertake similar improvement projects and identifies opportunities to expand this academic research on integrated lean-green approach into other industry sectors.
1. Introduction
There have been increasing pressures on manufacturing organisations from climate change, depleting natural resources, rising population, stricter government regulations for carbon and hazardous waste management to improve their environmental performance. Moreover, competitive landscape coupled with informed customers are adding more pressure on manufacturing small- and medium-sized enterprises (SMEs) to align their business strategies and operations in a way, which simultaneously improves financial and environmental performance (Thanki and Thakkar, Citation2016; Dora, Kumar, and Gellynck Citation2016). Garza-Reyes (Citation2015) reviewed 59 journal articles and highlighted the increased importance for industries, irrespective of their size, to incorporate lean and green strategies either simultaneously or sequentially for achieving operational excellence and enhancing environmental performance to remain competitive in global markets. However, Moorthy et al. (Citation2012) finds that most SMEs have not engaged in good green practices owing to their small or medium size, low revenue and lack of resources. Previous research also reports that the key barriers to encouraging SMEs to go green are costs and green technical knowledge (Agan et al. Citation2013; Ghadge, et al. Citation2017). Therefore, this research aims on developing a simple tool to measure and improve both operational and green performance without any large capital expenses or strong technical knowledge.
In manufacturing, the raw material is converted into useful products through a series of value and non-value added processes, each of which consumes resources in terms of material, energy, time and human efforts (Thanki and Thakkar Citation2016). These resources are not just valuable from a financial perspective, but also from the environmental perspective. Therefore, simultaneously utilising these resources efficiently by eliminating non-value added activities and minimising the environmental impact could help in assessing the sustainable performance of a firm (Yu, Ting, and Jim Wu Citation2009).
A Value Stream Mapping (VSM) is one of the most popular lean manufacturing tools, which differentiates between value adding and non-value adding activities. A value stream is a collection of activities, which brings a product (or a group of products that use the same resources) through the main flows, starting with raw material and ending with the customer (Rother and Shook Citation1999). It highlights the operating procedure and resource utilisation in terms of ‘time’, but ignores the amount of environmental impact those activities generate, which is important for evaluating the sustainability of a production line (Faulkner and Badurdeen Citation2014). Though lean manufacturing aims to minimise waste by reducing lead time and non-value adding activities, efficient utilisation of carbon, in the form of energy and materials along with the reduction in carbon from material waste, is equally important to focus while planning for improvement (Kurdve et al. Citation2015; Thanki and Thakkar Citation2016). While lean helps to identify and eliminate waste (Klotz, Horman, and Bodenschatz Citation2007), it does not always consider environmental impacts associated with it (Pampanelli et al. Citation2014). Therefore, organisations have initiated and implemented green operations to fill that void (Sharrard, Matthews, and Ries Citation2008; Li, Zhu, and Zhang Citation2010; Ng, Low, and Song Citation2015). Several earlier studies have discussed and investigated the relationship between lean and green by highlighting potential benefits of their integration in different contexts (King and Lenox Citation2001; Franchetti et al. Citation2009), their impact on organisation’s performance, and their theoretical integration (Bergmiller and McCright Citation2009; Cherrafi et al. Citation2016). However, no pragmatic integration could be found where lean and green value streams are integrated to map, measure and improve operational and environmental performances synergistically. In addition, the review of the available literature reveals that, currently there is a lack of simple tool, which can be used to integrate both operational and environmental value streams to throw light on potential improvement opportunities for manufacturing SMEs. Measuring carbon footprint across the whole process map and incorporating it with the traditional VSM could help in visualising the opportunities for improving operational and environmental performance, simultaneously.
The lack of availability of such a simple tool, which integrates traditional VSM with value stream mapping of the carbon footprint from material, energy, transportation to generation of recyclable and unrecyclable wastes, provides a strong rationale to develop a tool for evaluating lean and green performance of manufacturing SMEs. The availability of such a tool could be of high practical importance for SMEs, which face lack of resources to invest large amounts in establishing advanced performance measurement systems. In the U.K., more than 99% (5.2 million) of enterprises are SMEs, producing approximately 110 million tonnes of carbon emissions (Ward and Rhodes Citation2014). Any attempt towards decreasing carbon footprint in manufacturing processes and improving productivity creates substantial opportunities for SMEs to enhance their sustainability performance. It is imperative to note that effective waste reduction can only be achieved by minimal resource (carbon) consumption, without compromising the value of the product. Efforts should be made towards decreasing the overall carbon footprint in the process by utilising resources efficiently and reducing the amount of waste generation (Thanki and Thakkar Citation2016). However, the method of evaluating the current state of lean and green performance of the production process using a conventional tool and to identify improvement areas for efficient utilisation of carbon is still unclear. However, the present work aims to introduce a novel tool the ‘Green Integrated Value Stream Mapping’ (GIVSM) to measure both operational efficiency and carbon footprint (environmental performance) of the production system, and to identify improvement opportunities for minimising lean and green wastes. Specific objectives to achieve the overall aim are:
To develop GIVSM, consisting of value-added and non-value-added carbon footprint as a green performance indicator along with cycle time and lead time in the product manufacturing process as a measure of operational efficiency.
To explain the gradual steps for implementing the GIVSM easily and pragmatically to help organisations improve their operational and environmental performance.
And to discuss, how the GIVSM can be integrated with a continuous improvement cycle to sustain ongoing improvements to their operational and environmental performance.
The rest of the article is organised as follows: Section 2 provides a literature review on the different kinds of lean and green waste along with latest advancements in adoption of these paradigms in the manufacturing sector, with a particular focus on packaging–manufacturing SMEs. Research design and methodology for developing the GIVSM is described in Section 3 along with concepts and tools used for improving the operational efficiency and environmental performance of the case company. Section 4 describes the case study with the current and future state of GIVSM. Section 5 discusses the contribution of this research to the literature and practice and Section 6 presents the conclusion.
2. Literature review
Improving environmental performance along with maintaining operational efficiency and cost-effectiveness are some of the key challenges affecting the future competitiveness of many manufacturing SMEs (Moorthy et al. Citation2012). The challenge is even more, when such firms use batch production system. In a batch production system, small quantities of product/output are processed in the same step as before proceeding to the next process step in batch (Parthanadee and Buddhakulsomsiri Citation2014). Such a production system is used by numerous SMEs in many industries, as it caters to the requirement of production process or nature of products, which define the technology used and other demands. Additionally, it requires low capital investment compared with continuous production lines, which often involve automatic machines and conveyors. However, as this system is manually operated, it comprises a large number of non-value added activities that affect both environmental performance and operational efficiency (Parthanadee and Buddhakulsomsiri Citation2014). The non-value added activities can be considered as ‘waste’ as they are not adding any value in the operational process, supply chain or to customers (Whicker et al. Citation2009).
Lean thinking approach helps in eliminating waste systematically, by developing an operation that is faster and more dependable, produces higher quality products and services and above all, operates at low cost (Slack et al. Citation2004). Such an approach can also be used for efficient utilisation of various resources that can aid in reducing environmental impact (Balinski and Grantham Citation2013). Taiichi Ohno (Toyota chief engineer) identified seven types of industrial wastes or non-value added activities by adopting lean thinking and principles ().
Table 1. Seven lean wastes.
In addition, Wills (Citation2009) states that green wastes concept can be helpful for both environmental and financial evaluations. There are seven green wastes, which can be seen in . Although a good environmental system is considered more than a by-product of lean, there are many more lean tools that can eliminate environmental waste and integrate environmental management, which can further encourage product and process innovations thereby helping business growth opportunities in future.
Table 2. Seven Green wastes.
Implementation of lean principles without considering its impact on environmental performance could reap negative ecological results (Garza-Reyes Citation2015; Garza-Reyes et al. Citation2016). For instance, sometimes lean supply chains employing Just-in-Time approach (Womack and Jones Citation1996) involving smaller and more frequency deliveries can produce higher CO2 emissions and energy consumption, particularly when covering long distances among facilities (Venkat and Wakeland Citation2006). Lean and green strategies are often seen as compatible initiatives due to their joint focus on waste reduction, but it is critical to understand the synergies between these two paradigms when deployed simultaneously/sequentially (Dües, Tan, and Lim Citation2013). It is equally important to address key trade-offs (or misalignments) that may arise when there are incompatibilities among strategic initiatives.
Due to above-mentioned challenges, many companies face challenege while integrating and implementing lean and green strategies, various frameworks have been proposed earlier to support organisations in their effort. According to Zokaei et al. Citation2013, the relationship between lean and green can be categorised into four different stages. It begins with a trade-off stage where lean and green seem to work unlikely. For example, frequent just-in-time deliveries can decrease inventory risks, while can also increase carbon emissions by frequent use of vehicles. Most enterprises are found in the ambidexterity stage (second stage). In this stage, companies have separated lean and green, so that a balance is achieved between them while do not affect each other adversley. However, companies in this stage do not gain substantial advantage from environmental or economic aspects (Martinez et al. Citation2012). In the third stage (which is a synergy stage), fewer companies have realised that lean and green are not contradictory, but mutually beneficial. When these companies use lean tools to reduce lean wastes, green wastes gets decreased inadvertently. Thus, these firms use an integrated lean and green strategy based on synergies of lean and green. One of the ways to determine this synergy is to find overlaps between the lean and green waste (). Finally, when lean and green becomes a part of the same continuous economic and environmental improvement strategy, then the relationship between lean and green reaches the final stage (symbiosis stage). Various researchers (Dües, Tan, and Lim Citation2013; Garza- Reyes Citation2015; Mollenkopf et al. Citation2010) have explored natural synergies and the compatibility between lean practices and green initiatives. However, only a few researches have focused on integrating these two paradigms in industrial SME scenarios (Rizzi, Frey, Testa and Appolloni Citation2014; Thanki, Govindan and Thakkar Citation2016).
VSM is one of the most popular and practised lean manufacturing tools, which identifies sources of waste within the manufacturing system through understanding the flow of material and information. It visualises the waste across the whole process map using different lean metrics such as value-added time, lead time, cycle time and takt time (Lacerda, Xambre, and Alvelos Citation2016). VSM also develops a synergy for the production process and improves the value stream through facilitating strategic decisions (McDonald et al. Citation2002). Although VSM provides a clear distinction between the value-adding and non-value adding activities in time units, it does not necessarily provide any measure of the environmental impact resulting out of these activities (Thanki and Thakkar Citation2016). Previous researches have provided some variants or extensions of VSM such as green value stream mapping (Wills Citation2009; Dadashzadeh and Wharton Citation2012), the energy value stream mapping or EVSM (Mu¨ller, Stock, and Schillig Citation2014; Bush et al. Citation2014), sustainable value stream mapping (Sus-VSM) (Faulkner and Badurdeen Citation2014) and LCA-integrated VSM (Vinodh et al. Citation2016). While the GVSM visually identifies only the different types of green wastes (as described in ) generated across the process without incorporating any of the lean waste, the Sus-VSM incorporates process metrics such as water, raw material and energy consumption along with societal metrics to capture sustainability performance of the production line (Faulkner and Badurdeen Citation2014). Similarly, LCA-integrated VSM uses 15 indicators to measure environmental, social and economic impact for ensuring sustainable manufacturing (Vinodh et al. Citation2016). Whereas, the EVSM extends value stream mapping concept by incorporating energy consumption during various stages of transportation and manufacturing processes along with time (Mu¨ller, Stock, and Schillig Citation2014).
While there have been various environmental indicators developed through earlier research, but the key challenge remains for both academics and practitioners in identifying and selecting appropriate indicators for benchmarking the processes. Furthermore, it is imperative to narrate the correct magnitude of environmental impact and relevant sustainability performance issues without either overloading end-users with overly complex information or with information that is redundant (Genovese et al. Citation2017). Previous research has suggested that moving beyond a carbon-centric accounting for measuring operational and supply chain environmental performance runs the risk of overloading end-users with complex and often redundant information (Jollands, Lermit and Patterson Citation2004; Gaussin et al. Citation2013; Genovese et al. Citation2017). Genovese et al. (Citation2017) employed correlation analysis and principal component analysis for dimension reduction in environmental measurement and demonstrated that carbon emissions co-relates with most of the other environmental indicators. Thus, carbon footprint can be considered as a core environmental indicator to perform comprehensive environmental assessments without having to engage with unnecessary complex datasets.
An important outcome established through this discussion is that, VSM helps to differentiate between value-adding and non-value-adding activities, which are fundamental concepts of lean manufacturing. However, most VSM extensions or variants have particularly focused their application on large manufacturing firms, which either require complex calculations or other parameters, which could prevent SMEs from implementing such tools to improve their operational and environmental performance. Moreover, some frameworks that have been proposed in previous studies to integrate lean and green strategies have shown similar limitations as the individual lean and green approaches (Garza-Reyes Citation2015). Therefore, there is a need to extend the VSM concept with a simple paradigm and include an implementation framework for continuous process improvement to encourage SMEs to incorporate the integrated lean-green tool for enhancing operational efficiencies and decreasing the overall environmental impact of their business. This makes a strong case for the requirement of a simple tool, which could convert different units of measurement of the green waste into one, and aid SMEs in better integration of lean-green paradigms and facilitate the practical implementation process. In this case, most identified green wastes are converted into one unit of measurement, such as carbon footprint. Taking carbon footprint as a parameter to measure loss of energy, raw material, transportation, emissions and waste creation could help in integrating lean and green waste in a much simpler and more practical way. This could also be useful for any industry to measure, monitor and report their environmental performance.
Table 3. Synergy between lean and green wastes.
3. Research design and methodology
To achieve efficient and environmentally sustainable manufacturing, it is necessary to identify lean and green wastes inherent in processes, analyse their causes, formulate and implement a strategy for waste elimination (Garza-Reyes Citation2015). In this regard, a systematic methodology is followed to integrate lean and green paradigms to enhance operational efficiency while decreasing environmental impact of the studied packaging–manufacturing SME in the U.K. In this methodology, we have simplified the green value stream mapping (Wills Citation2009; Dadashzadeh and Wharton Citation2012) and integrated it with the traditional VSM to derive a novel Green-Integrated VSM (GIVSM) to visualise both lean and green wastes in the value stream. While the GVSM identifies seven green wastes in the form of energy, material, garbage, transportation, emissions, water and biodiversity (see ), it does not consolidate into a single parameter to measure the overall environmental impact. Most of these wastes can be presented in the form of carbon footprint, defined as the total greenhouse gases (GHG) emissions, caused directly or indirectly by person, organisation, activity or product (Carbon Trust Citation2016). It is expressed as a carbon dioxide equivalent (CO2e) and includes six greenhouse gases: CO2, CH4, N2O, SF6, HFCs and PFCs (Wright, Kemp, and Williams 2012).
Since the purpose of building the GIVSM was to keep a simple, yet a practical and useful tool for SMEs, carbon footprint embedded in raw materials, as well as those arising from energy consumption, garbage generation, transportation (including shipping distance for raw material procurement as well as for product delivery) and other CO2e emissions were considered in the calculation of green waste in the GIVSM. Carbon footprint was calculated using a standard formula:
Carbon Footprint = Total Amount Used in Selected Activity * Standard Emission Factor (Source; DBEI, 2016; Appendix 1)
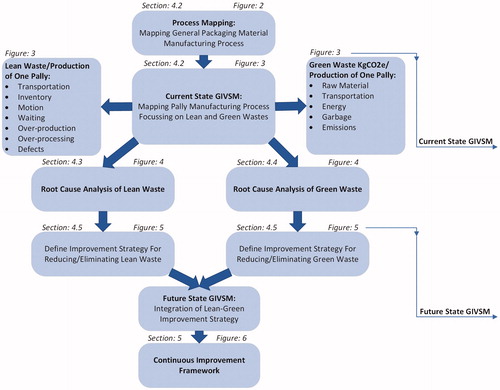
All seven lean wastes in the form of ‘time’ were also identified across the whole manufacturing process while developing the GIVSM. The GIVSM helped in mapping the value stream in the manufacturing process of the studied packaging-manufacturing SME to understand its ‘current state map’, which was one of the first crucial steps of our methodology. A ‘current state map’ of the GIVSM was made using data related to flow of material and information from the supplier end to the customer end for identification of different types of lean and green wastes. After identifying the areas of improvement in the manufacturing process from the current state map of the GIVSM, causes of lean and green wastes were analysed and strategies for improving efficiency and reducing carbon footprint were simultaneously formulated in the following stage (). This simultaneous approach of identifying the synergy between the lean and green wastes and the formulation of holistic continuous improvement strategies were adopted to avert the phenomenon of creating individual strategies as indicated by Norton (Citation2007), where one may negatively affect the other when formulated independently (Garza-Reyes et al. Citation2016). A pilot case study was then conducted to access both operational efficiency and environmental improvement strategies, which served as a platform to provide data for building and validating a ‘future state map’ of the GIVSM before a full-scale deployment of improvement strategies was initiated (). The ‘future state map’ comprised redesigned processes, which after all inefficiencies within the existing production system were eliminated (Schulze et al. Citation2013; Parthanadee and Buddhakulsomsiri Citation2014).
Figure 1. Systematic methodology followed for improving operational efficiency and environmental performance of the case SME.
4. Case study
Integrating lean and green paradigm to yield synergistic results in a continuous improvement cycle has multi-dimensional challenges (Garza-Reyes Citation2015). To get an insight and for a valid analysis of the real situation at the work floor, this study adopted a case study approach. The case study method is the most suitable methodology, which combines both qualitative and quantitative data (Voss, Tsikriktsis, and Frohlich Citation2002). The case study enables a deeper understanding of processes by providing ‘a good picture of locally grounded causality’ (Miles and Huberman Citation1994). The method allows studying the problem and the context to deduce both cause and effect (Leonard-Barton Citation1990). This process aided with studying the phenomenon in its natural setting and focused on contemporary events. A systematic approach () was followed to integrate some of the fundamentals, principles and tools of the lean and green paradigms to improve both the operational and environmental performance of the studied company.
A single detailed case study approach was used in a U.K.-based packaging–manufacturing SME (the case company), where the above-described tool, the GIVSM, was applied to integrate the lean and green paradigms under a research project by a team of lean specialists from industry and academia. A single detailed case study has been validated as a research methodology that is widely used in the field of operations management, particularly for VSM analysis, where the focus of the study cannot be detached from the organisational context where it occurs (Alaya Citation2016; Garza-Reyes Citation2015; Garza-Reyes et al. Citation2016; Parthanadee and Buddhakulsomsiri Citation2014). Such an approach is a helpful methodology for evaluating the applicability of methods and tools geared to improve organisational performance (Kitchenham, Pickard, and Pfleeger Citation1995; Alaya Citation2016). Although a single case study approach could be considered as a limitation to prove the effectiveness of our methodology and the GIVSM tool, findings from its replication in a similar or different industrial context could further generalise and validate the effectiveness (Garza-Reyes et al. Citation2016). Therefore, one of the future research agendas would be to test this methodology, and the GIVSM tool through its implementation in multiple cases studies and different industrial contexts.
4.1. Overview of the case company
The firm under investigation is one of the leading returnable packaging–manufacturing SMEs in the U.K. It manufactures reusable transit packaging products such as pallies, lids, hog boxes and attached lid containers, primarily used by industrial clients. The company’s customer base includes retailers, healthcare companies, transport operators including postal logistics, large manufacturing firms and global automotive manufactures (e.g. Honda, Jaguar Land Rover). The company employs more than 50 people and uses batch production system where small quantities of product/output are processed in the same step as before proceeding to the next process step in batch. The batch production system is commonly used by many SMEs as it requires less capital investment compared with continuous production lines involving automatic machines and conveyors. However, as mentioned before, such system is manually operated and involves a large amount of non-value added activities (wastes), which impact both environmental performance and operational efficiency (Parthanadee and Buddhakulsomsiri Citation2014). Moreover, being a packaging–manufacturing SME and suppliers to many large-scale industrial clients, the company is beginning to come under pressure by its clients’ requirements concerning carbon footprint reduction along the supply chain and by UK’s commitment towards Paris Agreement, 2015. Persuaded by multiple benefits of reducing the environmental impact of its operations in the way of carbon footprint reduction, and its cascading impact on clients' overall carbon footprint, the case company aims to gain a competitive edge over its competitors through a good score in CSR reporting that highlights improvement in environmental performance.
Influenced by the above considerations, the case company decided to initiate this project with a purpose of identifying opportunities to increase its operational efficiency, improve its environmental performance and thereby reducing clients’ overall environmental impact. This provided the authors with an opportunity to undertake a detailed case study in the company using ‘batch-and-push’ production system to identify lean and green wastes across the process, and develop strategies and framework for continuous improvement in its operations and environmental performance.
4.2. Overview of the process map and generation of current state of the GIVSM
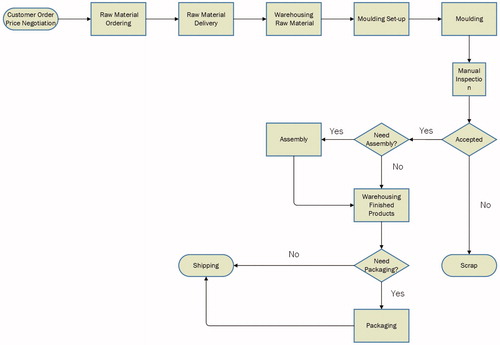
As discussed earlier (), the first step of our methodology consisted of mapping the general packaging material manufacturing processes of the case company. According to (Kurdve et al. Citation2011), process mapping illustrates the movement of materials, products, services and information, helping companies to identify the areas or sub-processes that needs to be improved by clearly showing the transformation from inputs to outputs. presents the generic process map of different components manufactured by the case company. After conducting focus group discussions and analysing five-year (2010–2015) historical data of weekly and annual production schedules, it was found that pallies were the primary product line of the company. It was also found that production process of pallies was the most carbon intensive process and its production demand for pallies was found to be at least twice the demand for any other products. However, in 2014, the company received an annual order of 30,000 units of pallies, and were able to fulfil only 20,480 pallies. All of the above reasons provided a strong case to select pally as the representative product line of the case company.
Figure 2. General packaging products manufacturing process map in the case company.
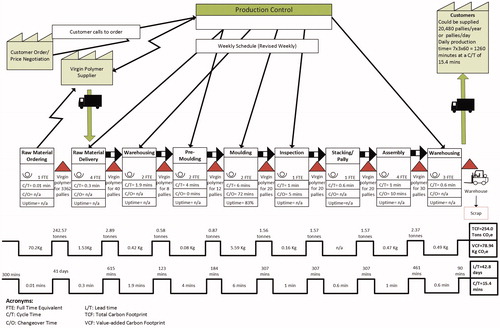
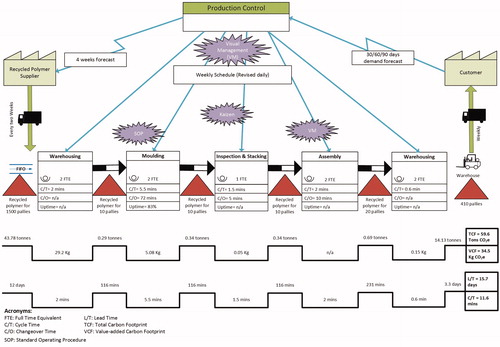
The GIVSM for the current state of the pally production process (shown in ) included the processes from customer order and price negotiation to shipping of finished pallies to customers. The GIVSM maps all important activities of the pally manufacturing process, including their flow and sequence, and different types of lean wastes such as transport, inventory, motion, waiting period and defects in form of ‘time’. It also includes the value-added carbon footprint (VCF) and total carbon footprint (TCF) that includes carbon embedded in different green wastes such as raw material, transportation, energy consumption, garbage (scrap) and other GHG emissions in kg CO2e (). A holistic visualisation of this type provides an actual trigger and offers a challenge for improvement (Garza-Reyes et al., Citation2016; Seth and Gupta, Citation2005). Owing to the above reasoning, the next step of our methodology () involved analysing the causes of lean waste (Section 4.3) and green waste (Section 4.4) by doing Root Cause Analysis (RCA) or fish-bone diagram. Simultaneously, appropriate strategies for minimising those wastes are shown in the future state GIVSM of the pally manufacturing process (Section 4.5).
4.3. Root cause analysis of the lean waste
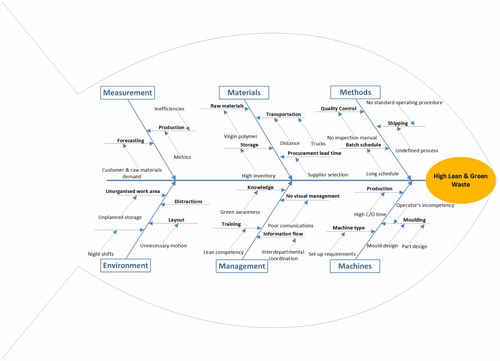
A close examination of the current state value stream of pallies through VSM reveals some bottlenecks in the information flow, process flow and material flows – primarily owing to the lack of advanced management paradigm. The VSM was used to identify lean waste in the form of "time" as its applications are straightforward, and can be directly linked to operational efficiency and are relatively less complicated for simple manufacturing environments like make-to-stock (Braglia et al. Citation2006). Any reduction in lean wastes increases operational efficiency by saving on materials, labour, energy, etc. (Bond Citation1999). However, recent reviews reveal that there is a dearth of VSM applications that address wastes due to process settings, resulting in excessive rework and high cycle time (Singh, Garg, and Sharma Citation2011; Dal Forno et al. Citation2014). Therefore, this study used VSM in a simplistic way to identify wastes and then performed root cause analysis to get to the causes of these wastes. Most of the lean wastes are resultant of the disconnection between processes, the presence of non-value-added activities, large inventories and absence of conformance to lean manufacturing principles. This transfigures into a substantial difference between the total lead time (about 42.8 d) and value-added time (15.4 min), which is 0.02% of the total lead time. The study found five out of seven types of lean wastes existed in the value stream, whereas no substantial evidence was found for wastes resulting out of over-processing and over-production. The RCA of various types of lean wastes points towards inefficiencies mainly in six categories, namely (1) materials, (2) methods, (3) machines, (4) management, (5) measurements and (6) (work) environment.
(1) Materials: The case company uses virgin polymer for manufacturing pallies and procures it from a supplier in Germany. With a make-to-order strategy and absence of demand forecasting, it takes 35 days to manufacture and 7 days to ship the raw materials required for manufacturing pally. This reveals that the major lean waste is the waiting time within the material procurement process after the placement of customer orders, comprising 96% of the non-value added time of the lead time (where manufacturing the raw material takes 35 days and transportation of the material from the supplier to the case company takes 7 days). This has a cascading effect on other lean wastes resulting in high inventory constituting 3.5% of the non-value added time. Also, the absence of any forecast for customer demands resulted in overstock (nearly 60 tonnes per annum) of virgin polymers in the warehouse. Furthermore, finished pallies were stored in their warehouse until a given order (average of 1600 pallies) was completed, again contributing to the inventory, motion and transportation waste. Warehouse functions mainly focused on storage and stacking strategies instead of focusing on flow and speed to decrease inefficiencies. The remaining 0.5% waste was due to unnecessary waiting during the pally manufacturing process. For instance, every shipment received faces an average of 90 minutes of waiting time before stacked in the warehouse.
(2) Methods: Due to the lack of advanced production strategy in the company, the pace of production is still managed by weekly batch schedules, which follows the actual flow of customer demands – too fluctuating to be considered lean. There are no production Kanban loops or visual control systems to manage the production levelling and flow. This leads to stop-and-go pallies traffic with long waiting time, disorderly flows with multiple cross points, long material flows, a high degree of material handling, a large volume of work-in-progress (WIP), multiple storage areas and a lead-time of 42.8 d, despite the short cycle time of 15.41 min. The absence of a single scheduling point defies the lean logic of having a single point of value stream in the scheduling of production for calculating takt time and anticipating resource requirement for standardised work (number of machines, operators, shifts, etc.). The production runs on a weekly schedule that is revised weekly – which leaves scope for missing out on early noticing and mitigating of production disruptions. It was found in the study that the company does not have a robust quality assurance process. It still relies on the post-production traditional quality inspection process to identify defects. The 28,743 DPMO (as discussed below) could further be described as a result of an absence of any quality assurance process in the value stream.
(3) machine: One of the most obvious examples of the lean waste in this process was defects. Defects are mainly attributed to poor part design, poor mould design and operator's incompetency. The company manufactured 20,480 pallies in the year of study (2016), which had 589 defects that translates roughly into 28,743 defects per million opportunities (DPMO) or sigma value of 3.4. Pallies with defects were mostly recycled by remoulding them into the polymer for manufacturing other products and added to the inventory and waiting time. Furthermore, set-up requirements for the type of machine used along with high changeover times also partly contributed towards higher cycle time.
(4) Management: Lack of a system of production control was found to result in unsynchronised material flows through the manufacturing plant and absence of Just-In-Time (JIT) manufacturing strategy, which reduces flow times and increases efficiency within the production system, leads to longer waiting time, large inventories and a longer lead-time. The analysis of information flow reveals numerous wastes at different levels. From receiving a customer call to finalisation of the price results in waiting time. This is followed by placing an order with the supplier, the onuses of which lies with another division that further adds to waiting time and inefficiencies. There is a discord between the process of negotiating price with customers, the final price approval and placing of the order with the supplier, and this wrong sequence of information flow translates into 5 h of waiting time. The company considers price negotiation and customer call as core processes in the value stream (), whereas such a long waiting for finalizing a customer order creates bottleneck in the flow.
(5) Measurement: The ability to measure the performance of operations can be seen as an important prerequisite for developing improvement strategies (Lohman, Fortuin, and Wouters Citation2004). A performance measurement system provides an early risk detection system indicating what has happened, diagnoses reasons for the current situation, and indicates what remedial action should be undertaken (Bond Citation1999). However, the case company did not have in place any robust measurement systems and due to which it lacked timely information for efficient decision-making. Owing to unavailability of clear information about customer demands and raw material demands, it did not have a proper forecasting system to meet product demands in a timely manner. It could only fulfil 20,480 out of 30,000 orders of pallies in year 2014. Moreover, due to lack of measurement of any production or performance metrics, it was uncertain on how to develop improvement strategies and set priorities to achieve them. This was resulting in failure to meet customer orders, long shipping time and face high amount of defects.
(6) Environment: It was concerning to see safety statistics, which could be an important performance indicator within the case company, were not contained in the monthly management report. Safety is a measure of effectiveness as accidents caused disruption (Bond Citation1999). In addition, a healthy work environment can lead to economic growth, and help businesses sustain its efforts to become lean manufacturers (Emiliani Citation1998). From Gemba walk, it could be noticed that the layout of the shop floor was causing unnecessary motions leading to both types of lean wastes, time and motion. The unplanned storage areas blocked the smooth flow of material and were causing distractions for the operators, as confessed by one of the operators. Additionally, one operator cited the night shift as one of the reasons that resulted in low productivity on the shop floor.
Figure 3. Current state GIVSM for pally manufacturing process.
4.4. Root cause analysis of green wastes
The amount of green waste that was generated through carbon emissions and other GHG emissions, calculated as carbon equivalent (CO2e kg or tonnes) based on standard carbon conversion factors for each process (see Appendix 1). As the process that generated the lean waste also generated the green waste, root cause of the later related to process inefficiencies were same as described above (section 4.3). In this section, we only highlighted the additional information related to annual green waste generation. The key green wastes identified in the pally manufacturing process were CO2e embedded in the ‘raw material’ (i.e. virgin polymer) itself (1438 tonnes CO2e per year for producing 20,480 pallies) followed by an average raw material inventory of 3362 pallies producing 243 tonnes CO2e per year, which includes carbon embedded in virgin polymer along with the transportation and energy required to store them for an average of 42 d in the warehouse. As there was no forecasting of customers demand or scheduled delivery, case company dispatched customers’ orders (average 1600 pallies), when the full order was ready. Therefore, product inventory was the third largest carbon footprint hotspot accounting for 126 tonnes CO2e per year. Previous researchers have also reported a strong correlation between inventory and carbon emissions in the manufacturing sector (Bientinesi and Petarca Citation2009; Silbermayr, Jammernegg, and Kischka Citation2017). However, most researches either involved analysis of large secondary dataset for life cycle inventory assessment or complex modelling. This research, therefore, helps in visualising the impact of inventory on both operational efficiencies and environmental performance in a simplistic manner.
Other key green wastes were energy consumed in the moulding process generating 114 tonnes of CO2e for manufacturing 20,480 pallies per year followed by ‘transportation’ or shipment of the raw materials (368 tonnes) from a Germany-based supplier to the U.K. manufacturing plant in 25 trips generating 32 tonnes of CO2e footprint per year. As all defects (589 per year) were moulded back to the recycled polymer and used in manufacturing other components, it generated lowest ‘garbage’ (scrap) green waste of 3.29 tonnes CO2e, involving only the energy used in the remoulding process. Previous researches using extended VSM such as EVSM have also reported the energy consumed during different processes (Mu¨ller, Stock, and Schillig Citation2014; Bush et al. Citation2014). However, converting all the losses (from material to transportation and energy consumption) in the process to one unit of measurement such as carbon footprint helps in understanding the “carbon hotspot” (i.e. process that consumes or yield maximum carbon). This could help in prioritising the strategies to reduce the substantial carbon emissions by focussing on the processes that are major carbon hotspots.
4.5. Pilot test for implementing the improvement strategies for future state GIVSM
As a part of the improvement strategy, a pilot test was run on a single customer order of pally production. Using the results obtained from this pilot study, the future state GIVSM was designed and developed (). While the traditional VSM approach represents how the system would look into the future state map after elimination of waste and inefficiencies (Abdulmalek and Rajgopal Citation2007; Saboo et al. Citation2014), the future state GIVSM also validates the effectiveness of improvement strategies deployed in the pilot study. The company started the pilot run by placing a robust pricing mechanism for ensuring a sequential flow of information in order, taking which reduced the wait time from 5 h to 20 min. The company uses an Enterprise Resource Planning (ERP) system and that was used to automate the raw material procurement process. Additionally, the processes of customer order taking and procurement of raw material were integrated into a single process. Owing to its substantial contribution to the company’s carbon footprint, a strategic decision was taken to select a British supplier over the German supplier, which resulted in reducing the waiting time for delivery from 41 d to 12 d – subsequently reduced the lead-time to 15.7 d. Moreover, this also resulted in saving 1 tonne CO2e per shipment (average order of 15 tonnes raw material per shipment) and 24 tonnes CO2e annually due to the reduction in transportation distance (from average 1500 km to 300 km) resulting out of the switching of supplier from Germany to the U.K. (see Appendix 2).
Figure 4. Root cause analysis (RCA) of lean and green waste.
Furthermore, the carbon factor of a virgin polymer is 2.44 times more in comparison with the recycled polymer (refer Appendix 1), the use of more recycled polymer material is expected to help in reducing carbon footprint, and subsequently, decrease the green waste embedded in the raw material. Therefore, even if the annual production of pallies increased from 20,480 to 27,207, changing the raw material from 100% virgin polymer to 100% recycled polymer resulted in reducing 654 tonnes CO2e annually, generating maximum carbon savings (see Appendix 2).
The delivery of raw materials and warehousing problem was addressed by setting standard operating procedures (SOPs). According to Imai (1986), ‘There can be no improvement where there are no standards’, which signifies the relationship between improvement strategies and maintaining standard procedures for all processes. Resource levelling was used to ensure the availability of workforce to directly stack the raw material from truck-to-rack, thereby eliminating the wait time of 90 min. Resource levelling is a ‘technique in which start and finish time of the tasks are adjusted based on resource constraints with the goal of balancing demand for resources with the available supply’ (PMBOK Guide). Improvement to production control was made using visual management (VM) and an introduction of the daily huddle for efficient communication and information flow. VM makes the process transparent and enables immediate feedback of current status and indicates where immediate actions or adjustments may be required to enable a smooth flow in a process to fulfil customer pull (Womack and Jones, Citation1996). Instead of weekly revision, the production schedule was revised daily and bottlenecks were identified in the huddle, which reduced machine downtime. Moreover, changing the procurement strategies towards more sustainable and low carbon material as well as a local supplier allowed the company to reduce the ‘just in case’ raw material inventory from 3362 to 1500 pallies, resulting in reducing an average of 199 tonnes CO2e annually. Previous researches have also highlighted the importance of sustainable procurement including green supplier selection for enhancing organisational and supply chain environmental performance (Igarashi, de Boer, and Fet Citation2013; Genovese et al. Citation2017; Govindan, Soleimani, and Kannan Citation2015). However, rarely the benefits of green procurement have been quantified for SMEs, which could help them visualise carbon savings along with enhancing their operational efficiency. This research overcomes such shortcomings by quantifying the environmental performance related to sustainable procurement, transportation, inventory management and defects in a simple manner that can be used by any packaging manufacturing SMEs.
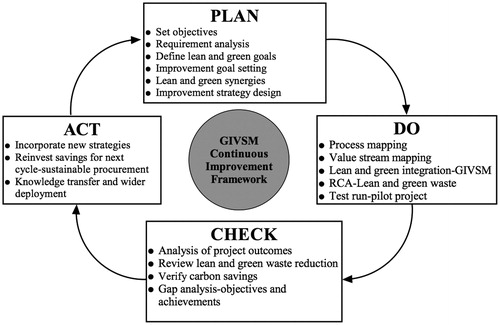
Similarly, weekly delivery of customer order resulted in reducing an average inventory from 1600 pallies to 410 pallies, saving an average of 112 tonnes CO2e annually. The pre-moulding and moulding processes were analysed and integrated into a single process, resulting in a reduction in waiting time. In addition to quality inspection, a quality assurance process was introduced before the moulding process to ensure efficient quality management – to prevent a fault in mould design, reduce operators' errors and to meet the requirement of the customers. The application of continuous improvement (Plan-Do-Check-Act or PDCA) cycle (see ) clubbed with regular Kaizen events resulted in decreasing the number of defects to 254 from 589, and implementing this strategy could also save additional 2 tonnes of CO2e annually. According to Sokovic, Pavletic, and Kern Pipan (Citation2010), PDCA is much more than a simple tool that introduces continuous improvement philosophy into the organisation's culture in four steps. This methodology is also called Deming’s cycle (1982), which induces gradual change, thereby leading the continual evolution of the company. Whereas, Kaizen is an improvement process where resources are deployed efficiently to achieve improvement targets in an expedited way (Nelson, Moody, and Stegner Citation2005).
Implementing the future state GIVSM resulted in increasing overall production efficiency from 20,480 units of pallies to 27,207 units of pallies by moulding the extra units of pallies and consuming more energy, which can be one of the major misalignments between lean and green paradigm. However, this misalignment could be overcome by implementing sustainable procurement strategy (as explained above), and the GIVSM would still yield a net positive carbon savings of 967 tonnes of CO2e.
5. Discussion
Previous research has highlighted the importance of enhancing environmental sustainability along with operational efficiency in production systems in response to gain competitive advantage and address different environmental challenges such as rising pro-environmental behaviour of consumers and stricter regulations (Thanki and Thakkar, Citation2016; Dora, Kumar, and Gellynck Citation2016; Genovese et al. Citation2017). There has been a growing research to integrate operational efficiency with environmental performance through lean thinking approach, mostly by extending the traditional VSM. However, most extensions have either used complex calculations or variety of indicators, making the adoption difficult for SMEs. While there are more than 600 indicators for measuring the environmental impact of a product, it goes against the recommendations of Lorenz et al. (Citation1999) who suggested that the ecological measures should be easy to measure and implement for practical relevance. It is thus, difficult for companies, particularly SMEs with limited resources, to measure their production systems’ performance using a variety of indicators as well as design and implement improvement strategies. Recent research has shown that carbon emissions or footprint could be considered as one of the indicators for performing comprehensive environmental assessments without having to engage with unnecessary complex datasets (Genovese et al. Citation2017). However, there is a dearth of empirical research, which has performed simple, yet robust analysis of operational efficiency while increasing environmental performance, that is, successfully integrating lean and green approach for continuous improvement.
This research has contributed to the existing body of literature by performing an empirical research on successfully integrating lean and green paradigms that overcome the misalignments between the two and yield an overall synergistic positive result. Within the context of the studied organisation, results obtained from the pilot study indicate that the concurrent deployment of the green and lean paradigms, through our proposed methodology and the GIVSM tool, is a simple, practical and effective approach to improve sustainability performance of SMEs. For instance, both types of wastes were reduced substantially through new raw material procurement strategy proposed in the future state GIVSM, which comprised procuring recycled polymer from the U.K. instead of virgin polymer from Germany. The GIVSM helped in increasing the operational efficiency by decreasing the lead time by 63% (), and at the same time enhanced the environmental performance by decreasing the carbon footprint associated to green waste by 49% (Appendix 2) and overall carbon footprint by 77% (). The application of quality control and Kaizen were helpful in decreasing the number of defects, which further resulted in increasing the operational efficiency and decreasing the green waste (garbage). Warehousing process also has significant bottlenecks due to the absence of JIT and Kanban system that results in large inventories and motion waste and transportation waste. Moulding consumes maximum amount of the cycle time (after material procurement) due to the inefficient cooling mechanism (which can consume up to 80% of the cycle time in the moulding), which is currently being used by the case company.
Figure 5. Future state GIVSM of pally manufacturing process.
This case study demonstrates that a traditional VSM can integrate both lean and green paradigms to launch a lean project and instigate appropriate improvements within a manufacturing packaging SME. This further shows that SMEs, who usually lack in capital resources, could use this simple GIVSM framework to achieve substantial improvements in their operational and environmental performance. The lack of adequate capital, strategic lean vision, unavailability of a simple improvement framework, and lack of earlier VSM experience prevented this case company from implementing lean manufacturing paradigm. The technique of integrating lean and green paradigms into the VSM, and its successfully pilot run in the organisation, has vociferously advocated a company-wide rollout of this strategy. Under the lean approach, a continuous strategy improvement, using PDCA cycle, was deployed during the pilot test (). This shows that the integration of lean and green approaches within the traditional VSM has efficiently improved the case company’s lean and green performance — which further illustrates its potential usage to derive benefits for many cash-starved SMEs who are unable to afford advanced manufacturing machines or large consultancy services to achieve desired improvements in their operations.
Figure 6. Future state GIVSM of pally manufacturing process.
The fair assessment of the implementation process reveals that it was crucial to be flexible in implementing the GIVSM framework, recognising that every organisation is different in terms its structure, culture, processes and financial obligations. Therefore, this framework offers flexibility for organisations to add, omit or modify their approaches to lean and green considerations based on their specific needs and situations. This study also revealed that it was imperative to have the support of stakeholders, such as management and project team, to achieve the desired result in the project.
6. Conclusions and future research
Given, the integration of lean and green paradigms is still in its infancy with lesser practical implementation within SMEs; it motivated authors to undertake this research and document the case study presented in this paper. The contribution of this paper is threefold. Firstly, it provides a systematic approach to identify lean and green wastes by applying lean tools such as VSM and RCA in a real case packaging manufacturing SME. Secondly, it integrates lean and green paradigm through a systematic methodology and proposes a novel tool called the GIVSM allowing simultaneous deployment of lean and green initiatives to improve both operational and environmental performance in a pilot study in the case company. Thirdly, this paper demonstrates practical benefits of using the GIVSM in a manufacturing SME and proposes its successful implementation through continuous improvement cycle within SMEs in manufacturing and other industry sectors that are faced with lack of funds and other constraints. Kaizen, visual management, SOPs, quality control and supplier selection were few key improvement steps that were taken for yielding the synergistic effect of integrated lean-green implementation during the pilot run. The implementation of the above-described strategies was validated in the pilot run (future state GIVSM) and is currently underway for full consideration within the case company. The GIVSM helped in increasing the overall operational efficiency by decreasing the lead-time by 63%, and at the same time enhanced the environmental performance by decreasing the average carbon footprint by 77%. There was one major misalignment due to the amount of energy needed for moulding extra unit pallies due to improving operational efficiency. Findings of our research suggest that reinvesting the cost and carbon savings into sustainable procurement that includes low carbon raw material manufacturing, low carbon transportation, sustainable energy usage and local supplier selection while making it a part of continuous improvement cycle can help overcoming misalignments. The proposed GIVSM tool was, therefore, helpful in determining synergies and misalignments between lean and green waste. In addition to its practical contribution for SMEs, this tool was proposed to address the research gap regarding successful integration of lean-green paradigms, and provided a framework to overcome losses due to their misalignments.
Future research could focus on a wider application of GIVSM tool in multiple case studies on SMEs from other industry sectors for further validation. However, researchers could develop a holistic system to explore pathways for adding economic and social paradigms to this integrated lean and green framework. It is anticipated that the synergistic effect of such a lean and green paradigm would improve economic and environmental outcomes in an organization. It could also look into integrating six sigma methodologies – process variations, an in-depth root cause analysis of different types of classified waste. Further research could consider implementing advanced procurement strategies, measurement systems, enterprise resource planning and robust quality management system to yield and quantity significant improvements. This research could have a number of implications for industry and within academia. However, this integration of lean and green paradigms to achieve sustainable operational goals demands deeper exploration. For example, academics and practitioners could further explore the integration of lean and green methods to manage better process designing, capacity planning, workforce management, inventory control, logistics, and purchasing among others. Whereas industrial practitioners can identify improvement opportunities in the way, lean and green thinking is integrated not only to achieve excellence in operations but also to fulfill organisation's responsibility towards the environment. The lean and green wastes along with the GIVSM framework presented in this paper will be helpful to both researchers and industrial practitioners in gaining valuable information on how SMEs could use simple frameworks, such a GIVSM, to improve their operational performance while not compromising their environment performance – thereby finding new ways to accomplish a balance in environmental and economic priorities in their goal for sustainable business practices.
Acknowledgement
The authors would like to thank the case-study organisation’s team members for providing relevant data, insightful discussions during the process mapping and VSM workshop and to the senior management team for making use of the results. Authors would also like to extend sincere gratitude to Ms Jiahui Gu for her dedicated research assistantship in the preliminary stage of the project.
Additional information
Notes on contributors

Sonal Choudhary
Sonal Choudhary is a Lecturer in Sustainable Management at the management school, University of Sheffield. She holds a PhD in Environmental Sustainability from the University of Sheffield and has double masters: MSc. in GIS & Environmental Modelling from University of Hull and MSc. in Environmental Biology with Gold medal from University of Delhi. She is a certified Lean Six Sigma Green Belt. Her main research interests are in the areas of resource efficiency, socio-environmental risks and impact, inefficiency/wastes identification and sustainability performance measurement. She has worked on numerous projects funded by European Commission (FP7), Marie Curie (ITN), British Academy, Newton Fund, Higher Education Funding Council for England (HEFCE).

Rakesh Nayak
Rakesh K. Nayak is a director at LeanSig Limited, a UK-based consultancy specialising in Lean Six Sigma (LSS) and operational excellence consulting. He is a certified Lean Six Sigma Black Belt from KPMG, and a certified PMP, PRINCE2 Practitioner, ScrumMaster and an ITIL v3 professional developing multi-facet operational and programme management strategies for improving quality, productivity, agility and cost efficiency. He has more than 14 y of professional experience in LSS, operations and strategy consulting in several Fortune 500 companies. He has been guest lecturing at the University of Sheffield, U.K., and at several business schools in India. He is passionate about researching how hybrid methodologies such as lean, agile project management and design for six sigma can be used together to help organisations improve their triple bottom-line. Rakesh is a member of American Society for Quality, Project Management Institute and Scrum Alliance.

Manoj Dora
Manoj Dora is a Lecturer in Operations & Supply Chain Management at Brunel University, London. His current research is focused on business transformation models, such as lean and circular economy. He has significant practical experience and interdisciplinary research publications in the field of sustainable supply chain management and food sustainability issues in SMEs. He has been successful in acquiring research grants from the World Bank, European Commission (FP7), British Academy and several private companies in the past.

Nishikant Mishra
Nishikant Mishra is a Professor in Operations and Supply Chain Management at Hull University Business School, University of Hull. Prior to that he was Senior Lecturer in Operations & Supply Chain Management and Director of Post Graduate Research at Norwich Business School, University of East Anglia, Norwich. He worked as a Senior Lecturer and Director of Research at School of Management & Business, Aberystwyth University. He has worked on numerous consultancy projects funded by British Council, Biotechnology and Biological Sciences Research Council (BBSRC), British Academy (BA), Innovate U.K., Department for Environment, Food and Rural Affairs (DEFRA), Higher Education Academy (HEA) and Meat Promotion Wales (HCC). His research articles have been published in various renowned journals of Operations Research and Operations & Supply chain Management.

Abhijeet Ghadge
Abhijeet Ghadge is an Assistant Professor in Logistics at the Logistics Research Centre, Heriot Watt University, Edinburgh, U.K. Before joining Heriot Watt University, he worked with manufacturing and service industries for over 4 y at different roles and levels. He has published more than 30 articles in leading international journals and conferences. His current research interests include supply chain risk and resilience, sustainability, lean six sigma and quality management.
References
- Abdulmalek, F. A., and J. Rajgopal. 2007. “Analyzing the Benefits of Lean Manufacturing and Value Stream Mapping via Simulation: A Process Sector Case Study.” International Journal of Production Economics 107 (1): 223–36.
- Agan, Y., M. F. Acar, and A. Borodin. 2013. “Drivers of Environmental Processes and Their Impact on Performance: A Study of Turkish SMEs.” Journal of Cleaner Production 51: 23–33.
- Alaya, L. B. F. 2016. “VSM a Powerful Diagnostic and Planning Tool for a Successful Lean Implementation: A Tunisian Case Study of an Auto Parts Manufacturing Firm.” Production Planning & Control 27 (7–8): 563–78.
- Balinski, K. D., and K. Grantham. 2013. “Quantifying the Carbon Footprint of Lean Waste.” Engineering 5 (1): 80–91.
- Bergmiller, G. G., and P. R. McCright. 2009. “Parallel models for lean and green operations.” Paper presented at proceedings of the 2009 Industrial Engineering Research Conference, Miami, FL.
- Bientinesi, M., and L. Petarca. 2009. “Comparative Environmental Analysis of Waste Brominated Plastic Thermal Treatments.” Waste Management 29 (3): 1095–1102.
- Bond, T. C. 1999. “The Role of Performance Measurement in Continuous Improvement.” International Journal of Operations & Production Management 19 (12): 1318–1334.
- Braglia, M., G. Carmignani, and F. Zammori. 2006. “A New Value Stream Mapping Approach for Complex Production Systems.” International Journal of Production Research 44 (18–19): 3929–52.
- Bush, A., C. Palasciano, A. P. Staudacher, M. Taisch, and S. Vitali. 2014. “Investigating Lean Methodology for Energy Efficient Manufacturing.” Paper presented at IFIP International Conference on Advances in Production Management Systems. Berlin, Heidelberg: Springer.
- Carbon trust. 2016. Conversion factors guide 2016 update. https://www.carbontrust.com/news/2016/11/conversion-factors-guide-updated-to-use-2016-emission-factors/.
- Cherrafi, A., S. Elfezazi, A. Chiarini, A. Mokhlis, and K. Benhida. 2016. “The Integration of Lean Manufacturing, Six Sigma and Sustainability: A Literature Review and Future Research Directions for Developing a Specific Model.” Journal of Cleaner Production 139: 828–846.
- Dadashzadeh, M., and T. J. Wharton. 2012. “A Value Stream Approach for Greening the IT Department.” International Journal of Management & Information Systems (Ijmis) 16 (2): 125–36.
- Dal Forno, A. J., F. A. Pereira, F. A. Forcellini, and L. M. Kipper. 2014. “Value Stream Mapping: A Study about the Problems and Challenges Found in the Literature from the past 15 Years about Application of Lean Tools.” The International Journal of Advanced Manufacturing Technology 72 (5–8): 779–90.
- Deming, W. E. 1982. Out of Crisis. Cambridge: Cambridge University Press.
- Dora, M., M. Kumar, and X. Gellynck. 2016. “Determinants and Barriers to Lean Implementation in Food-Processing SMEs–a Multiple Case Analysis.” Production Planning & Control 27 (1): 1–23.
- Dües, C. M., K. H. Tan, and M. Lim. 2013. “Green as the New Lean: How to Use Lean Practices as a Catalyst to Greening Your Supply Chain.” Journal of Cleaner Production 40: 93–100.
- Emiliani, M. L. 1998. “Lean Behaviors.” Management Decision 36 (9): 615–631.
- Faulkner, W., and F. Badurdeen. 2014. “Sustainable Value Stream Mapping (Sus-VSM): Methodology to Visualize and Assess Manufacturing Sustainability Performance.” Journal of Cleaner Production 85: 8–18.
- Franchetti, M., K. Bedal, J. Ulloa, and S. Grodek. 2009. “Lean and Green: Industrial Engineering Methods Are Natural Stepping Stones to Green Engineering.” Industrial Engineer: IE 41 (9): 24–9.
- Garza-Reyes, J. A. 2015. “Lean and Green- a Systematic Review of the State of the Art Literature.” Journal of Cleaner Production 102: 18–29.
- Garza-Reyes, J. A., B. Villarreal, V. Kumar, and P. M. Ruiz. 2016. “Lean and Green in the Transport and Logistics Sector- a Case Study of Simultaneous Deployment.” Production Planning & Control 27 (15): 1221–1232.
- Gaussin, M., G. Hu, S. Abolghasem, S. Basu, M. R. Shankar, and B. Bidanda. 2013. “Assessing the Environmental Footprint of Manufactured Products: A Survey of Current Literature.” International Journal of Production Economics 146 (2): 515–523.
- Ghadge, A., M. Kaklamanou, S. Choudhary, and M. Bourlakis. 2017. “Implementing Environmental Practices within the Greek Dairy Supply Chains: drivers and Barriers for SMEs.” Industrial Management & Data Systems 117 (9) :1995–2014.
- Genovese, A., A. A. Acquaye, A. Figueroa, and S. L. Koh. 2017. “Sustainable Supply Chain Management and the Transition towards a Circular Economy: Evidence and Some Applications.” Omega 66: 344–357.
- Govindan, K., H. Soleimani, and D. Kannan. 2015. "Reverse Logistics and Closed-Loop Supply Chain: A Comprehensive Review to Explore the Future." European Journal of Operational Research 240 (3): 603–626.
- Igarashi, M., L. de Boer, and A. M. Fet. 2013. "What is Required for Greener Supplier Selection? A Literature Review and Conceptual Model Development." Journal of Purchasing and Supply Management 19 (4): 247–263.
- Jollands, N., J. Lermit, and M. Patterson. 2004. “Aggregate Eco-Efficiency Indices for New Zealand- a Principal Components Analysis.” Journal of Environmental Management 73 (4): 293–305.
- King, A. A., and M. J. Lenox. 2001. “Lean and Green? an Empirical Examination of the Relationship between Lean Production and Environmental Performance.” Production and Operations Management 10 (3): 244–256.
- Kitchenham, B., L. Pickard, and S. L. Pfleeger. 1995. “Case Studies for Method and Tool Evaluation.” IEEE Software 12 (4): 52–62.
- Klotz, L. E., M. Horman, and M. Bodenschatz. 2007. “A Lean Modelling Protocol for Evaluating Green Project Delivery.” Lean Construction Journal 3 (1): 1–18.
- Kurdve, M., P. Hanarp, X. Chen, X. Qiu, Y. Zhang, J. Stahre, and J. Laring. 2011. "Use of Environmental Value Stream Mapping and Environmental Loss Analysis in Lean Manufacturing Work at Volvo." Swedish Production Symposium, Lund.
- Kurdve, M., S. Shahbazi, M. Wendin, C. Bengtsson, and M. Wiktorsson. 2015. “Waste Flow Mapping to Improve Sustainability of Waste Management: A Case Study Approach.” Journal of Cleaner Production 98: 304–315.
- Lacerda, A. P., A. R. Xambre, and H. M. Alvelos. 2016. “Applying Value Stream Mapping to Eliminate Waste: A Case Study of an Original Equipment Manufacturer for the Automotive Industry.” International Journal of Production Research 54 (6): 1708–1720.
- Leonard-Barton, D. 1990. “A Dual Methodology for Case Studies: Synergistic Use of a Single Longitudinal Site with Replicated Multiple Sites.” Organization Science 1 (3): 248–266.
- Li, X., Y. Zhu, and Z. Zhang. 2010. “An LCA-Based Environmental Impact Assessment Model for Construction Processes.” Building and Environment 45 (3):766–775.
- Lohman, C., L. Fortuin, and M. Wouters. 2004. "Designing A Performance Measurement System: A Case Study." European Journal of Operational Research 156 (2): 267–286.
- Lorenz, C. M., A. J. Gilbert, and W. P. Cofino. 1999. “Indicators for Transboundary River Basin Management.” In Environmental Indices: System Analysis Approach, edited by Pykh, Y.A., Hyatt, D.E., Lenz, R.J.M., 313–328. Oxford, UK: EOLSS Publishers Co. Ltd.
- Martinez, F., D. A. Vazquez-Brust, K. Peattie, and K. Zokaei. 2012. “Achieving Greener Growth: A Business Perspective for Proactive Commitment.” Greening of Industry Networks Studies 1: 191–212.
- McDonald, T., E. M. Van Aken, and A. F. Rentes. 2002. “Utilising Simulation to Enhance Value Stream Mapping: A Manufacturing Case Application.” International Journal of Logistics Management 5 (2): 213–232.
- Miles, M. B., and A. M. Huberman. 1994. Qualitative Data Analysis. 2nd ed. Thousand Oaks: Sage.
- Mollenkopf, D., H. Stolze, W. Tate, and M. Ueltschy. 2010. “Green, Lean, and Global Supply Chains.” International Journal of Physical Distribution & Logistics Management 40 (1–2): 14–41.
- Moorthy, M. K., A. Peter, L. Yacob, M. Kumar, and L. Arokiasamy. 2012. "Drivers for Malaysian SMEs to Go Green." International Journal of Academic Research in Business and Social Sciences 2 (9): 74–86.
- Mu¨Ller, E., T. Stock, and, and R. Schillig. 2014. “Energy Value-stream Mapping-A Method to optimize Value-streams in Respect of Time and Energy Consumption.” In Enabling Manufacturing Competitiveness and Economic Sustainability, edited by M. F. Zaeh, 285–290. Cham, Switzerland: Springer.
- Nelson, D., P. E. Moody, and J. R. Stegner. 2005. The Incredible Payback. New York City: Amazon.
- Ng, R., J. S. C. Low, and B. Song. 2015. “Integrating and Implementing Lean and Green Practices Based on Proposition of Carbon-Value Efficiency Metric.” Journal of Cleaner Production 95: 242–55.
- Norton, A. 2007. “Sustainable Value Stream Mapping as a Technique for Analysing and Reducing Waste in the UK Chilled Food Sector.” PhD diss., University of London, Imperial College, UK.
- Pampanelli, A. B., P. Found, and A. M. Bernardes. 2014. “A Lean & Green Model for a Production Cell.” Journal of Cleaner Production 85: 19–30.
- Parthanadee, P., and J. Buddhakulsomsiri. 2014. “Production Efficiency Improvement in Batch Production System Using Value Stream Mapping and Simulation: A Case Study of the Roasted and Ground Coffee Industry.” Production Planning & Control 25 (5): 425–446.
- Rizzi, F., M. Frey, F. Testa, and A. Appolloni. 2014. “Environmental Value Chain in Green SME Networks: The Threat of the Abilene Paradox.” Journal of Cleaner Production 85: 265–275.
- Rother, M., and J. Shook. 1999. “Learning to See.” Cambridge, MA: Lean Enterprise Institute.
- Saboo, A., J. A. Garza-Reyes, A. Er, and V. Kumar. 2014. “A VSM Improvement-Based Approach for Lean Operations in an Indian Manufacturing SME.” International Journal of Lean Enterprise Research 1 (1): 41–58.
- Schulze, A., P. Schmitt, M. Heinzen, P. Mayrl, D. Heller, and R. Boutellier. 2013. “Exploring the 4I Framework of Organisational Learning in Product Development: Value Stream Mapping as a Facilitator.” International Journal of Computer Integrated Manufacturing 26 (12): 1136–1150.
- Seth, D., and V. Gupta. 2005. "Application of Value Stream Mapping for Lean operations and cycle time reduction: an Indian case study." Production Planning & Control 16 (1): 44–59.
- Sharrard, A. L., H. S. Matthews, and R. J. Ries. 2008. “Estimating Construction Project Environmental Effects Using an Input-Output-Based Hybrid Life-Cycle Assessment Model.” Journal of Infrastructure Systems 14 (4): 327–336.
- Silbermayr, L., W. Jammernegg, and P. Kischka. 2017. “Inventory Pooling with Environmental Constraints Using Copulas.” European Journal of Operational Research 263 (2): 479–492.
- Singh, B., S. K. Garg, and S. K. Sharma. 2011. "Value Stream Mapping: Literature Review and Implications for Indian Industry." The International Journal of Advanced Manufacturing Technology 53 (5): 799–809.
- Slack, N., S. Chambers, and R. Johnston. 2004. Operations management. Oxford, Prentice Hall Financial Times.
- Sokovic, M., D. Pavletic, and K. Kern Pipan. 2010. "Quality Improvement Methodologies–PDCA Cycle, RADAR Matrix, DMAIC and DFSS." Journal of Achievements in Materials and Manufacturing 43 (1): 476–483.
- Thanki, S., and J. Thakkar. 2016. “Value–Value Load Diagram: A Graphical Tool for Lean–Green Performance Assessment.” Production Planning & Control 27 (15): 1280–1297.
- Thanki, S., K. Govindan, and J. Thakkar. 2016. “An Investigation on Lean-Green Implementation Practices in Indian SMEs Using Analytical Hierarchy Process (AHP) Approach.” Journal of Cleaner Production 135: 284–298.
- Venkat, K., and W. Wakeland. 2006. “Is Lean Necessarily Green?” Presented at the 50th Annual Meeting of the Annual Meeting of the International Society for the Systems Sciences (ISSS), Sonoma, CA, USA.
- Vinodh, S., R. B. Ruben, and P. Asokan. 2016. “Life Cycle Assessment Integrated Value Stream Mapping Framework to Ensure Sustainable Manufacturing: A Case Study.” Clean Technologies and Environmental Policy 18 (1): 279–295.
- Voss, C., N. Tsikriktsis, and M. Frohlich. 2002. “Case Research in Operations Management.” International Journal of Operations & Production Management 22 (2): 195–219.
- Ward, M., and C. Rhodes. 2014. “Small businesses and the UK economy.” Standard Note: SN/EP/6078. Office for National Statistics.
- Wills, B. 2009. “Green intentions: Creating a green value stream to compete and win.” Boca Raton, FL, USA: CRC Press.
- Whicker, L., M. Bernon, S. Templar, and C. Mena. 2009. “Understanding the Relationships between Time and Cost to Improve Supply Chain Performance.” International Journal of Production Economics 121 (2): 641–650.
- Womack, J. P., and D. T. Jones. 1996. “Lean Thinking: Banish Waste and Create Wealth in Your Corporation.” New york: Free Press, Simon & Schuster.
- Yu, V., H. I. Ting, and Y. C. Jim Wu. 2009. “Assessing the Greenness Effort for European Firms: A Resource Efficiency Perspective.” Management Decision 47 (7): 1065–1079.
- Zokaei, K., H. Lovins, A. Wood, and P. Hines. 2013. “Creating a Lean and Green Business System: Techniques for Improving Profits and Sustainability.” Boca Raton, FL, USA: CRC Press.
Appendix tables
Table A1. Carbon footprint conversion factors.
Table A2. Current and future state green waste.Table Footnote*