
 ?Mathematical formulae have been encoded as MathML and are displayed in this HTML version using MathJax in order to improve their display. Uncheck the box to turn MathJax off. This feature requires Javascript. Click on a formula to zoom.
Abstract
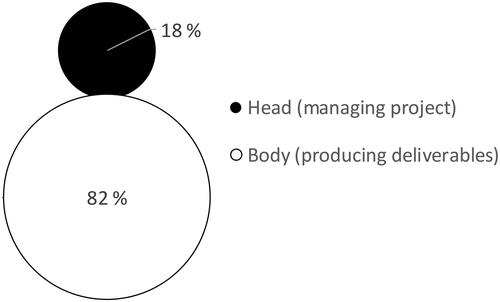
The total cost of a construction project involves both the cost of production and the transaction costs associated with managing the project. However, we know surprisingly little about the magnitude of transaction costs in construction projects. The purpose of this paper is to provide more empirical data as we study what proportion of the total cost in construction projects is spent on managing the project. We use the analogy of human anatomy as we investigate the size of a project’s head (managing the project) compared to the size of its body (producing deliverables). Using a dataset from 134 construction projects in Norway, we find that the project head consists of more than 18% of the total project cost on average. We also investigate how the size of the project head varies depending on a project’s complexity, size, duration and burn rate.
1. Introduction and motivation
In 2019, it was 500 years since Leonardo Da Vinci died. From his famous work on human anatomy, we know that the mass of a human head is on average 8% of the total body mass of a human. However, compared with today’s superior knowledge about human anatomy, our knowledge about the anatomy of construction projects is scarce. There is limited knowledge about the size of a project's head compared to its body. The project head refers to those activities related to planning and controlling the project, while the body refers to activities related to producing the deliverables from the project. Within the framework of transaction cost economics, project management is a transaction cost invested to ensure that the project successfully reaches its goal (Da Fonseca, Vanalle, and Camarotto Citation2018; Haq et al. Citation2018; Li, Arditi, and Wang Citation2015; Rajeh, Tookey, and Rotimi Citation2013). While there is a desire to reduce transaction costs, the level of management must be sufficient to ensure that the project reaches its goal. Investing too little in the management of a project may lead to failure. The aim should therefore be to find the optimum head-to-body ratio for each specific project.
There are numerous studies suggesting that construction projects often struggle with poor cost performance (Love, Sing, et al. Citation2019). Cost overruns are frequently found for both megaprojects (Fiedler and Wendler Citation2016; Flyvbjerg and Stewart Citation2012) and for smaller construction projects (Chen et al. Citation2016). The total cost of a construction project includes both the cost of production and the transaction costs associated with managing the project (Li, Arditi, and Wang Citation2015; Williamson Citation1996) as expressed in EquationEquation (1)(1)
(1) .
EquationEquation 1(1)
(1) : (Lee et al. Citation2009; Walker and Kwong Wing Citation1999; Williamson Citation1979)
(1)
(1)
Here, production refers to those activities directly related to transforming inputs into valuable outputs for the project owner (Da Fonseca, Vanalle, and Camarotto Citation2018) such as design and construction activities (Ballard and Howell Citation2003). Several initiatives over the years have helped the construction industry to reduce their costs through more efficient production. Examples of this include Lean Construction, Last Planner System (Ballard Citation2000) and Virtual Design Construction (Kunz and Fischer Citation2012).
However, project transaction costs have received surprisingly little attention within the field of project management research, and we know little about their size (Da Fonseca, Vanalle, and Camarotto Citation2018; Guo et al. Citation2016; De Schepper, Haezendonck, and Dooms Citation2015; Li, Arditi, and Wang Citation2015; Rajeh et al. Citation2015). Exploring the size of these transaction costs may therefore reveal an area where further cost reduction can be achieved and cost overruns avoided (Wang, Yap, et al. Citation2019).
In addition to its direct influence on project cost and performance within the constraints of the traditional iron triangle, a better understanding of project transaction costs is also relevant for other aspects of project success. Extensive monitoring and control, and its associated transaction costs, have a negative effect on trust (Kadefors Citation2004) and collaboration (Haaskjold et al. Citation2019). As a consequence, this reduces a contractor's willingness to propose solutions that would have been more beneficial for the project owner and project stakeholders in the long run (Samset Citation2014).
The purpose of this paper is to investigate transaction costs in Norwegian construction projects as we investigate the cost associated with managing these projects. Hence, we respond to the call for more empirical research on quantified transaction costs in construction projects (Da Fonseca, Vanalle, and Camarotto Citation2018; Guo et al. Citation2016; De Schepper, Haezendonck, and Dooms Citation2015; Li, Arditi, and Wang Citation2015; Rajeh et al. Citation2015). We analyse a dataset from 134 construction projects in Norway to identify what proportion of the total project cost is spent on managing the project by the client and its contractor. We also investigate how this number varies depending on different characteristics such as complexity, cost, duration and burn rate. In this paper we address the following research question:
RQ: What proportion of the total cost in construction projects is spent by the client and its contractor to manage the project?
The structure of this paper is outlined as follows: First, we present the theoretical background of transaction cost theory and state-of-the-art research on quantified transaction costs in projects. Next, we describe our research method, before presenting and discussing our main findings and contributions. This is followed by a conclusion section, with suggestions for future research.
2. Theoretical background
In this section, we present the theoretical background for transaction cost theory and its relevance for construction projects. We provide an overview of the state-of-the-art research on quantified transaction costs in projects, before we identify a research gap that highlights a need for more research that quantifies transaction costs in construction projects.
2.1. Transaction cost economics
Transaction costs are the ‘costs of running the economic system’ (Arrow Citation1969, 48) and this is described by Williamson as follows:
In mechanical systems we look for frictions: do the gears mesh, are the parts lubricated, is there needless slippage or other loss of energy? The economic counterpart of friction is transaction cost: do the parties to the exchange operate harmoniously, or are there frequent misunderstandings and conflicts that lead to delays, breakdowns and other malfunction? (Williamson Citation1981, 552)
In The Nature of the Firm, Coase (Citation1937) introduced the term transaction costs as the very reason for why firms exist in a free market, leading to the New Institutional Economics Paradigm (Rindfleisch and Heide Citation1997; Simon Citation1991). Williamson (Citation1971) expanded the theory as he claimed that opportunistic behaviour in combination with uncertainty, asset specificity and the bounded rationality of a human mind leads to transaction cost for the involved parties who safeguard their own interests against a possibly opportunistic counterpart. Asset specificity refers to how unique assets are for a specific transaction (Williamson Citation1996) while bounded rationality refers to the limited capability a human mind has to solve problems with high complexity and to process complex information (Simon Citation1957). Uncertainty and bounded rationality can be exploited by opportunistic agents who pursue their own interests through misleading conduct, distortion or confusion (Williamson Citation1996, Citation1975). Opportunistic behaviour is defined as ‘….self-interest seeking with guile: agents who are skilled at dissembling realise transaction advantages’ (Williamson Citation1971, 255).
The principal-agent theory presents several problems that could occur in a relationship between a client (the principal) and its contractor (the agent) in construction projects due to information asymmetry and opportunism (Bryde, Unterhitzenberger, and Joby Citation2019). This includes small-number bargaining (Klein, Crawford, and Alchian Citation1978), hold-up problems (Goldberg Citation1976) and haggling problems (Williamson Citation1996). To safeguard their interests against principal-agent problems, parties invest in governance in terms of specifying work, negotiating contracts and by monitoring and controlling work (Williamson Citation1996).
2.2. Project management: a transaction cost
Project transaction costs are costs that are not directly related to the production taking place in the project, but instead costs associated with managing and controlling the project (Da Fonseca, Vanalle, and Camarotto Citation2018; Li, Arditi, and Wang Citation2015; Rajeh, Tookey, and Rotimi Citation2013). Walker and Kwong Wing (Citation1999) argued that project management is entirely a transaction cost, a view that is supported by more recent research by others such as (Da Fonseca, Vanalle, and Camarotto Citation2018; Li, Arditi, and Wang Citation2015; Lee et al. Citation2009).
Following the above rationale, one may reach a premature conclusion that since project management activities are transaction costs, they should be eliminated. However, transaction costs are not equivalent to waste but rather the necessary costs associated with operating the economic systems (Williamson Citation1996). In fact, Williamson (Citation1979) emphasised that this is an optimisation problem where the aim is to find the optimal balance between production- and transaction costs:
The object is to economize on the sum of production and transaction costs. (Williamson Citation1979, 245)
If reducing transaction costs lead to higher production costs, the total cost of a project may increase. In a project context, simply eliminating project management activities would lead to poor performance and failing projects. Hence, project management is a necessary transaction cost to ensure successful projects (Haq et al. Citation2018; Walker and Kwong Wing Citation1999). However, activities that do not give a positive contribution to the project should be reduced and avoided. Savings could be achieved if costs related to disputes and conflicts are avoided or if time-consuming administrative processes are improved (Invernizzi, Locatelli, and Brookes Citation2018). This may lead to several paradoxes. For example; costs associated with a client travelling to a construction site to verify work conducted by its contractor is an example of a transaction cost (Da Fonseca, Vanalle, and Camarotto Citation2018). Such transaction costs can easily be reduced if the client decides to reduce its number of site inspections. As a consequence, there is a risk that poor quality remains undetected and not discovered until later. Love et al. (Citation2018) found that lack of supervision was the most frequent factor causing rework in construction projects.
2.3. Transaction costs in construction projects
The transaction cost framework itself has been applied by researchers of construction projects (Li, Arditi, and Wang Citation2014; Rajeh, Tookey, and Rotimi Citation2013) and can be combined with project management theory (Walker and Kwong Wing Citation1999). Several examples of opportunistic behaviour are relevant for construction projects. One example is opportunistic bidding, which refers to the situation where a contractor may reduce its margin to win a job and then later exploit information asymmetry to recover profit through claims (Nyström Citation2015; Arditi and Chotibhongs Citation2009; Rooke, Seymour, and Fellows Citation2004). An opportunistic agent may also search for mistakes by others or search for missing or incomplete information to issue change orders during the project and claim extra payment (You et al. Citation2018; Ho et al. Citation2015). In a study of client-contractor relations in Swedish construction projects, Kadefors (Citation2004) found that there was a low level of trust between the parties. To safeguard their interests against opportunism the parties spent significant resources on writing detailed specifications and contract documents and closely monitoring each other's work. A similar relationship between trust and transaction costs was also found by Pinto, Slevin, and English (Citation2009), who studied Canadian construction projects.
It is common to split project transaction costs into pre-contract transaction costs and post-contract transaction costs (Li, Arditi, and Wang Citation2015). Pre-contract transaction costs refer to the costs before the contract with a contractor is signed. Typically, these include the costs associated with preparing feasibility studies, preparing tender documentation and negotiating the contract with bidders. Post-contract transaction costs refer to the cost of monitoring and controlling the project during its execution and also include potential costs from disputes and litigations (Li, Arditi, and Wang Citation2015).
Collaborative project delivery methods
By using collaborative delivery methods the focus is to ensure that win-win situations are created for both the client and the contractor through increased collaboration (Yeung et al. Citation2013; Bititci et al. Citation2007). To foster such collaboration, it is important that both parties perceive the contract as fair (Song et al. Citation2018). This will enhance knowledge sharing, openness and trust (Biong, Nes, and Sande Citation2016). To prevent opportunism, contracts should be designed so that both the interests of the client and the contractor are aligned (Eisenhardt Citation1985). Contracts with fixed price often has a negative influence on the collaborative relationship between a client and its contractor (Müller and Turner Citation2005).
Walker and Lloyd-Walker (Citation2015) separated different project delivery methods into four categories from first order (lowest) to fourth order (highest) based on the extent of collaboration. This is shown in . While first-order collaboration mainly focuses on production efficiency through for example Lean Production and Kaizen initiatives, fourth-order collaborations have added a focus on committed relationships.
Figure 1. Categorising collaboration forms of project management delivery, adopted from (Walker and Lloyd-Walker Citation2015, 108).
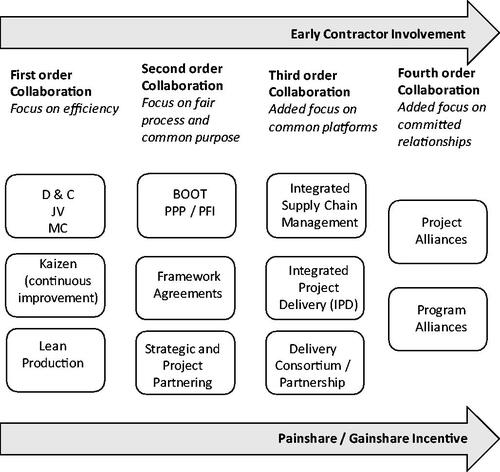
A common characteristic for high-order collaborative delivery methods is that they have a high level of both pain-share/gain-share incentives and early contractor involvement (Walker and Lloyd-Walker Citation2015). In addition, also soft elements such as trust, long-term commitment, cooperation and communication are important to achieve a high extent of collaboration (Haaskjold et al. Citation2020; Yeung, Chan, and Chan Citation2007).
In a frequently cited literature review of collaborative delivery methods in construction, Lahdenperä (Citation2012) found that such methods generally are split into three approaches that have much in common: partnering, alliancing and Integrated Project Delivery (IPD). Similarly, a more recent literature review by Engebø, Laedre, et al. (Citation2020) found the same three to be the most dominating collaborative delivery methods. Among these methods, alliancing is the most extreme form of relational contracting (Walker and Lloyd-Walker Citation2015; Lahdenperä Citation2012).
Previous research has shown that collaborative behaviour between a client and its contractor builds trust (Bond-Barnard, Fletcher, and Steyn Citation2018) which again has a positive effect on project transaction costs (Pinto, Slevin, and English Citation2009; Kadefors Citation2004) and quality (Haaskjold, Andersen, and Langlo Citation2020). Good communication also has a positive effect on transaction costs and is also a key factor to achieving good collaboration (Haaskjold et al. Citation2019). Other elements include reduced uncertainty and fewer change orders. All these are factors that have a positive effect on project transaction costs (Li, Arditi, and Wang Citation2015). If the client involves contractors early (Wondimu et al. Citation2016) and ensures that risk allocation is fair between the parties, project transaction costs can be reduced as the parties need to spend less resources on control and monitoring activities to safeguard their interests (Guo et al. Citation2016; Li, Arditi, and Wang Citation2013).
Quantification of transaction costs in construction projects
There are few published studies that quantify and measure the transaction costs in projects (Da Fonseca, Vanalle, and Camarotto Citation2018; Guo et al. Citation2016; Li, Arditi, and Wang Citation2014). provides a summary of the findings from a literature search of studies that quantify transaction costs in construction projects. The findings have been sorted according to which project phase and which perspective they cover, i.e. whether they cover pre-contract or post-contract transaction costs and whether they cover the client or contractor perspective.
Table 1. Summary of existing literature that quantify transaction costs in construction projects as percentage of total project cost.
Contractor's transaction costs
In the study published by Petersen et al. (Citation2018), contractors’ pre-contract transaction costs were found to be 5% of the total cost in a project. This is limited to contractors’ pre-contract transaction costs, i.e. the contractor's costs associated with preparing and negotiating bids and does not include post-contract transaction costs. This study was based on a survey among 261 private contractors in Denmark where respondents reported the size of their pre-contract transaction costs compared with the total costs.
The research by De Schepper, Haezendonck, and Dooms (Citation2015) and Farajian (Citation2010) is also limited to cover contractor pre-contract transaction costs. Both these studies found transaction costs to be less than 2% of the total project cost. De Schepper, Haezendonck, and Dooms (Citation2015) studied transaction costs in Belgian infrastructure projects. They found that contractors' transaction costs were significantly higher in public-private partnership (PPP) arrangements than in traditional public procurement (TPP) arrangements. Also, the specific investments made by contractors during the tendering process were significantly higher in PPP arrangements. The study by Farajian (Citation2010) is based on the transaction costs that are actually categorised and recorded as transaction costs by the project team in two US highway projects. Farajian (Citation2010) argued that the total transaction costs most likely are significantly higher and that there are several transaction activities that are not covered in the study.
In a study of 25 road projects in the EU between 1992 and 2007, Soliño and Gago De Santos (Citation2010) found contractors’ pre-contract transaction costs on average to be 6.5% of the total project cost. However, this number varied between 3% and 10% depending on whether an open procedure (3%) or negotiated procedure (10%) was used for contractor selection. Dudkin and Välilä (Citation2006) studied 55 UK projects and found that contractors’ pre-contract transaction costs were on average 10% of the project costs.
Client's transaction costs
Li, Arditi, and Wang (Citation2014) studied both pre-contract and post-contract transaction costs for clients which they found to be, on average, 7% of the total project cost. These findings were based on an e-mail survey among 239 clients in US construction. Their findings suggest that clients experience higher transaction costs during the post-contract phase than during the pre-contract phase. In other words, the clients’ costs related to monitoring and administrating the work conducted by its contractor(s) were higher than the costs prior to contract signing. Furthermore, they found that projects with a unit price compensation format incurred higher transaction costs than projects that utilised lump-sum or cost-plus compensation formats.
Whittington (Citation2008) did not separate clients’ transaction costs into phases but found from a case study of six US highway projects that the clients’ total transaction costs were on average 13.5% of the total project costs. This number varied between projects with different delivery methods. The number for projects that used design-bid-build was 15% while it was 12% for projects that used design-build.
Approaches to quantify project transaction costs
Among the few studies that exist, researchers have applied different approaches to quantify transaction costs. Petersen et al. (Citation2018) asked companies to report their internal salary cost to prepare bids as well as external legal and financial costs directly related to preparing a bid. De Schepper, Haezendonck, and Dooms (Citation2015) measured the following four items to calculate contractor pre-contract transaction costs: Staff cost, technical advice cost, legal advice cost and financial advice costs. Through case study projects Farajian (Citation2010) mapped the following items to calculate pre-contract transaction costs: Financial advisors, architects and engineering consultants, inspection costs, legal consultants, business consultants and administrative costs. Another study measured project preparation costs and bidding costs (Soliño and Gago De Santos Citation2010) as well as bidding and contract negotiation costs (Dudkin and Välilä Citation2006). Li, Arditi, and Wang (Citation2014) studied several aspects of costs related to project management, bidding and inspections.
There appears to be no clear trace through the existing literature how a transaction should be measured as various approaches have been used in the past. However, based on a literature study, Rajeh, Tookey, and Rotimi (Citation2013) developed a conceptual framework to measure transaction costs in construction projects through measuring project management activities. This framework describes different activities that should be measured in order to quantify a project's transaction costs: Information gathering, communication, attending meetings, translation of client's needs, project preliminary design, transition observation, training, site visits, contract administration, conflict resolution, decision making, contract enforcement and verifying compliances.
The above-listed measures for transaction costs are all examples of activities from the five process groups in PMBOK, activities related to managing the project (PMI Citation2017). Walker and Kwong Wing (Citation1999) argue that project management is entirely a transaction cost, a view that is supported by more recent research by others such as (Da Fonseca, Vanalle, and Camarotto Citation2018; Li, Arditi, and Wang Citation2015; Lee et al. Citation2009).
2.4. Research gap
Studies that quantify transaction costs in projects are scarce and more research is needed (Da Fonseca, Vanalle, and Camarotto Citation2018; Guo et al. Citation2016; De Schepper, Haezendonck, and Dooms Citation2015; Li, Arditi, and Wang Citation2015; Rajeh et al. Citation2015). A common feature of the majority of existing studies, presented in is that they mainly focus on the pre-contract transaction but exclude costs related to monitoring the work during the construction and operational phase of the project (Li, Arditi, and Wang Citation2015). Furthermore, all the identified studies are limited to either cover the client- or the contractor perspective.
None of the existing literature identified in covers both phases and both perspectives. In order to get a better understanding of the size of transaction costs in construction projects, both studies and perspectives should be covered. More research in the field of project transaction costs has also been suggested by Pinto, Slevin, and English (Citation2009). In more general terms, there is also a need for more quantitative project management studies based on large datasets (Von Danwitz Citation2018). Currently, our knowledge is limited about the size of transaction costs in construction projects.
3. Research method
In this paper, we aim to describe the current situation of cost associated with managing construction projects. We study a dataset of 134 different projects in Norway that have been collected through the Nordic 10-10 benchmarking programme. In the following chapter, we describe the dataset and present the analysis method used to calculate the project management costs as a function of total project cost.
3.1. Background for the Nordic 10-10 benchmarking programme
With the aim of improving performance in construction projects, the Norwegian Building Authority (DiBk) funded a four-year research project. One purpose of this research project was to establish a performance measurement tool that construction companies could use to benchmark their performance. Eight different tools for performance measurement were evaluated against various criteria in close cooperation with the industry. Based on this evaluation, the 10-10 tool developed by the Construction Industry Institute (CII) (Yun et al. Citation2016), was selected. The details of this evaluation process were presented at the CIB World Building Congress in 2016 (Andersen and Langlo Citation2016).
In close cooperation with CII, the 10-10 tool was translated into Norwegian language and fine-tuned to meet the Norwegian context. This was followed by a period where it was tested in pilot projects. Following successful testing, the tool was branded ‘Nordic 10-10’. The tool is administrated by the Norwegian University of Science and Technology (NTNU) and the authors of this paper have a role as facilitators that aid companies in their use of the Nordic 10-10 tool. Based on our involvement in the Nordic 10-10 benchmarking programme, the authors identified that empirical data collected through this benchmarking programme contained data that is well suited to investigate costs associated with managing Norwegian construction projects.
3.2. Data collection process
Using the Nordic 10-10 benchmarking tool, construction companies register data from their projects and receive feedback on their performance compared with other projects in the database. By June 2020, 26, different clients and contractors in Norway use this tool, and data are stored in a database that is available for researchers to conduct academic research. The data collection process in each company is facilitated by an internal 10-10 coordinator that has been trained and certified to facilitate the process. Data from each project is then validated by CII in the US for a final reliability check.
Data collection consists of two main parts for each project. In the first part, descriptive information about the project is registered. This includes data about cost and schedule as well as the size of the project management team. This information is entered into the database by the project manager and project cost controller in a process that is facilitated by the company's trained and certified 10-10 coordinator. The second part of the data are collected through a questionnaire developed by CII that has been translated to the Norwegian language. The questionnaire is based on their research on best practices (Yun et al. Citation2016) and the English version can be viewed in detail here: www.10-10program.org. The respondents to the survey are project participants selected by the project manager and the company's 10-10 coordinator. Most organisations conduct this survey as a workshop where all respondents are gathered in a common meeting room and all respondents register their response using their personal laptop. The company's 10-10 coordinator facilitates this workshop and clarifies any questions the respondents may have regarding specific questions, terms or contextual issues. In total, 1494 persons have participated. This gives an average of 11.2 respondents for the 134 cases in the dataset.
3.3. Descriptive information about the dataset
The dataset contains data from a total of 134 different project cases from the period between 2010 and 2020. The distribution was as follows: 2010–2013: 9 cases, 2014–2017: 89 cases, 2018–2020: 36 cases. The cases are collected from 26 different companies.
provides a descriptive summary of the cases in the dataset in terms of project category, project nature, delivery method and compensation format.
Table 2. Descriptive project information and frequency distribution.
The 134 cases are divided into two project categories: building projects (78 cases) and infrastructure projects (56 cases). The projects are also distributed across the different types of project nature as defined by CII: Greenfield projects (85 cases) are projects that contain new-builds. Brownfield projects (3 cases) describe projects where existing facilities are redeveloped for another use. Addition/expansion projects (8 cases) describe projects where a new addition is constructed to an existing facility. Modernization/renovation/upgrade projects (38 cases) describe projects where the work is related to upgrading or renovating an existing facility.
We can also classify the cases in the dataset by various delivery methods: Design-Bid-Build (50 cases), Design-Build (68 cases), Parallel Primes (14 cases), Integrated Project Delivery (1 case) and Construction Management at Risk (1 case). Finally, the cases can be sorted based on the compensation format used in the contracts as follows: Cost-Reimbursable (25 cases), Unit Price (14 cases) and Lump Sum (56 cases). One should note that the compensation format is only registered for 95 of the 134 cases. For the remaining cases, the compensation format is not specified in the dataset.
provides a summary of the descriptive statistics related to project total cost, project total duration and project complexity. All cost data have been collected in the local currency, which is Norwegian kroner (NOK). In this paper, we have calculated all cost data in US dollars (USD) based on the annual average exchange rate between Norwegian kroner and US dollars in the year 2018 as published by the Central Bank of Norway. This exchange rate is 8.1337 NOK/USD.
Table 3. Descriptive statistics: cost, duration and complexity.
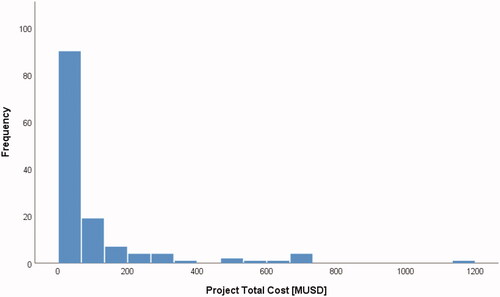
The mean total cost for the projects in the dataset is USD 102 million. This number refers to the total cost of the entire project through all its life cycle stages. The median value for the total project cost is USD 36.1 million. The relatively large difference between the mean and the median value, and the high standard deviation, indicates that a few projects have a significantly higher total cost than the majority of the projects in the dataset. The histogram provided in shows the frequency distribution where this skewness can be seen. The project with the highest total cost was building a new hospital at the total cost of 1161 million US dollars.
Figure 2. Frequency distribution of cases in the data set: project total cost.
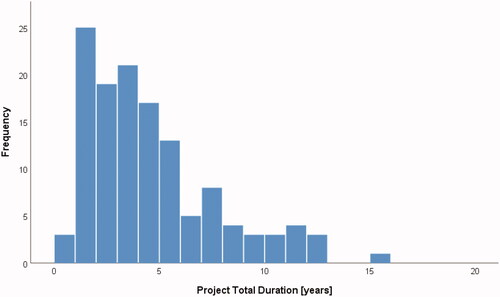
The mean total project duration is 4.4 years while the median value is 3.6 years. The frequency distribution can be seen in and it shows how a few projects have a significantly longer duration than the majority of the projects in the dataset. Projects with long duration are all infrastructure projects where new high-voltage power lines are constructed over vast distances. The project with the longest duration took 16 years until it was completed in 2016 after constructing a high-voltage (420,000 volts) power cable between two Norwegian cities 300 km apart.
Figure 3. Frequency distribution of cases in data set: project total duration.
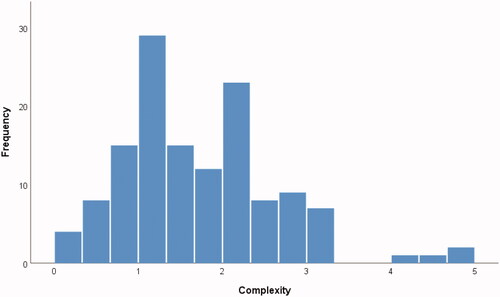
One of the factors mapped by the benchmarking tool is project complexity, where nine different elements of complexity were listed, and the respondents were asked to tick all of those that were relevant for their project. A total complexity factor was calculated based on this. The mean and median values for complexity were 1.72 and 1.54, and shows the frequency distribution for project complexity. The project that recorded the highest complexity value (4.80) involved building Norway’s largest electrical transformer plant underground in an urban residential area. The project that recorded the lowest complexity value (0.28) involved constructing a new apartment building in a low congested area.
Figure 4. Frequency distribution of cases in data set: project complexity.
3.4. Calculation of project head size
To calculate the project head size for a project we introduce EquationEquation (2)(2)
(2) , where we summarise the Project Management (PM) costs for the client and the contractor before we divide this by the total project cost. Hence, we can express the project head size as a dimensionless number indicating the proportion of the total project cost that is spent on project management.
(2)
(2)
To calculate the PM cost, we first calculate the number of person-hours spent on project management by multiplying the duration of the project with the mean size of the management team. The detailed size of the project management team has been recorded in the 10-10 database by the project's cost controller or project manager in a process facilitated by the company's 10-10 coordinator. For example, if the team on average consisted of 6 people working full time, 12 people working 50% and 22 people working 25%, the average team size is equivalent to 17.5 full-time positions: (6 × 1.0 + 12 × 0.5 + 22 × 0.25 = 17.5). The following personnel categories were included in the project management team: Project sponsor, project manager, procurement manager, engineering manager, finance manager, contract manager, construction manager, commissioning manager, quality and safety manager, operation manager, legal and business consultants, project controllers, project administrators, quality control engineers, business unit personnel and contract engineers.
Based on the average size of the project management team for the project we can calculate the staffing cost based on the salary statistics that are presented each year by the organisation Norwegian Society of Graduate Technical and Scientific Professionals (Tekna). We assume that the average project management team member is a professional engineer with 15 years’ experience. In 2018, Tekna members that work in the construction sector, and hold an engineering degree from 2003, earned an average yearly salary of USD 114,242.
According to Statistics Norway, a mark-up of 22% must be added to direct salary to cover the indirect costs for employers in the construction industry. The total cost of employing a professional engineer with 15 years' experience in the project management team in the Norwegian construction industry is therefore on average USD 0.139 million. If the project duration was 2 years, the total project management cost for this example would be: 17.5 × USD 0.139 m/year × 2 years = USD 4.87 million. This calculation exercise was conducted for all the 118 cases in the dataset. Finally, we calculate the head size according to EquationEquation (2)(2)
(2) .
3.5. Criticism of the research method
The following section contains reflections and addresses shortcomings and criticism of the research methods used in this paper.
3.5.1. Reliability of the dataset
The data was collected mainly during defined workshops in the benchmarked projects to reduce the participant error. These workshops are facilitated by a certified Nordic 10-10 coordinator and relevant people from the project is gathered in a meeting room and register data and respond to survey questions on their personal laptops. The 10-10 coordinator is present during these workshops to clarify questions or contextual issues related to the questionnaire.
When it comes to the risk of participant bias, there are two aspects worth mentioning. First, being measured does affect behaviour (Spitzer Citation2007) and there is a risk that participants in their daily work may focus more on elements that they know will be measured through the Nordic 10-10 programme. There is also a risk of participant bias as many participants are responsible or accountable for the project outcome. This may have influenced how respondents answer certain questions, as they may have an incentive to make their project ‘look better than what it really is’.
The project management cost for each project was calculated based on the average size of the project management team multiplied with annual salary statistics in Norwegian construction industry provided by the organisation Norwegian Society of Graduate Technical and Scientific Professionals (Tekna). This simplification may have affected the accuracy of the results as the salary cost may vary between different projects. Another aspect worth mentioning is that some of the personnel who have been classified as part of the project management team may also have duties that are not purely managerial but also partly contribute directly to production. This can for example be an engineering manager who may (in particular for small projects) spend some of his or her time to produce production drawings in addition to more managerial duties.
External validity of the dataset from Norwegian construction projects
In terms of external validity, the dataset consists of cases from Norway. However, the projects are mainly related to the construction of various buildings such as schools, offices and apartment buildings and construction of infrastructure such as roads and powerlines. These are all types of projects that are not unique to Norway but relevant for most parts of the world.
A decade ago, Bygballe, Jahre, and Swärd (Citation2010) found that the use of collaborative delivery methods, in general, are less common in the Nordic construction industry compared to other regions such as the UK and South-East Asia. In the Norwegian construction industry, the use of IPD appears to recently have become more popular. Recent case studies from IPD projects in Norway include the construction of a large hospital (Bygballe and Swärd Citation2019) and construction of a complex laboratory research building (Engebø, Klakegg, et al. Citation2020). Although gradually becoming more popular in Norway, the use of collaborative delivery methods still appears to be limited to a few big construction and infrastructure projects. This is also reflected by the dataset in this paper and. Since many construction projects still apply traditional delivery methods our findings may be generalised, at least to a certain extent, to other countries outside the Nordic region.
4. Findings and analysis
In this section, we present the findings from our study. First, we present a summary of the average project head size in the dataset before we present correlations with four different project characteristics. The findings presented in this paper are based on data collected from a questionnaire conducted by the Nordic 10-10 benchmarking project.
4.1. Project head size in Norwegian construction projects
We see from that 18% of the total project cost is associated with project management within the client’s and the contractor’s organisation.
Figure 5. Relative portion of cost spent on project management in project.
In , we present details about the size of the head for the client and the contractor’s organisation. The left column shows the proportion (of the total project cost) spent on project management within the client’s organisation while the right column shows the proportion (of the total project cost) spent on project management within the contractor’s organisation. We see from that the size of the project head is not dominated by the client (8%) or contractor (10%) perspective but is fairly equally split between the two perspectives.
Figure 6. Distribution of project head size between client and contractor.
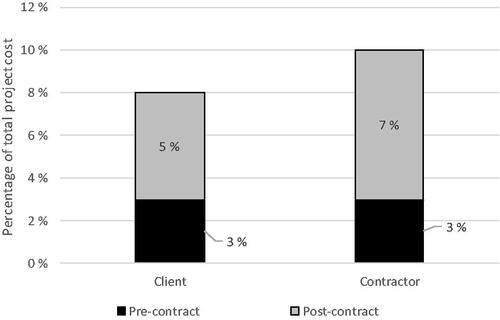
In terms of project phases, the findings have been separated into pre-contract and post-contract phases following the definition and framework suggested by Li, Arditi, and Wang (Citation2015). From we see that both the contractor's and the client's project management team is smaller in the pre-contract phase than in the post-contract phase.
4.2. Correlation with four different project characteristics
In we present how the size of the project head correlates with the following four project characteristics: complexity, cost, duration and burn rate. Project complexity is calculated as a common factor based on how project members rated the complexity of their project in terms of each of the following aspects: Size, schedule, contract strategy, diversity of project team, technology risks, process scope, supply chain reliability, external stakeholders, traffic control, location, work zone congestion. The second characteristic is total project cost measured in million USD. This number includes the total cost of conducting the project through all its phases and includes the contribution from all contractors, subcontractors, consultants, etc. The third characteristic we apply is the total project duration. This is reported in number of weeks it took from the start of the concept phase until the execution phase was finished. A fourth parameter is the project’s burn rate. This parameter combines the total cost and the total duration and tells us something about the intensity of the project. The burn rate is simply calculated as total cost divided by total duration (Yun et al. Citation2016) and is reported in terms of USD million per week.
Table 4. Correlations between amount spent on management and project characteristics.
The reported results in are Pearson correlations based on bi-variate analysis using the SPSS software. Values close to zero indicate that the correlation between two variables is low, while values close to one indicates that the relationship is strong (Bryman Citation2016). With regard to labelling the strength of a correlation, an often cited source for social research is Taylor (Citation1990) who recommends the following thresholds to describe the strength of a correlation value: weak <0.35, moderate 0.35–0.67 and strong >0.67. In medical research, a common rule of thumb is as follows (Mukaka Citation2012): negligible <0.30, low strength 0.30–0.50, moderate strength 0.50–0.70, high strength 0.70–0.90, very high strength <0.90. We cannot evaluate the strength of the relationships alone, as we should also check to what level these are statistically significant. The level of statistical significance says something about the extent to which we can expect that our findings will apply also to cases that are not part of our dataset, and in social research a statistical significance below 0.05 is considered acceptable (Bryman Citation2016). As always, when we analyse correlations, we should remember that such values only indicate the correlation between two variables and not the cause and effect. Using correlations to explain cause and effect is a common error, and we have to use other methods to investigate specific causes and effects (Bryman Citation2016).
First, we found only a weak, and not statistically significant, correlation of −0.031 between the portion spent on project management and project complexity. We do not find any clear relationship between how complex a project is and how much money is spent on managing the project.
Second, we investigated the correlation between the percentage of the project budget spent on management and the total project cost. From we can see that there is a weak correlation of −0.106, which is not statistically significant.
Third, we analysed the correlation with project duration. Here we see that there is a weak correlation at −0.143, which is also not statistically significant. We can therefore not establish a relationship between the proportion of the project budget that is spent on management and the duration of the project.
Fourth, we investigated the correlation between relative amount spent on management and the burn rate in the project. We see that there is also here a weak (−0.126) and not a statistically significant correlation between the amount spent on management and the project burn rate. Projects with high burn rates do not appear to spend a smaller ratio of their total budget on project management compared to projects with lower burn rates.
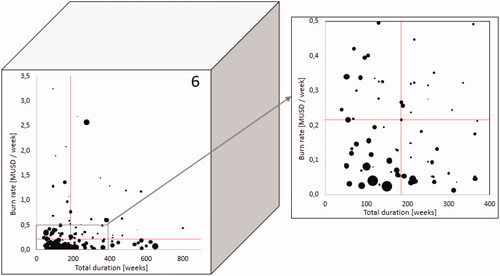
4.3. Detailed findings from multidimensional analyses
To gain a more comprehensive understanding of how the relative project head size varies between projects with different characteristics, we need to study several dimensions in relation to each other. Simply looking at the two-dimensional correlations in only offers limited insight. To gain more insight we must study several project characteristics at the same time, and we introduce a cube as shown in . On each of its six faces, we plot the project relative size of the project head as a function of two project characteristics. Using all six faces we can plot the project head-to-body ratio for each of the six different possible combinations of project characteristics in terms of complexity, cost, duration and burn rate. We can then rotate the cube to study the project head-to-body ratio of projects with different combinations of characteristics.
Figure 7. “The cube” – a tool for multidimensional analyses.
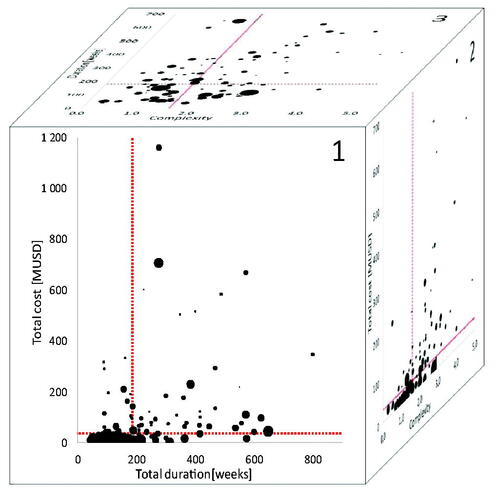
On each plot, the project head-to-body ratio is plotted as a circle, where the size of the circle indicates the size of the project head as calculated by EquationEquation (2)(2)
(2) , i.e. the portion of total project cost spent on project management. Each circle represents a project from the dataset. Large circles indicate that the specific project had a large head compared to its body, while smaller circles and dots indicate that the head of the specific project was small compared to its body. The location of the circle in the plot describes the value for the specific project in terms of two project characteristics shown along the horizontal and vertical axis.
The vertical- and horizontal dotted red lines in the plot indicate the median value for the dataset. For , this means that projects on the left side of the vertical dotted line have a duration below the median, as opposed to those projects to the right of the vertical dotted line, which has a duration higher than the median. Similarly, the horizontal dotted red line shows the median of the project cost. Projects below the line have a total cost lower than the median value in the dataset and projects above the horizontal dotted line have a total cost higher than the median value.
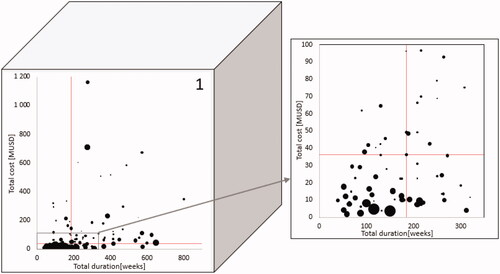
4.3.1. 1st face – cost and duration
If we look at the first face of the cube, shown in , we see that the vertical axis indicates the total project cost while the horizontal axis shows the total project duration. We see that the majority of the large project heads are found in the lower left quadrant of the figure. This means that projects with low total cost and short duration spend a larger portion of the total budget on project management compared with projects that have a higher total cost and longer duration.
Figure 8. Face 1 – cost and duration.
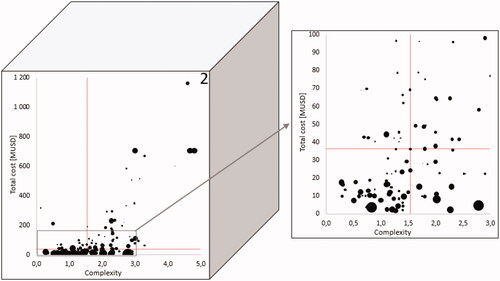
4.3.2. 2nd face – cost and complexity
Moving on to we show the second face of the cube where each project is plotted based on its total cost and complexity. Projects with high cost and high complexity are found in the top right quadrant of the plot as opposed to projects with low cost and low complexity, which are found in the lower left quadrant. On this plot, the large project heads are scattered in multiple quadrants and the plot does not show a clear pattern.
Figure 9. Face 2 – cost and complexity.
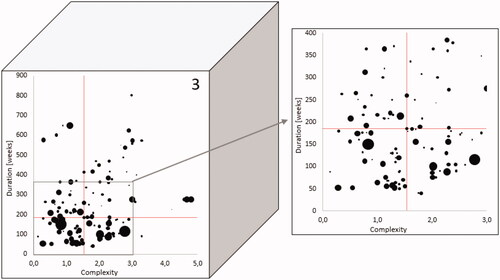
4.3.3. 3rd face – duration and complexity
The third face of the cube is shown in . In this figure, projects with high complexity and long duration are found in the top right quadrant, while projects with low complexity and short duration can be seen in the lower left quadrant. Multiple large project heads are found in each of the four quadrants and this indicates that there is no particular pattern to be found.
Figure 10. Face 3 – duration and complexity.
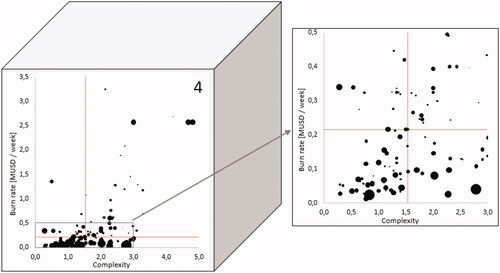
4.3.4. 4th face – burn rate and complexity
shows the fourth face of the cube and combines burn rate with complexity. Complex projects with a high burn rate are seen in the top right quadrant while less complex projects with low burn rate are found in the lower left quadrant. Many large project heads are found in projects with low burn rate, i.e. projects found in the lower left and lower right quadrant. However, some of the projects with very high burn rate and complexity also had a large head.
Figure 11. Face 4 – burn rate and complexity.
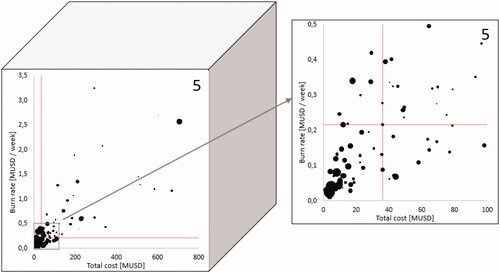
4.3.5. 5th face – burn rate and cost
The combination between burn rate and cost is shown in . It may seem like most of the large project heads are found in the lower left quadrant, but there are also several projects in the other quadrants with large project heads.
Figure 12. Face 5 – burn rate and cost.
4.3.6. 6th face – burn rate and duration
shows the sixth and final face of the cube which combines burn rate and duration. From this plot we can see that most of the projects in the lower left quadrant have large project heads. However, there are also several large projects present in the other three quadrants.
Figure 13. Face 6 – burn rate and duration.
4.4. Key findings from analyses of project head size and project characteristics
Based on the detailed findings from correlation- and multidimensional analyses, we have identified four key findings that are elaborated further in the following section.
4.4.1. No linear relationship between project head size and project total cost
The correlations presented in indicate that there is not a simple linear relationship between the size of a project in terms of cost, and how large its project head is. Common wisdom suggests that smaller projects would spend a relatively high portion of their budget on project management as they for example face similar mobilisation costs as larger projects. For example, one could expect that a project with a total cost of USD 10 million may have spent a significantly higher portion of its budget on project management than what one should expect from a project costing USD 100 million. One reason for this difference may typically be mobilisation and support activities. A smaller project may require many of the same functions in its project management team as a large project. For example, the controller function is needed for small projects as well as for larger projects. However, the number of controllers needed does not increase linearly for larger projects.
4.4.2. Projects with short duration and low cost often have large heads
The fact that we found no simple two-dimensional correlation with project head size and total costs indicates that there are also other dimensions that influence the amount of project management activities in a project. It is interesting to see that projects with longer duration do not necessarily spend more on project management than projects with shorter duration. When we look at the face 1 () and face 3 () of the cube we see that there are large heads for projects on both side of the median duration value. One could expect that as a project takes longer, the project management portion of the total cost would increase, simply because the people in the project management team will be employed for a longer period and therefore paid more than if the project was executed faster. However, when we combine cost and duration, we see a pattern where projects with small costs and short duration appear to have a high head-to-body ratio.
4.4.3. The significance of burn rate
However, to better understand the combination of cost and duration, we can assess the burn rate of the project. If we use the analogy of driving a car, the burn rate tells us "how fast the project is driving’. The duration only tells us for how many hours we have been driving while the total cost tells us the distance of our journey. Projects with low burn may therefore experience that a higher portion of their total budget is spent on project management than other projects simply because they are driving very slowly and have to pay the driver for a longer time even though the distance they cover is short. We see this clearly as we turn the cube to . Projects with long duration and high burn rate are found in the top right quadrant and we see that none of these projects have large project heads as opposed to those in the lower left quadrant with low burn rate and short duration. A particularly interesting learning point from this is that projects with long duration do not necessarily spend a large portion of their total budget on project management if they have a high burn rate.
4.4.4. The complexity of complexity
Another aspect that we know affects the size of the project management team is the project complexity. If we once more follow the analogy of driving a car, we can say that the complexity reflects the road condition and how difficult it is to drive on it. A general assumption would be that complex projects need more management than less complex projects. When we look at we see that there is no clear correlation simply between complexity and project head size. We also see this by looking at face 2, 3 and 4 of the cube () as there are clearly projects with large project heads with both high and low complexity. At first glance, this may come as a surprise as common wisdom suggests that more complex projects require a larger project management team than less complex projects. However, this becomes more interesting when we also look at the other characteristics at the same time. Total cost, duration and burn rate are also aspects that influence the proportion of the project budget that is spent on management. Generally speaking, projects with high complexity require more management than less complex projects, but that does not necessarily mean that a larger portion of the total budget is spent on project management. Projects with high complexity will in general also have more resources available and a higher budget and therefore even though the project is complex and require a large project management team, the cost of this team is divided by a larger total budget. Looking at EquationEquation (2)(2)
(2) , this means that the numbers both over and under the division line will increase. Hence, the project head size may still be relatively small compared to the project's body even for complex projects. When complexity increases in a project, it may not only be the head of the project that becomes bigger; the project body may also grow. Complex projects may require the use of more advanced technology and assets and the cost of conducting the work itself will also increase.
If we look at complexity in combination with burn rate (), we see that the largest project heads are found for complex projects with low burn rate, i.e. complex projects that progress at a relatively slow speed. High complexity is also among the most common causes of project delays (Zarei, Sharifi, and Chaghouee Citation2018). One reason for this may be periods where work has to stop and wait for a period – for example, due to a complex interface picture. In such situations it may not be feasible to demobilise the project management team during the waiting period, hence these project management costs may keep running in periods where little work is conducted by the project body itself.
4.5. Project head size for different delivery methods and compensation formats
In , we present the detailed findings separated by the two most frequent used project delivery methods in the data set and the two most frequently used compensation formats in the dataset (also see ). First, we learn that the mean project head size for the 50 projects that applied Design-bid-build was 15.7% compared with 20.3% for the 68 projects that applied Design-build. A student t-test was conducted and the Sig. (2-tailed) value in the rightmost column is 0.28. Since this value is above 0.05 it indicates that the difference we found between the two delivery methods is not significant, and we cannot claim that there is a systematic difference in project head size between projects that apply Design-bid-build and projects that apply Design-build.
Table 5. Mean project head size for different delivery methods and compensation formats.
Moving on, we see that projects that applied Lump sum compensation format had a mean project head size of 24.7% compared to 8.2% for the projects that used Cost-reimbursable compensation format. Also, the student t-test suggests that this may be a systematic difference as the Sig. (2-tailed) value is below 0.05.
5. Discussion and contributions
In this section, findings are discussed and contributions to theory and practice are highlighted.
5.1. The size of transaction costs
Our study indicates that at least 18% of the total cost in construction projects is spent on managing the project. Previous studies that quantify project transaction costs are limited to cover either a specific perspective (client or contractor) or a specific phase (pre-contract or post-contract). The research in our study covers both the client and the contractor perspective for both pre-contract and post-contract phases. Hence, it is only of limited value to directly compare the total 18% found in this paper with previous studies. However, it is possible to dissect the findings from our research and compare them element by element to what others have found previously. This can be seen in where findings from previous research have been summarised. The findings from our research have been split accordingly and added in the lowest row of the table.
Table 6. Findings from this paper compared with previous research: transaction costs in construction projects as percentage of total project cost.
5.1.1. Contractor's transaction costs
In a study by Petersen et al. (Citation2018) pre-contract transaction costs were found to be 5% of the total cost in a project. However, this is limited to contractor's pre-contract transaction costs, i.e. the contractor's costs associated with preparing and negotiating bids, and it does not include post-contract transaction costs. The study was based on a survey among 261 private contractors in various industries in Denmark where respondents reported the size of their pre-contract transaction compared with the total cost.
We found that the contractor in total spends 10% of the total project budget on transaction costs. In terms of the difference between the pre-contract and post-contract phase, the split was 3% and 7%. Hence, we found lower pre-contract transaction costs for the contractor than what Petersen et al. (Citation2018) found. Our findings are also lower than the findings from the research presented by Soliño and Gago De Santos (Citation2010) who collected data from infrastructure projects in EU countries conducted in the period between 1992 and 2007. They found that contractor's pre-contract transaction costs were on average 6.5% of the total cost of a project. Dudkin and Välilä (Citation2006) found that contractor's pre-contract transaction costs were on average 10% of the project cost in their study of 55 projects from six different sectors in the UK. One reason for this difference may be that our study measures pre-contract transaction costs for the contractor that won the job, while the above-mentioned studies also include transaction costs for unsuccessful bidders.
The research by De Schepper, Haezendonck, and Dooms (Citation2015) and Farajian (Citation2010) is also limited to cover pre-contract transaction costs borne by the contractor. However, both these studies found transaction costs to be less than 2% of the total project cost. This is similar to what we found. It is worth mentioning that both De Schepper, Haezendonck, and Dooms (Citation2015) and Farajian (Citation2010) covered infrastructure projects while the research in this paper covers a combination of infrastructure projects and building projects. However, when sorting the findings in this paper between infrastructure and building projects we find only minor differences in terms of the size of the transaction costs between these two types of projects.
None of the previous studies cover the contractor's post-contract transaction cost. However, the findings from our study indicate that the contractor experiences more than twice as high transaction costs in this phase compared to the pre-contract phase.
5.1.2. Client's transaction costs
Moving on, it is also interesting to compare the findings in this paper with the research conducted by Li, Arditi, and Wang (Citation2014), as their research covered both pre-contract and post-contract transaction costs for clients. They found these to be, on average, 7% of the total project cost. Their findings were based on an e-mail survey among 239 clients in US construction. Compared with these findings one can see that our findings are similar. Both studies found that the client's transaction costs were 7–8% of the total project cost and that the client experienced higher transaction costs during the post-contract phase than during the pre-contract phase. In other words, the client's costs to monitor and administrate the work conducted by its contractor(s) were higher than the costs experienced prior to contract signing. Whittington (Citation2008) did not separate client's transaction costs into phases but found, from a case study of six US highway projects, that the client's transaction costs were on average 13.5% of the total project cost. This is somewhat higher than what Li, Arditi, and Wang (Citation2014) and we found.
5.1.3. Estimation of project management costs
When planning new construction projects, existing data from similar projects in the past are commonly used as reference (PMI Citation2017). Even though every project is unique, a planner can use data from previous projects and scale these carefully in order to prepare the best possible plan or forecast (Kim and Kwak Citation2018).
Abou-Ibrahim et al. (Citation2019) highlighted the importance of being aware of the specific project characteristics to ensure that scaling data from a previous project is done in such a manner that it gives the best possible plan at the time. The term ‘uniformed planning’ refers to situations where data from projects conducted in the past are scaled to predict future projects without being properly informed about the variations of the characteristics between the specific projects. Our findings echo this and show that when estimating the size of the project management team, projects characteristics in several dimensions have to be assessed at the same time. Simply scaling based on a two-dimensional relationship appears to be too simple for most projects.
5.1.4. The Scandinavian context
The context of the Scandinavian school of project management is commonly viewed as more focussed on the organisational perspective of project management (Andersen Citation2016; Walker and Lloyd-Walker Citation2016), where there is more focus on building trust (Strand and Freeman Citation2015) in the relations between the actors (Aarseth Citation2014). Projects with higher trust should need less management (Williamson Citation1996) and one could therefore be tempted to assume that the project head size in Norwegian projects may be smaller than in other parts of the world. However, the trust level in Scandinavian projects can certainly be debated and Kadefors, Björlingson, and Karlsson (Citation2007) found a generally low level of trust between clients and contracts in their study of Swedish construction projects. The head size of the projects in our study may therefore very well be similar to projects from other parts of the world but this is difficult to verify, as we have not found any other studies that are directly comparable.
5.1.5. Other transaction costs than project management
The 18% that we found in our study only includes the direct cost of paying the project management team in the client's and the contractor's organisation.
Regarding transaction costs, project management is not the only transaction cost in a project. Our number for project management costs does include some indirect cost in addition to the salary paid to the project management team, but there are several other transaction costs that are not covered at all or only partly covered in the 18%. Some projects may purchase external services to cover for advisors and subject matter experts. Such costs may not be covered in our data unless they have been registered as part of the in-house project management team. We expect that this varies between the projects in our dataset. Some of the projects probably have a higher degree and width of in-house capabilities than others. We suspect in particular that projects with high complexity may use more external advisors and experts than less complex projects.
Other examples are the transaction costs associated with conflict resolutions and rework (Love, Ika, et al. Citation2019; Wang, Yap, et al. Citation2019). In some cases, conflicts are taken to the courtroom with significant legal fees (Lu, Zhang, and Pan Citation2015). A famous of example of this is the Wembley Stadium litigation, where the cost of photocopying legal documents for the hearings alone totalled GBP 1 million and the total legal cost ended at £22 million (Jackson Citation2008). Many of such transaction costs are not covered in the dataset in our study and the total level of transaction costs are therefore most likely higher than the 18% we found.
5.2. Measures to reduce transaction costs in construction projects
Existing literature suggests several measures that contribute to better project performance. As we have found that a significant portion of the total cost in a project is transaction costs, we will now discuss how various measures can contribute to reduce project transaction costs and the total cost of a construction project.
5.2.1. Flatten the supply chain
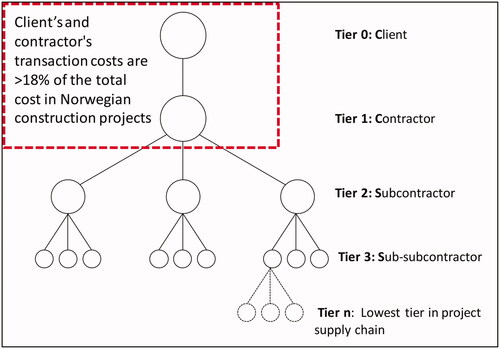
In transaction cost economics, the make-or-buy decision relates to whether a firm produces the goods itself or pays another firm to produce it on its behalf (Williamson Citation1975). The ratio between how much work a firm conducts itself and how much work it pays others to conduct for it is expressed as the make/buy ratio. A low make/buy ratio indicates that the supply chain is fragmented with many actors in multiple tiers. A high make/buy ratio indicates the opposite, i.e. a flat supply chain that consists of relatively few actors.
From a transaction cost point of view, the make/buy ratio in a project's supply chain is relevant. A flat supply chain (where most production occur at the higher tiers) should have lower transaction costs than a supply chain with many tiers as there are transaction costs associated with managing each of these tiers (Williamson Citation1975). This suggest that projects with a flat supply chain spend less resources on project management compared to projects where the make/buy ratio is low.
The 18% transaction cost found in our study reflects only part of the total picture as we only cover the top two tiers in the value chain, as illustrated in . The project management cost in the organisations lower down in the value chain will contribute to further increasing the total project head size compared to the body. Subcontractors and their sub-subcontractors also spend resources on project management that need to be added to the 18% already spent by the client and the contractor. It would be very useful if future studies included details about these lower tiers in the value chain in order to investigate how flattening the supply chain can have a positive effect on project transaction costs.
Figure 14. Transaction costs in Norwegian construction projects.
5.2.2. More digitalisation and automation
Digitalisation and automation currently receive significant attention in the construction industry, both by scholars and practitioners. Examples include; cloud-based building information modelling (Goulding, Rahimian, and Wang Citation2014), off-site construction (Yin et al. Citation2019), additive manufacturing (Ghaffar, Corker, and Fan Citation2018) and robotics (Yang, Pan, and Pan Citation2019). However, even though the construction industry is in the middle of a digital transformation, it has been accused of being less digitalised than other sectors (Leviäkangas, Mok Paik, and Moon Citation2017). Decision making in many construction projects still often contains a majority of traditional processes (Le et al. Citation2020; Yarahmadi et al. Citation2016). In comparison, the manufacturing industry often uses smart technologies that involve capture of data to achieve more efficient, and often automated, decision making (Kang et al. Citation2016) leading to multiple positive effects (Cheng et al. Citation2018). Even though the nature of managing a construction project is different from manufacturing of large production runs, the digitalisation trend in the construction may harvest similar effects that have been achieved in the manufacturing industry. This should lead to more effective project management and decision-making processes resulting in reduced transaction costs.
5.2.3. Use collaborative delivery methods
Our data also allows us to make some observations related to project head size and different delivery methods. In our dataset, Design-Bid-Build was used by 50 projects and Design-Build was used for 68 projects. Whittington (Citation2008) suggests that transaction costs in Design-Bid-Build projects may be 25% higher than for projects that use Design-Build. However, we found no particular difference in the project head size between projects that used these two different delivery methods.
Collaboration and the use of collaborative delivery methods should lead to reduced transaction costs and win-win situations for all parties (Bititci et al. Citation2007). Increased trust is an example of one of several potential positive outcomes when applying collaborative delivery methods (Børve Citation2019). More trust leads to less opportunism and fewer change orders and claims (Kadefors Citation2004). Since the numbers found in this paper are mainly based on projects that apply more traditional delivery methods, one can assume that the number would be lower than 18% if more projects in the dataset had used collaborative delivery methods such as partnering, IPD or alliancing.
When it comes to different compensation formats, we do see some differences. The project head size was in general larger for the 56 projects that used lump sum compensation formats than for the 25 projects that used a cost-reimbursable compensation format. The project head size for cost-reimbursable projects was approximately 60% of the size of the project head for lump sum projects and we found through a student t-test that this was a systematic difference. This finding supports previous research by Li, Arditi, and Wang (Citation2014); Li, Arditi, and Wang (Citation2013) who found that transaction costs were significantly higher in projects that used lump sum compensation compared with other types of compensation formats.
5.3. Contributions and implications
In this section, we highlight the main contributions from our work and outline its practical implications for practitioners in construction projects.
5.3.1. Identifies transaction costs as an area where significant cost savings can be achieved
The main contribution from this paper is that we have identified that a significant part of the total project cost is caused by transaction costs. Past research was limited to either certain perspectives or certain phases while our study takes a holistic approach. Our study includes transaction costs both for the client and contractor in both the pre-contract and post-contract phase of the project (see ).
We have identified that there is a significant potential for cost savings in construction projects by improving transaction cost, as at least 18% of the project budget is spent on such costs. While many initiatives over the years have contributed to reducing production costs in projects, our study identifies the potential for how further cost reductions can be achieved through more optimised transaction costs. In that respect, our work may trigger research that investigates how transaction costs can be improved and help solve the problem with poor cost performance in construction projects.
In the latest edition of Project Management Body of Knowledge (PMBOK), transaction costs are not mentioned once (PMI Citation2017). It is a paradox that so little is known about project transaction costs, in particular in lieu of the findings in this paper where transaction costs are identified as a significant part of the total project cost. Our research, therefore, contributes to raising the awareness of the importance of project transaction costs and its relevance for the body of knowledge in project management.
This paper also provides a benchmark that future studies can compare their findings against. It would be particularly valuable if future studies are conducted on projects using collaborative delivery methods or using a high degree of digitalisation. The findings from such studies can then be compared with our findings in order to measure the positive effects from collaboration and digitalisation.
5.3.2. Introducing the term ‘project head size’
In order to ‘operationalise’ the term transaction costs in the project management community, we have introduced the term ‘project head size’. This illustrates the relative size of costs associated with controlling and managing a project compared to the total size of the project. Project managers may for example use the analogy of ‘head-to-body ratio’ when they communicate with stakeholders and colleagues. A high head-to-body ratio indicates that a relatively large portion of the project's resources is spent on managing the project. The opposite indicates that less resources are spent on management and more is allocated to production (the body). The head-to-body ratio can also be used as a performance indicator when benchmarking project performance.
5.3.3. Introducing a tool for multidimensional benchmarking of management cost
The third contribution from this study is that we show how the project head size vary for projects with a combination of characteristics such as complexity, size, duration and burn rate. To understand the size of a project's head, we must look at several dimensions of the project characteristics at the same time, not only how it correlates or not to one of these. We provide a set of data that project managers can use to compare their size of project management team with other similar projects. Instead of simply scaling data from their own database of previous projects a project manager can now use the cube provided in this paper and look at the project head size from other projects with similar characteristics in terms of complexity, cost, duration and burn rate to refine their own estimates against other companies in the construction industry.
A general trend in the construction industry is that it is moving from reactive project management, where the focus is on responding to problems, towards a more proactive project management where performance measurements and benchmarking tools are used with the aim of avoiding or minimising problems before they occur (Meng Citation2020). This paper also shows how it is possible to use data from benchmarking tools, such as 10-10, to investigate transaction costs for large data set. Much of the existing research on the topic is based on case studies or surveys. Analysing secondary data from a database with detailed project information that is collected consistently from many different projects allows for interesting statistical analyses that may lead to further insights.
6. Conclusions
The purpose of this paper was to investigate what proportion of the total cost in construction projects is spent on managing the project. By analysing data from 134 Norwegian construction projects, of varying size, duration and complexity, we addressed the following research question:
RQ: What proportion of the total cost in construction projects is spent by the client and its contractor to manage the project?
Conclusion: We found that on average, 18% of the total project cost is spent on project management by the client and its contractor.
Using the taxonomy of anatomy, the project head refers to those activities related to planning and controlling the project, while the body refers to activities related to producing the deliverables from the project. Within the framework of transaction cost economics, we quantified transaction costs in construction projects in terms of the size of a project's head compared to the size of its body. The total cost of a project is the sum of its transaction costs and its production costs (Lee et al. Citation2009; Walker and Kwong Wing Citation1999; Williamson Citation1979). This study identified that at least 18% of the total costs in a construction project are spent on transaction costs.
Findings from this paper have implications for both theory and practice when it comes to quantifying project transaction costs. The research presented in this paper contributes to increasing knowledge about the size of project transaction costs. Currently, only a handful of empirical studies exist that attempt to quantify project transaction costs, and these are mainly limited to certain aspects. Existing studies are either limited to certain phases, such as pre-contract or post-contract, or to one perspective (either client or contractor). In that respect, this paper claims to contribute with empirical data that cover both pre-contract and post-contract transaction costs experienced from both the client and the contractor perspective. Currently, the lack of research on project transaction costs impedes a rational debate and this paper contributes with more hard data as a step to allow for further debates.
Also, this paper reveals that there may be a significant potential for improving cost performance in construction projects by reducing transaction costs. The construction industry has long been accused for its poor productivity and initiatives aimed to lower transaction costs should lead to better cost-performance in future construction projects.
Increased collaboration in the client-contractor relationship, flattening the supply chain and implementing more digitalisation and automation, are examples of initiatives that can contribute to reducing transaction costs.
While this study shows that there should be a clear motivation for reducing transaction costs, these are not simply waste to be eliminated. Production costs and transaction costs should be balanced to find the optimum balance that gives the best total performance. The size of the project management has to be sufficient to ensure that the project reaches its goal.
Finding the right balance between cost and benefits will ensure that the project management team is large enough to ensure that the project is well controlled and achieving its goal, but no larger than it has to be for the specific project. By finding the right balance, transaction costs can be optimised so that the total project cost is reduced and cost overruns avoided.
For practitioners, this paper introduces the term project head size as a way to illustrate the relative size of a project's transaction costs (the head) compared to the size of the project body where production occurs. Furthermore, the paper contains a set of data that project managers may find useful. Instead of simply scaling data from their previous projects, project managers can now look at the project head size from other projects with similar characteristics in terms of complexity, cost, duration and burn rate to refine and benchmark their own project estimates.
7. Limitations and further research
Although the research is based on a substantial dataset it has two main limitations. The first limitation is the fact that the dataset is based only on projects in Norway. Although we believe that findings from Norway can be generalised, at least to a certain extent, we acknowledge that the findings must be seen within the Scandinavian project context. A second limitation is that our study only covers the two-top tiers of the value chain as our dataset does not include number of hours spent on project management by subcontractors, advisors and architects. One can therefore assume that the size of the project head is higher than 18% once more tiers of the value chain are included. It would be particularly useful if other researchers study the number of hours spent on project management lower in the value chain to make the picture more complete.
Another relevant aspect is related to project delivery methods. The majority of the projects studied in this paper used traditional project delivery methods. It would therefore be particularly interesting if future studies included more projects that use higher-order collaborative project delivery methods such as partnering, IPD or alliancing.
Disclosure statement
No potential conflict of interest was reported by the author(s).
Additional information
Notes on contributors

Haavard Haaskjold
Haavard Haaskjold has a PhD degree within project management from the Norwegian University of Science and Technology (NTNU). The research topic for his thesis is optimisation of project transaction costs through improved collaboration. He is also a reviewer for several international journals. Haaskjold currently works as project manager within the Norwegian construction industry and is a certified Project Management Professional (PMP) from the Project Management Institute. He has 15 years of experience as a practitioner of project management.

Bjørn Andersen
Bjørn Andersen is a professor of project management at NTNU. He has authored/co-authored around 25 books and numerous papers for international journals and conferences, in total more than 300 publications. Professor Andersen serves as Director of Project Norway and has since its inception been a member of the steering group of the Concept research program. He has managed and been involved in several national and international research and implementation projects. Andersen is an Academic in the International Academy of Quality, is co-editor of the journal Production Planning & Control and reviewer for several other journals and conferences.

Jan Alexander Langlo
Jan Alexander Langlo, PhD, holds a position as Associate Professor in project management at NTNU. He manages NTNU Continued Education Programme in Project Management at NTNU, and is the daily manager of Nordic 10-10, an association for performance improvement in the Norwegian Construction industry. He is involved in the research programmes Project Norway and Concept. Langlo has also worked as a senior research scientist and as a research manager at SINTEF for 20 years. He has published books and a number of journal papers on project management.
References
- Aarseth, W. 2014. Project Management – A New Mindset for Success: Collaborative Business and Global Mindset. Bergen, Norway: Fagbokforlaget.
- Abou-Ibrahim, H., F. Hamzeh, E. Zankoul, S. Munch Lindhard, and L. Rizk. 2019. “Understanding the Planner’s Role in Lookahead Construction Planning.” Production Planning & Control 30 (4): 271–284. doi:10.1080/09537287.2018.1524163.
- Andersen, B., and J. Langlo. “Productivity and Performance Measurement in the Construction Sector.” Proceedings of the CIB World Building Congress, 2016.
- Andersen, E. S. 2016. “Do Project Managers Have Different Perspectives on Project Management?” International Journal of Project Management 34 (1): 58–65. doi:10.1016/j.ijproman.2015.09.007.
- Arditi, D., and R. Chotibhongs. 2009. “Detection and Prevention of Unbalanced Bids.” Construction Management and Economics 27 (8): 721–732. doi:10.1080/01446190903117785.
- Arrow, K. J. 1969. “The Organization of Economic Activity: Issues Pertinent to the Choice of Market Versus Nonmarket Allocation.” The Analysis and Evaluation of Public Expenditures: The PPB System. Joint Economic Committee, 91st Congress, 1st Session. Washington, DC: Government Printing Office.
- Ballard, G., and G. Howell. 2003. “Lean Project Management.” Building Research & Information 31 (2): 119–133. doi:10.1080/09613210301997.
- Ballard, H. G. 2000. “The Last Planner System of Production Control.” Doctoral PhD thesis, University of Birmingham.
- Biong, H., E. B. Nes, and J. B. Sande. 2016. Markedsføring på Bedriftsmarkedet. Oslo, Norway: Universitetsforlaget.
- Bititci, U., T. Turner, D. Mackay, D. Kearney, J. Parung, and D. Walters. 2007. “Managing Synergy in Collaborative Enterprises.” Production Planning & Control 18 (6): 454–465. doi:10.1080/09537280701494990.
- Bond-Barnard, T. J., L. Fletcher, and H. Steyn. 2018. “Linking Trust and Collaboration in Project Teams to Project Management Success.” International Journal of Managing Projects in Business 11 (2): 432–457. doi:10.1108/IJMPB-06-2017-0068.
- Bryde, D. J., C. Unterhitzenberger, and R. Joby. 2019. “Resolving Agency Issues in Client–Contractor Relationships to Deliver Project Success.” Production Planning & Control 30 (13): 1049–1063. doi:10.1080/09537287.2018.1557757.
- Bryman, A. 2016. Social Research Methods. Oxford: Oxford University Press.
- Bygballe, L. E., M. Jahre, and A. Swärd. 2010. “Partnering Relationships in Construction: A Literature Review.” Journal of Purchasing and Supply Management 16 (4): 239–253. doi:10.1016/j.pursup.2010.08.002.
- Bygballe, L. E., and A. Swärd. 2019. “Collaborative Project Delivery Models and the Role of Routines in Institutionalizing Partnering.” Project Management Journal 50 (2): 161–176. doi:10.1177/8756972818820213.
- Børve, S. 2019. Project Partnering Defined and Implications Thereof. Trondheim: Norwegian University of Science and Technology, Faculty of Engineering, Department of Mechanical and Industrial Engineering.
- Chen, Q., Z. Jin, B. Xia, P. Wu, and M. Skitmore. 2016. “Time and Cost Performance of DesignBuild Projects.” Journal of Construction Engineering and Management 142 (2): 04015074. doi:10.1061/(ASCE)CO.1943-7862.0001056.
- Cheng, Y., R. Matthiesen, S. Farooq, J. Johansen, H. Hu, and L. Ma. 2018. “The Evolution of Investment Patterns on Advanced Manufacturing Technology (AMT) in Manufacturing Operations: A Longitudinal Analysis.” International Journal of Production Economics 203:239–253. doi:10.1016/j.ijpe.2018.06.019.
- Coase, R. H. 1937. “The Nature of the Firm.” Economica 4 (16): 386–405. doi:10.1111/j.1468-0335.1937.tb00002.x.
- Da Fonseca, F. B., R. M. Vanalle, and J. A. Camarotto. 2018. “Identification of Ex-Ante and Ex-Post Transaction Costs in Industrial Construction Engineering Projects.” Journal of Civil Engineering and Management 24 (5): 424–436. doi:10.3846/jcem.2018.5199.
- De Schepper, S., E. Haezendonck, and M. Dooms. 2015. “Transaction Cost Analysis of Public Infrastructure Delivery.” International Journal of Managing Projects in Business 8 (3): 441–456. doi:10.1108/IJMPB-10-2014-0075.
- Dudkin, G., and T. Välilä. 2006. “Transaction Costs in Public-Private Partnerships: A First Look at the Evidence.” Competition and Regulation in Network Industries 1 (2): 307–330. doi:10.1177/178359170600100209.
- Eisenhardt, K. M. 1985. “Control: Organizational and Economic Approaches.” Management Science 31 (2): 134–149. doi:10.1287/mnsc.31.2.134.
- Engebø, A., O. J. Klakegg, J. Lohne, and O. Laedre. 2020. “A Collaborative Project Delivery Method for Design of a High-Performance Building.” International Journal of Managing Projects in Business 13 (6): 1141–1165. doi:10.1108/IJMPB-01-2020-0014.
- Engebø, A., O. Laedre, B. Young, P. F. Larssen, J. Lohne, and O. J. Klakegg. 2020. “Collaborative Project Delivery Methods: A Scoping Review.” Journal of Civil Engineering and Management 26 (3): 278–303. doi:10.3846/jcem.2020.12186.
- Farajian, M. 2010. “Transaction Cost Estimation Model for US Infrastructure Public Private Partnerships.” MSc thesis, University of Maryland.
- Fiedler, J., and A. Wendler. 2016. Berlin Brandenburg Airport. Large Infrastructure Projects in Germany. Cham: Springer.
- Flyvbjerg, B., and A. Stewart. 2012. Olympic Proportions: Cost and Cost Overrun at the Olympics 1960-2012. Saïd Business School Working Papers. Oxford: University of Oxford.
- Ghaffar, S. H., J. Corker, and M. Fan. 2018. “Additive Manufacturing Technology and Its Implementation in Construction as an Eco-Innovative Solution.” Automation in Construction 93:1–11. doi:10.1016/j.autcon.2018.05.005.
- Goldberg, V. P. 1976. “Regulation and Administered Contracts.” The Bell Journal of Economics 7 (2): 426–448. doi:10.2307/3003265.
- Goulding, J. S., F. P. Rahimian, and X. Wang. 2014. “Virtual Reality-Based Cloud BIM Platform for Integrated AEC Projects.” Journal of Information Technology in Construction 19:308–325.
- Guo, L., H. Li, P. Li, and C. Zhang. 2016. “Transaction Costs in Construction Projects under Uncertainty.” Kybernetes 45 (6): 866–883. doi:10.1108/K-10-2014-0206.
- Haaskjold, H., B. Andersen, J. Langlo, and W. Aarseth. 2020. “Follow the Collaboration Compass.” International Journal of Project Organisation and Management. [in press].
- Haaskjold, H., B. Andersen, and J. A. Langlo. 2020. “In Search of Empirical Evidence for the Relationship between Collaboration and Project Performance.” The Journal of Modern Project Management 7 (4): 120–152.
- Haaskjold, H., B. Andersen, O. Laedre, and W. Aarseth. 2019. “Factors Affecting Transaction Costs and Collaboration in Projects.” International Journal of Managing Projects in Business 13 (1): 197–230. doi:10.1108/IJMPB-09-2018-0197.
- Haq, S. U., C. Liang, D. Gu, J. T. Du, and S. Zhao. 2018. “Project Governance, Project Performance, and the Mediating Role of Project Quality and Project Management Risk: An Agency Theory Perspective.” Engineering Management Journal 30 (4): 274–292. doi:10.1080/10429247.2018.1503038.
- Ho, S. P., R. Levitt, C.-W. Tsui, and Y. Hsu. 2015. “Opportunism-Focused Transaction Cost Analysis of Public-Private Partnerships.” Journal of Management in Engineering 31 (6): 04015007. doi:10.1061/(ASCE)ME.1943-5479.0000361.
- Invernizzi, D. C., G. Locatelli, and N. J. Brookes. 2018. “The Need to Improve Communication about Scope Changes: Frustration as an Indicator of Operational Inefficiencies.” Production Planning & Control 29 (9): 729–742. doi:10.1080/09537287.2018.1461949.
- Jackson, J. 2008. Approved Judgement – Multiplex vs Cleveland Bridge. London: Royal Court of Justice.
- Kadefors, A. 2004. “Trust in Project Relationships-Inside the Black Box.” International Journal of Project Management 22 (3): 175–182. doi:10.1016/S0263-7863(03)00031-0.
- Kadefors, A., E. Björlingson, and A. Karlsson. 2007. “Procuring Service Innovations: Contractor Selection for Partnering Projects.” International Journal of Project Management 25 (4): 375–385. doi:10.1016/j.ijproman.2007.01.003.
- Kang, H. S., J. Y. Lee, S. Choi, H. Kim, J. H. Park, J. Y. Son, B. H. Kim, and S. Do Noh. 2016. “Smart Manufacturing: Past Research, Present Findings, and Future Directions.” International Journal of Precision Engineering and Manufacturing-Green Technology 3 (1): 111–128. doi:10.1007/s40684-016-0015-5.
- Kim, B.-C., and Y. H. Kwak. 2018. “Improving the Accuracy and Operational Predictability of Project Cost Forecasts: An Adaptive Combination Approach.” Production Planning & Control 29 (9): 743–760. doi:10.1080/09537287.2018.1467511.
- Klein, B., R. G. Crawford, and A. A. Alchian. 1978. “Vertical Integration, Appropriable Rents, and the Competitive Contracting Process.” The Journal of Law and Economics 21 (2): 297–326. doi:10.1086/466922.
- Kunz, J., and M. Fischer. 2012. Virtual Design and Construction: Themes, Case Studies and Implementation Suggestions. Stanford, CA: Center for Integrated Facility Engineering, Stanford University.
- Lahdenperä, P. 2012. “Making Sense of the Multi-Party Contractual Arrangements of Project Partnering, Project Alliancing and Integrated Project Delivery.” Construction Management and Economics 30 (1): 57–79. doi:10.1080/01446193.2011.648947.
- Le, P. L., W. Elmughrabi, T.-M. Dao, and A. Chaabane. 2020. “Present Focuses and Future Directions of Decision-Making in Construction Supply Chain Management: A Systematic Review.” International Journal of Construction Management 20 (5): 490–509. doi:10.1080/15623599.2018.1488089.
- Lee, H.-S., J.-O. Seo, M. Park, H.-G. Ryu, and S.-S. Kwon. 2009. “Transaction-Cost-Based Selection of Appropriate General Contractor-Subcontractor Relationship Type.” Journal of Construction Engineering and Management 135 (11): 1232–1240. doi:10.1061/(ASCE)CO.1943-7862.0000086.
- Leviäkangas, P., S. Mok Paik, and S. Moon. 2017. “Keeping up with the Pace of Digitization: The Case of the Australian Construction Industry.” Technology in Society 50:33–43. doi:10.1016/j.techsoc.2017.04.003.
- Li, H., D. Arditi, and Z. Wang. 2013. “Factors That Affect Transaction Costs in Construction Projects.” Journal of Construction Engineering and Management 139 (1): 60–68. doi:10.1061/(ASCE)CO.1943-7862.0000573.
- Li, H., D. Arditi, and Z. Wang. 2014. “Transaction Costs Incurred by Construction Owners.” Engineering, Construction and Architectural Management 21 (4): 444–458. doi:10.1108/ECAM-07-2013-0064.
- Li, H., D. Arditi, and Z. Wang. 2015. “Determinants of Transaction Costs in Construction Projects.” Journal of Civil Engineering and Management 21 (5): 548–558. doi:10.3846/13923730.2014.897973.
- Love, P. E. D., L. A. Ika, D. D. Ahiaga-Dagbui, G. Locatelli, and M. C. P. Sing. 2019. “Make-or-Break during Production: shedding Light on Change-Orders, Rework and Contractors Margin in Construction.” Production Planning & Control 30 (4): 285–298. doi:10.1080/09537287.2018.1535675.
- Love, P. E. D., M. C. P. Sing, L. A. Ika, and S. Newton. 2019. “The Cost Performance of Transportation Projects: The Fallacy of the Planning Fallacy account.” Transportation Research Part A: Policy and Practice 122:1–20. doi:10.1016/j.tra.2019.02.004.
- Love, P. E. D., J. Smith, F. Ackermann, Z. Irani, and P. Teo. 2018. “The Costs of Rework: insights from Construction and Opportunities for Learning.” Production Planning & Control 29 (13): 1082–1095. doi:10.1080/09537287.2018.1513177.
- Lu, W., L. Zhang, and J. Pan. 2015. “Identification and Analyses of Hidden Transaction Costs in Project Dispute Resolutions.” International Journal of Project Management 33 (3): 711–718. doi:10.1016/j.ijproman.2014.08.009.
- Meng, X. 2020. “Proactive Management in the Context of Construction Supply Chains.” Production Planning & Control 31 (7): 527–539. doi:10.1080/09537287.2019.1657977.
- Mukaka, M. M. 2012. “A Guide to Appropriate Use of Correlation Coefficient in Medical Research.” Malawi Medical Journal 24 (3): 69–71.
- Müller, R., and J. R. Turner. 2005. “The Impact of Principal–Agent Relationship and Contract Type on Communication between Project Owner and Manager.” International Journal of Project Management 23 (5): 398–403. doi:10.1016/j.ijproman.2005.03.001.
- Nyström, J. 2015. “The Balance of Unbalanced Bidding.” Procedia Economics and Finance 21:97–103. doi:10.1016/S2212-5671(15)00155-0.
- Petersen, O. H., J. R. Hansen, A. R. Villadsen, and K. Houlberg. “Private Transaction Costs in Public Sector Contracting.” XXII Annual IRSPM Conference, 2018.
- Pinto, J. K., D. P. Slevin, and B. English. 2009. “Trust in Projects: An Empirical Assessment of Owner/Contractor Relationships.” International Journal of Project Management 27 (6): 638–648. doi:10.1016/j.ijproman.2008.09.010.
- PMI. 2017. A Guide to the Project Management Body of Knowledge (PMBOK® Guide). Newtown Square, PA: Project Management Institute.
- Rajeh, M., J. Tookey, and J. Rotimi. “Determining the Magnitude of Transaction Costs in Construction Procurement Systems: An Exploratory Study.” World Building Congress, 2013.
- Rajeh, M., J. E. Tookey, J. Olabode, and B. Rotimi. 2015. “Estimating Transaction Costs in the New Zealand Construction Procurement a Structural Equation Modelling Methodology.” Engineering, Construction and Architectural Management 22 (2): 242–267. doi:10.1108/ECAM-10-2014-0130.
- Rindfleisch, A., and J. B. Heide. 1997. “Transaction Cost Analysis: Past, Present, and Future Applications.” Journal of Marketing 61 (4): 30–54. doi:10.2307/1252085.
- Rooke, J., D. Seymour, and R. Fellows. 2004. “Planning for Claims: An Ethnography of Industry Culture.” Construction Management and Economics 22 (6): 655–662. doi:10.1080/014461904200026324.
- Samset, K. 2014. Projsekt i Tidligfasen. Bergen: Fagbokforlaget.
- Simon, H. A. 1957. Administrative Behavior. New York: The Macmillian Company.
- Simon, H. A. 1991. “Organizations and Markets.” Journal of Economic Perspectives 5 (2): 25–44. doi:10.1257/jep.5.2.25.
- Soliño, A. S., and P. Gago De Santos. 2010. “Transaction Costs in Transport Public–Private Partnerships: Comparing Procurement Procedures.” Transport Reviews 30 (3): 389–406. doi:10.1080/01441640903037941.
- Song, H., F. Zhu, O. J. Klakegg, and P. Wang. 2018. “Relationship between Contractual Flexibility and Contractor’s Cooperative Behavior: The Mediating Effect of Justice Perception.” International Journal of Managing Projects in Business 11 (2): 382–405. doi:10.1108/IJMPB-07-2017-0088.
- Spitzer, D. R. 2007. Transforming Performance Measurement. New York: AMACOM Books.
- Strand, R., and R. E. Freeman. 2015. “Scandinavian Cooperative Advantage: The Theory and Practice of Stakeholder Engagement in Scandinavia.” Journal of Business Ethics 127 (1): 65–85. doi:10.1007/s10551-013-1792-1.
- Taylor, R. 1990. “Interpretation of the Correlation Coefficient: A Basic Review.” Journal of Diagnostic Medical Sonography 6 (1): 35–39. doi:10.1177/875647939000600106.
- Von Danwitz, S. 2018. “Managing Inter-Firm Projects: A Systematic Review and Directions for Future Research.” International Journal of Project Management 36 (3): 525–541. doi:10.1016/j.ijproman.2017.11.004.
- Walker, A., and C. Kwong Wing. 1999. “The Relationship between Construction Project Management Theory and Transaction Cost Economics.” Engineering, Construction and Architectural Management 6 (2): 166–176. doi:10.1108/eb021109.
- Walker, D., and B. Lloyd-Walker. 2016. “Rethinking Project Management: Its Influence on Papers Published in the International Journal of Managing Projects in Business.” International Journal of Managing Projects in Business 9 (4): 716–743. doi:10.1108/IJMPB-12-2015-0121.
- Walker, D., and B. M. Lloyd-Walker. 2015. Collaborative Project Procurement Arrangements. Newton Square, PA: Project Management Institute.
- Wang, C., J. B. H. Yap, L. C. Wood, and H. Abdul-Rahman. 2019. “Knowledge Modelling for Contract Disputes and Change Control.” Production Planning & Control 30 (8): 650–664. doi:10.1080/09537287.2019.1572247.
- Wang, D., S. Fang, and H. Fu. 2019. “The Effectiveness of Evolutionary Governance in Mega Construction Projects: A Moderated Mediation Model of Relational Contract and Transaction Cost.” Journal of Civil Engineering and MANAGEMENT 25 (4): 340–352. doi:10.3846/jcem.2019.9621.
- Whittington, J. M. 2008. The Transaction Cost Economics of Highway Project Delivery: Design-Build Contracting in Three States. Berkeley: University of California.
- Williamson, O. E. 1971. “The Vertical Integration of Production: Market Failure Considerations.” The American Economic Review 61 (2): 112–123.
- Williamson, O. E. 1975. Markets and Hierarchies: Analysis and Antitrust Implications: A Study in the Economics of Internal Organization. New York: Free Press.
- Williamson, O. E. 1979. “Transaction-Cost Economics: The Governance of Contractual Relations.” The Journal of Law and Economics 22 (2): 233–261. doi:10.1086/466942.
- Williamson, O. E. 1981. “The Economics of Organization: The Transaction Cost Approach.” American Journal of Sociology 87 (3): 548–577. doi:10.1086/227496.
- Williamson, O. E. 1996. The Mechanisms of Governance. New York: Oxford University Press.
- Wondimu, P. A., A. Hosseini, J. Lohne, E. Hailemichael, and O. Laedre. “Early Contractor Involvement in Public Infrastructure Projects.” Proc. 24th Ann. Conf. of the Int’l. Group for Lean Construction, 2016, Boston, MA, USA, 13–22.
- Yang, Y., M. Pan, and W. Pan. 2019. “Co-Evolution through Interaction’ of Innovative Building Technologies: The Case of Modular Integrated Construction and Robotics.” Automation in Construction 107:102932. doi:10.1016/j.autcon.2019.102932.
- Yarahmadi, R., F. Shakouhi, F. Taheri, and P. Moridi. 2016. “Prioritizing Occupational Safety and Health Indexes Based on the Multi Criteria Decision Making in Construction Industries.” Iran Occupational Health 12 (6): 39–47.
- Yeung, J. F. Y., A. P. C. Chan, and D. W. M. Chan. 2007. “The Definition of Alliancing in Construction as a Wittgenstein Family-Resemblance Concept.” International Journal of Project Management 25 (3): 219–231. doi:10.1016/j.ijproman.2006.10.003.
- Yeung, J. F. Y., A. P. C. Chan, D. W. M. Chan, Y. H. Chiang, and H. Yang. 2013. “Developing a Benchmarking Model for Construction Projects in Hong Kong.” Journal of Construction Engineering and Management 139 (6): 705–716. doi:10.1061/(ASCE)CO.1943-7862.0000622.
- Yin, X., H. Liu, Y. Chen, and M. Al-Hussein. 2019. “Building Information Modelling for Off-Site Construction: Review and Future Directions.” Automation in Construction 101:72–91. doi:10.1016/j.autcon.2019.01.010.
- You, J., Y. Chen, W. Wang, and C. Shi. 2018. “Uncertainty, Opportunistic Behavior, and Governance in Construction Projects: The Efficacy of Contracts.” International Journal of Project Management 36 (5): 795–807. doi:10.1016/j.ijproman.2018.03.002.
- Yun, S., J. Choi, D. P. De Oliveira, and S. P. Mulva. 2016. “Development of Performance Metrics for Phase-Based Capital Project Benchmarking.” International Journal of Project Management 34 (3): 389–402. doi:10.1016/j.ijproman.2015.12.004.
- Zarei, B., H. Sharifi, and Y. Chaghouee. 2018. “Delay Causes Analysis in Complex Construction Projects: A Semantic Network Analysis Approach.” Production Planning & Control 29 (1): 29–40. doi:10.1080/09537287.2017.1376257.