
Abstract
Short-term and stochastic variations can create negative effects on the delivery capability, and companies often adopt their processes accordingly. What is then ignored is the fact that causes for variations are often self-induced and, therefore, possible to affect. Proposed actions in current literature focus mainly on continuous improvement without explicitly emphasizing that certain behaviours, rules and routines have a direct impact on variations affecting the company. In this study, a framework of causes for self-induced variations is established with proposed actions for each cause to reduce the variations. The framework is situated relative to practice for the actions applied at six manufacturing companies. This study sought to increase the understanding of self-induced variations and where companies can apply the proposed framework for an overview of 22 causes and 60 appropriate actions to support the systematic reduction of self-induced variations that can be internally or externally generated.
1. Introduction
Being competitive is increasingly challenging due to increased requirements and pressure on manufacturing companies in the global market exerted by continually changing conditions (Samson and Gloet Citation2018). Competition becomes even more challenging as variations create imbalances (Hopp and Spearman Citation2021). Only short-term and stochastic variations are considered in this study, henceforth referred to as variations. The variations concerned are the external variations in customer demand and deliveries from suppliers (Ben-Ammar, Bettayeb, and Dolgui Citation2020), but also internal variations in value-adding processes (Hopp and Spearman Citation2021). Unless these variations are managed, the delivery capability may be compromised (Slack and Lewis Citation2001), ultimately with severe consequences for the company (Bourne and Mura Citation2018). Managing variations is, therefore, of utmost importance (Hayes and Wheelwright Citation1984). One approach is to absorb variations by establishing buffers (Shoaib-ul-Hasan et al. Citation2018), i.e. having additional resources in the form of materials, capacity and/or lead time (Hedvall Citation2018; Hopp and Spearman Citation2004), with the assumption that the existence of variations is accepted and that buffers are needed as a hedge to manage them (Buzacott and Shanthikumar Citation1994). For the buffers to be valuable, their protection of the delivery capability needs to exceed the induced costs (Hedvall, Wikner, and Hilletofth Citation2017). The approach can be regarded as a form of symptomatic treatment, meaning that problems with variations become easier to live with instead of reducing them (Mattsson Citation2006). Hopp and Spearman (Citation2021) even argue that the only way to reduce the total amount of buffers is to reduce the total amount of variations. Some buffers will always be needed when there are random causes for the variations, but assignable causes for variations that are not strategically connected to the business should be investigated to reduce the variations (Hopp and Spearman Citation2004; Lei and MacKenzie Citation2020). This leads to a second and alternative approach, which is the focus of this study, to identify causes and find appropriate actions to reduce variations and then utilize less buffers for remaining variations (Hopp and Spearman Citation2004).
For internal variations, such as variations in value-adding processes, several methods and techniques have been proposed by previous literature. Lean and six sigma include several techniques that focus on reducing variations and creating predictable manufacturing systems (Raval, Kant, and Shankar Citation2018). The techniques are most sharply focussed on a company’s own value-adding processes, leaving the system exposed to external variations. Some literature focusses on variations in terms of reliability risks and impact on operational performance. These studies, focussing mainly on a general methodology for identifying failure mode, rank with critical analysis, root cause analysis and effective solutions without specifying common causes for variations; see e.g. Viveros et al. (Citation2018) and Gupta et al. (Citation2022).
Variations in available capacity are mainly self-induced and internally generated and, thereby, also possible to affect internally. This possibility to affect the variations also applies to internally generated capacity requirements. Although variations in demand and delivery lead-time are, to a great extent, externally generated by customers and suppliers, they are not unavoidable (Mattsson Citation2007b). Rather, many variations that affect a company are self-induced and, thus, also possible to affect by applied offerings, rules, routines and behaviours internally and in association with other actors in the supply chains of which the company is a part (Hopp and Spearman Citation2004; Gupta et al. Citation2022). Hence, it is important to become aware of how internal mechanisms contribute not only to internal but also external variations, which companies might not always be aware of when experiencing variations.
Previous research has, in general, focussed on either causes for variations or actions to reduce them, rather than on specific self-induced and internal causes and corresponding actions for each identified cause. For each variation to consider, the practical feasibility and mathematical or computational complexity increases (Luz et al. Citation2022), resulting in that most research has focussed on how to manage one or a few specific variations instead of all the variations affecting a company that are possible to affect as a cohesive whole (Koh, Saad, and Jones Citation2002). Begen, Pun, and Yan (Citation2016) reported that research considering both supply and demand variations simultaneously do not consider efforts to reduce the variations, and the research is most often based on modelling and simulation methods to investigate this area of research, rather than qualitative insights based on empirical data. This creates opportunities to narrow the gap in the current understanding of variation-reducing actions, especially for the perspective of identifying internal causes that contribute to generating both internal and external variations, referred to as self-induced variations. The purpose of this study is to develop better understanding of self-induced variations in manufacturing companies and how they can be reduced. A framework of internal causes and potential actions is developed that, from a managerial perspective, can be used in a systematic way to enhance variation-reducing actions in manufacturing companies. The study comprises two parts, the development of the framework and its use for investigating the extent to which the proposed actions are utilized in six manufacturing companies. Only self-induced and internal causes that concern companies and are possible to affect are included in the study.
The continuation of this paper is structured as follows. First, internal causes and actions for self-induced variations are presented to provide an overview of identified causes and actions in the current body of knowledge. Then the methodology applied in this study is presented, including a description of case company selection. This is followed by the results section, where the framework and main findings of the case study are discussed. Finally, practical implications and theoretical contributions are discussed, followed by outlining some conclusions.
2. Causes and actions to reduce self-induced variations
This study investigates four different types of variations affecting a company. They are illustrated in with their positions in a material flow.
Figure 1. Variations that affect a manufacturing company.
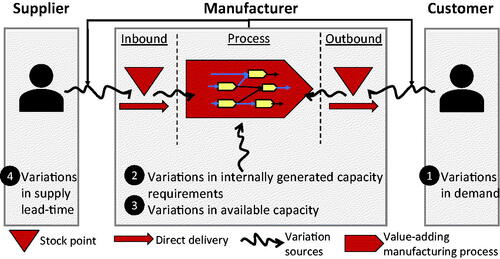
On a company’s outbound side, variations in customer demand can emerge (1). These create variations in capacity requirements to perform value-adding manufacturing processes. However, variations in capacity requirements can also be internally generated, due, for example, to rework (2). In addition, variations in value-adding processes can emerge as a result of variations in available capacity (3). Finally, variations in delivery lead-time of input materials are included (4). The variations on the inbound side are here limited to variations in delivery lead-time from suppliers.
Causes for variations that are possible to affect internally and actions to reduce them are, to a certain extent, explained in the extant body of knowledge. The continuation of this section builds on this literature; however, the literature found does not fully cover the area of interest. Causes and actions are, therefore, also identified through conceptual logical reasoning and experiences from the manufacturing industry to capture a more-comprehensive picture. In this study, causes refer to underlying reasons for the presence of variations and are further used to describe routines and behaviours within companies and in their relations with other entities that drive variations. Actions refer to activities and changes and are further used to describe how manufacturing companies work to reduce variations.
2.1. Causes and actions related to variations in demand
Variations in demand emerge from natural causes as a company’s customers experience demand variations themselves, resulting in their irregular consumption of goods and services. The size of existing variations is affected by different behaviours and routines internally in a company and in its relations with customers. The causes for such variations in demand and actions to reduce them are discussed in this section with an overview provided in section 4.
2.1.1. Large customer orders
Large order quantities, e.g. characterized by means of the relationship between order quantity and annual demand, constitute one of the most-decisive factors of unmanageable situations with variations in demand. They influence how irregular the demand becomes (Williams Citation1991), where the larger the quantities, the greater the variations tend to be (Lee, Padmanabhan, and Whang Citation1997). What is considered a large order quantity is relative to the type of company, product and market, where annual demand might concern single pieces or dozens for complex engineer-to-order (ETO) or make-to-order (MTO) products while it is a matter of thousands for less complex MTO, assembly-to-order (ATO) or make-to-stock (MTS) products. Methods frequently used to determine optimal order quantities are most likely a contributing factor to large order quantities, especially as a consequence of the cost of variability in capacity requirements not usually being considered in the calculations (Mattsson Citation2007b). To avoid order quantities becoming too large, it is recommended that companies refrain from charging set-up overheads (Mattsson Citation2017b), facilitating ordering (Mattsson Citation1995) and rationalizing order administration (Lee, Padmanabhan, and Whang Citation1997; Cachon and Fisher Citation2000) since these all contribute to the costs of ordering and, therefore, increase the economic order quantities.
2.1.2. Few exceptionally large customer orders
Exceptionally large customer orders, so-called outliers, can create substantial problems (Mattsson Citation2007a), and their occurrence should be minimized through dialogue with customers to sort out if the entire order is really needed at the same time, to propose partial deliveries (Sandvig and Allaire Citation1998) or a delivery lead-time based on customer-order agreement, even if the product is normally delivered directly from stock (Mattsson Citation2017b). Promotions and quantity discounts reinforce variations in demand as customers are induced to order larger quantities than they need at the moment (Mather Citation1996). The purpose of campaigns is often to temporarily increase sales, i.e. a conscious choice to amplify variations in demand. The consequence is that demand becomes irregular, resulting in challenges maintaining low inventory levels and an even-capacity utilisation (Croson and Donohue Citation2009).
2.1.3. Changed delivery lead-time to customer
Changing delivery lead-times to customers can amplify variations in demand, due mainly to customer behaviours that often follow from the changes. Temporary increases in demand or problems with capacity availability (e.g. in the event of a machine breakdown) are examples of situations where companies may need to temporarily extend their delivery lead-times to their customers. The customers may then perceive the changes as upcoming delivery problems, which can, in turn, lead to their attempts to secure their own deliveries by ordering larger quantities than their actual requirements and/or in advance of their usual ordering schedule (Christopher and Lee Citation2004). Inadequate communication with customers about the reasons for changed delivery lead-times contributes to such behaviour (Mattsson Citation2007b), and the repercussions can be substantial. Severe consequences may follow in the absence of information if the company perceives the customer behaviour to be a permanent increase in demand and invests in capacity in order to meet an increase that does not correspond to an actual increased demand by end consumers (Mattsson Citation1995).
Disney and Towill (Citation2002) emphasized the importance of being restrictive with parameter updates in order to avoid amplifying variations in demand. Mattsson (Citation2017b) proposed reducing the effects through dialogue with customers, reducing the element of automatic re-calculations of order points and the like, and examining possibilities of temporarily reduced order quantities or partial deliveries. Dialogue with customers here refers to all types of issues communicated between supplier and customer during the order-to-delivery process, with intent to reduce the variations resulting from temporarily extended delivery lead-times.
2.1.4. Periodizing effect – the hockey stick effect
Periodic behaviour arises due to the use of key performance indicators such as periodic sales targets and manufacturing targets (Mattsson Citation2007b; Mather Citation1996) that may result in significant variations in demand during a planning period (Mattsson Citation2017b). Sales targets can encourage a salesperson to make an extra effort at the end of a planning period to reach the established goals. This, in turn, can lead to sales difficulties at the beginning of the next period if the prospect stock has been depleted in the attempts to achieve the sales targets in the previous period (Mattsson Citation2007b). The result is a vicious circle of periodic variations in deliveries and, thereby, variations in capacity requirements. This type of variation is often called the hockey stick effect or end-of-the-month syndrome (Olson Citation1998). In fact, it is the systems and routines for budgeting, monitoring and income statements that create these behaviours, resulting in amplified variations in demand (Laseter Citation1998). Even though companies might be aware of their periodic behaviour it is not presumable that they are fully aware of the consequences for variations based on this behaviour (Singer, Donoso, and Konstantinidis Citation2009).
Laseter (Citation1998) claim that up to 20% of the variations in demand are caused by periodic behaviours that generally have little to do with actual demand variations from customers. Singh and Challa (Citation2016) developed a forecasting methodology to reduce the bullwhip effect in multilevel supply chains, which to a certain extent can reduce the impact of periodic behaviours but the causes behind them remain. Consequently, the variations can be reduced by changing routines and the way obtained measures are evaluated to avoid inducing this behaviour. That performance indicators affect human behaviour is nothing new or surprising, but it is important to be aware of considering how they can contribute to sub-optimizations and variations (Koufteros, Verghese, and Lucianetti Citation2014; Bititci et al. Citation2012). To find an appropriate set of performance indicators is therefore an important issue (Leachman, Pegels, and Kyoon Shin Citation2005; Koufteros, Verghese, and Lucianetti Citation2014).
2.1.5. Periodizing effect – the reverse hockey stick effect
Inappropriate invoicing routines can contribute to postponing and periodizing ordering (Mattsson Citation2017b; Mather Citation1996). Periodic invoicing and payment terms with free delivery month tend to induce customers to wait to order until the beginning of a new month to obtain an interest-free credit corresponding to one invoicing period (Mattsson Citation2007b). Applied value added tax (VAT) reporting routines can increase demand variations of a similar type if deliveries are adjusted to when VAT reporting takes place. If delivery is postponed by a couple of days, one month’s credit on the VAT amount can be achieved. Sandvig and Allaire (Citation1998) argued that variations in demand can be reduced to a large extent by using appropriate policies and procedures for the way in which companies work.
2.1.6. Inventory build-ups at customers for delivery from stock, MTS
Increased stock at customers may arise as a result of large order quantities ordered in advance by customers preparing for campaigns as a result of changed trust in the company’s delivery capability or due to a temporary decline in the customers’ own demand. Such inventories can be regarded as negative demand as the additional inventories infer a reduced need to place orders in the near future. The increased demand variations, which such inventory build-ups can lead to, can be avoided through more-efficient information exchange regarding current stock balances for delivery from stock, especially for large customers. The company can then also take the customer’s current inventory, i.e. the so-called echelon inventory, into account in the inventory-control system and consider temporarily decreased demand (Mattsson Citation2017b). Another way to address this cause for variations in demand is to offer supplier-managed inventories, or vendor-managed inventories, as this implies that the company itself has full access to information about customers’ inventory levels and can act according to actual rather than perceived requirements (Fox Citation1996).
2.1.7. Inventory build-ups at customers for manufacturing to order, MTO
Variations in demand due to inventory build-ups at customers for manufacturing to order have the same causes as delivery from stock. However, to reduce this type of self-induced variation, it is rather a matter of efficient information exchange regarding future needs through frequent contact with large and important customers instead of vendor-managed inventory (VMI) and current inventory levels.
2.1.8. The customer’s planning system
Applied procedures for order placement can increase variations if optimisation methods are used to calculate economic order quantities and new calculations are performed when demand changes. If the square root formula is used in a customer’s planning system for calculating order quantities, it can lead to amplifications in the variations before the inventory levels correspond to the new levels of demand. Mattsson (Citation2007b) found that a 20% increase in demand implies about a 10% increase in the order quantity when the square root formula is used to calculate order quantities. Consequently, this leads to a total increase of about 30% before the system has stabilized. Corresponding amplifications in demand variations occur when calculating and updating safety stocks due to changes in demand. In other words, variations in demand can be caused by automatic and frequently performed parameter updating in the planning system. The problems can be remedied by using calculation models with less-dynamic effects or by being cautious when updating parameters to ensure that large changes in order quantities and safety stocks do not get full impact. Material planning systems, such as material requirements planning (MRP), have a tendency to generate demand variations due to overcompensation for small demand changes, referred to as system nervousness (van Donselaar and Gubbels Citation2002). To avoid this, companies can induce customers to refrain from using existing dynamic calculation models and to use dampening functions like demand time fences and firm planned orders available in most MRP systems (Vollmann et al. Citation2005).
2.1.9. Returns from customers
Quality issues in delivered products may create variations in demand by increased returns and, ultimately, reduced market shares. Up to 43% of the value of all returns from customers are due to defective products (Sibanda and Ramanathan Citation2019). To avoid this, quality improvement work in manufacturing processes is of fundamental importance (O’Neill, Sohal, and Teng Citation2016). Recent technological developments with predictive maintenance and machine criticality assessment represents examples of important improvement work connected to quality issues and resource availability (Cardoso and Ferreira Citation2020; Traini, Bruno, and Lombardi Citation2021; Gopalakrishnan, Subramaniyan, and Skoogh Citation2022).
2.2. Causes and actions related to variations in internally generated capacity requirements
Variations in demand from customers generally constitute the main variation in capacity requirements. However, there are also several other phenomena within companies that contribute to increasing these variations. In this section, causes and actions for such indirect variations in capacity requirements are presented and described. A summary of the identified causes and proposed actions is provided in section 4.
2.2.1. Rework
Quality problems, scrap, or employees taking shortcuts in attempts to meet deadlines can lead to a need for rework (Love et al. Citation2018). As rework requires extra capacity, it contributes to increasing existing variations in capacity requirements. If quality problems remain undiscovered and delivery to customers takes place, the result can be trust issues on the part of customers. Returns may also require capacity for making adjustments to returned goods or total rework from scratch. The need for rework can also arise due to unclear specifications and inadequate communication with customers, leading to uncertainties about what the customer really wanted to be manufactured and delivered. Such elements of rework lead to increased costs and inefficient material flows (Angulo, Nachtmann, and Waller Citation2004). The need for rework can partly be reduced by ensuring efficient information exchange with customers and by quality initiatives in the manufacturing processes (e.g. in the form of ‘right from me’).
2.2.2. Unsynchronized flows
Unsynchronized flows can occur due to variations in arrival intervals and operation times in the manufacturing processes when the variations are not synchronized. For example, short operation times followed by long arrival intervals may result in low capacity utilisation, and long operation times followed by short arrival intervals imply long queue times. Unsynchronized material flows can be an important cause for varying queue times and, by continuation, varying lead-times and low capacity utilisation. Two potential actions are partly to increase the degree of synchronisation between arrival intervals and operation times by avoiding, to the extent possible, crossing flows and partly by using the rule of shortest operation time for prioritisation if several operations are available. Another way to avoid variations in lead-times is to avoid planning very small and large manufacturing orders into the same material flow (Mattsson Citation2020). If possible, these manufacturing orders can, instead, be divided into two material flows, one with large and another with small manufacturing orders.
2.2.3. Inadequate production planning data
Inadequate production planning data can create variations in capacity requirements if based on data in the system that do not correspond to actual data, for example, if the operation times in the ERP system differ significantly from actual times in the manufacturing processes. Inadequate production planning data may also refer to incorrect set-up times or depending on variations due to sequence dependent set-up times. Inadequate production planning data here refers to inaccurate, incomplete, incompatible or inaccessible company data that misfits company requirements for what should be used in the ERP system and its supposed data format (Momoh, Roy, and Shehab Citation2010; Kaipia Citation2009), which can severely affect a company (Xu et al. Citation2002). Alshawi, Themistocleous, and Almadani (Citation2004) and Sánchez‐Rodríguez and Rafael Martínez‐Lorente (Citation2011) even argue that the whole ERP system becomes suspect if the data used is not accurate or immediately accessible.
Efforts to ensure data quality in the systems are, therefore, important actions for reducing variations in capacity requirements. The empirical results by Telles et al. (Citation2020) indicated this importance by getting more accurate assessments of the resource use when monitoring the manufacturing processes over time.
2.2.4. Deficient bills of materials
Deficient bills of materials (BOM) can increase variations in capacity requirements if specified quantities do not represent actual needs (Melnyk, Denzler, and Fredendall Citation1992). Efforts to improve bills of materials are proposed to reduce this self-induced variation.
2.2.5. Inadequate planning
Inadequate planning without formal and unified processes and lack of consistency in how responsibility is divided can lead to variations in capacity requirements. This can lead to planning and scheduling being done based on one’s individual preferences and targets with limited consideration of the system as a whole and the consequences of one’s own actions. Planning processes should be organized in a cross-functionally integrated structure to sufficiently capture issues in the demand and supply balancing (Shurrab, Jonsson, and Johansson Citation2022). In order to create preconditions for efficient flows, there is a need to establish unified processes, planning and scheduling methods (Shurrab, Jonsson, and Johansson Citation2022), and to clarify the division of responsibility in the functional integration (Chen and Small Citation1996).
2.2.6. Large manufacturing orders
Large manufacturing orders reinforce variations and the flow of materials. Large manufacturing orders can be avoided to a large extent by reduced set-up times, synchronized planning for orders with the same resources and equipment to reduce clashes in planning, and reduce order-preparation cost by rationalized registration from customer order to registered manufacturing order (Vollmann et al. Citation2005).
2.3. Causes and actions related to variations in available capacity
The available capacity for value-adding processes in manufacturing varies from period to period for numerous reasons. In this section, the identified causes behind the variations in available capacity and several actions that can be taken to reduce them are presented; see section 4 for a summary of causes and actions related to variations in available capacity.
2.3.1. Temporary capacity loss
As van Kampen, van Donk, and van der Zee (Citation2010) argued, capacity losses or shortages as a result of machine breakdown can cause great difficulties for delivery capability. Taylor (Citation2000) noted that the reliability of machines is an important influencing factor for the ability to deliver, which ultimately leads to variations in demand if customers experience delivery problems. The same concept applies to tools and other equipment used in manufacturing (Viveros et al. Citation2018). Temporary capacity losses are important causes of variations in available capacity. Temporary capacity loss can, for example, occur due to machine failure or breakdown, repair requirements or short-term absence of personnel. Actions can be taken to reduce unplanned loss of capacity, with the aim of reducing short-term absence of personnel and preventive maintenance to reduce the risk of unexpected manufacturing disruptions (Assid, Gharbi, and Hajji Citation2015).
2.3.2. Constrained sections
A constrained section, or bottleneck, refers to a highly occupied resource that is limiting the total material flow in a company and, thereby, the business as a whole (Telles et al. Citation2020). The concept of constraint or bottleneck can in a more general sense refer to for example materials, capacity or market (see e.g. Goldratt and Fox [Citation1986]) but here the focus is on capacity. For an overview of practices connected to constraints, see e.g. Rahman (Citation1998), Pacheco, Antunes Jr., and de Matos (Citation2021) and Modi, Lowalekar, and Bhatta (Citation2019). Time lost due to manufacturing disruptions in a constrained section also affects capacity utilisation and variations in available capacity in other parts of the manufacturing process (Dettmer Citation1997; Goldratt Citation2009). For this reason, it is important to avoid disruptions in constrained sections by ensuring the availability of capacity and materials. An important notion is that depending on the operating environment, a constraint is not necessarily static, it can be floating depending on seasonal or long-run changes in the product mix (Cox III and Schleier Jr. Citation2010).
Disruptions in a constraint can be reduced by having an extra set of tools, access to alternative staffing during short-term absences, and ensuring effective preventive maintenance (Viveros et al. Citation2018). Manufacturing disruptions can also be caused by material shortages; to avoid these, the material supply needs to be secured by more-proactive material planning (Fredriksson, Wänström, and Medbo Citation2014; Kaipia Citation2009; Smeltzer and Siferd Citation1998). This includes preventive actions to ensure material availability (Fredriksson, Wänström, and Medbo Citation2014). For example, by having and using forecast and/or delivery plans from customers, base decisions on shared information and frequent communication with suppliers in the order to delivery process (Kaipia Citation2009), apply delivery monitoring before planned delivery date of incoming materials and check material availability by frequent stock checks (Mattsson Citation2017a). See also Jonsson and Mattsson (Citation2003) for an evaluation of how appropriate different material planning methods are based on different characteristics in manufacturing companies.
2.3.3. Inadequate planning
In the case of incorrect capacity estimates, the planning would be based on a capacity level that does not correspond to the actual available capacity. Variations in available capacity may also be a consequence of planning that does not include expected capacity losses, indirect time estimated incorrectly, or set-up activities not being prepared and material issues not being carried out in time before manufacturing is planned to begin. Inadequate planning can be reduced by formalizing and improving the planning processes, working to ensure correct capacity estimates including indirect time, having regular meetings with manufacturing personnel, and preparing tool changes and material preparations before the planned start of orders.
2.3.4. Unstable support processes
Support processes refer to processes that intend to support manufacturing, for example, in the form of material supply, preparation and planning. If these processes do not work as intended, this can result in capacity not being utilized to the fullest potential and, thus, variations in available capacity arising. Moreover, it can lead to additional costs by corrective actions as expediting, overtime and express transports (Forslund and Jonsson Citation2007; Fredriksson, Wänström, and Medbo Citation2014). More-stable and efficient support processes can be created through continuous improvements (see e.g. Beraldin, Danese, and Romano [Citation2022] that emphasize employee involvement for significant effect on organisational outcomes). These can also be achieved through more formalized routines and divisions of labour with periodic reviews of existing routines.
2.4. Causes and actions related to variations in delivery lead-time from suppliers
Customers normally have expectations of current delivery lead-times before placing an order to a supplier. This delivery lead-time is generally registered in the company’s business system and is used to plan new orders, i.e. it is a dimensioning delivery lead-time for procurement of materials (Mattsson Citation2017a). Moreover, it can be considered a forecast of what can be expected. At the time of order placement, the customer receives a response from the supplier regarding when it is possible to deliver the order, i.e. a delivery lead-time that can be considered confirmed or an agreed-upon delivery lead-time. However, the actual and real delivery lead-time will not be apparent until the time of delivery. Variations in delivery lead-times are apparent when there is a discrepancy between these types of delivery lead-times. In general, two different kinds of variations arise, i.e. variations in delivery lead-time before and after ordering (Mattsson Citation2017a). Proposed actions for these variations are presented in this section, including variations in delivery lead-time for first-time procurement of input materials. In section 4, the identified causes and actions are summarized.
2.4.1. Delivery lead-time variation before order: discrepancy between expected and confirmed delivery lead-times
Variations in delivery lead-time before orders represent a variation between expected and confirmed delivery lead-times and show how much the delivery lead-time from a supplier varies from order to order (Mattsson Citation2017a, Citation2003). Wikner (Citation2005) proposed a number of general strategies for reducing elements of uncertainty in supply chains, where the information-sharing strategy implies that suppliers continuously inform their customers about current delivery lead-times. Through continuous dialogue with suppliers, planning systems can be updated with current information to reduce the risk of variations in delivery lead-times before ordering (Mattsson Citation2003). Mattsson (Citation2017a) describes how a collaboration strategy or integration strategy can be applied to reduce variations in delivery lead-time from suppliers. It could be a matter of agreements regarding fixed delivery lead-times (Swenseth and Buffa Citation1991) or of assigning the inventory control to the supplier (so-called vendor-managed inventory, VMI). Variations can be reduced when suppliers manage the inventory as the supplier, through access to information regarding customers’ inventory levels, can prioritize deliveries with an obvious risk of shortage (Mattsson Citation2017a). One form of an extreme case is to consider alternative suppliers (Tomlin Citation2006). Angulo, Nachtmann, and Waller (Citation2004) described this as a potential action for customers, where inability to deliver can lead to lack of sales not only at the time of the shortage but also potentially in the future.
2.4.2. Delivery lead-time variation after order: discrepancy between confirmed and actual delivery lead-times
Variations in delivery lead-time after order are those occurring between the confirmed and actual delivery lead-time, often used to measure delivery accuracy (Mattsson Citation2017a). Mattsson (Citation2017a) demonstrated that different delivery accuracy strategies can reduce variations in delivery lead-time from suppliers through delivery monitoring or penalty clauses. Delivery monitoring is a matter of reminding the supplier to deliver on time, proactively or reactively. Proactive delivery monitoring is here called pre-monitoring and implies that the supplier is reminded to deliver a certain time before the actual delivery time that has been agreed upon. Reactive monitoring is here called post-monitoring, meaning that the supplier is reminded when delivery is delayed in the hope of reducing the extent of the delay (Mattsson Citation2017a). Penalty clauses can also motivate the supplier to maintain high delivery accuracy. Mattsson (Citation1995) stressed the importance of providing information to customers when variations in delivery lead-time become apparent so that they have an opportunity to adapt their operations to prevailing variations. Agreements that the supplier will inform the customer in advance of expected delivery delays can, therefore, provide opportunities to take appropriate measures so that subsequent links in the supply chain are not affected (Christopher and Lee Citation2004).
2.4.3. First-time procurement of input materials
Choosing reliable suppliers is often considered an important but challenging task (Lamba and Singh Citation2017; Hasan et al. Citation2022). There is a high probability that the actual delivery lead-time differs remarkably from the one expected when using a new supplier for existing materials as there is no previous perception of the lead-time that can be used to support decisions about when to order. This risk is also high for first-time purchases of materials that have not been acquired previously from existing suppliers. It is recommended that special routines be applied for information exchange in first-time procurement situations in order to reduce the risk of variations in delivery lead-time. Special routines could vary depending on possibilities and appropriateness for different companies but could, for example, be direct contact with representatives from the supplier during ordering to get actual delivery lead-times, having contact during the delivery lead-time or pre-monitoring to increase the probability of timely delivery.
2.5 A Framework of causes and actions for self-induced variations
In total, 22 causes and 60 actions for reducing self-induced variations have been identified to form a conceptual framework. These causes and actions are divided based on the type of variation and are presented in section 4 together with empirical results regarding which actions are applied in six manufacturing companies.
3. Empirical data collection
The conceptual framework of causes for variations and actions to reduce the variations has been created based on conceptual, logical reasoning and existing literature. The framework has been used to study the extent to which the causes are experienced in practice and the actions that companies apply to reduce the variations. A total of six companies and 15 respondents have been included in the study. A qualitative direction has been applied, which is considered an appropriate choice as it enables studying, exploring and generating a deeper understanding of the subject area of interest (Yin Citation2014). The data collection included a literature study and a case study, where the latter consisted of a workshop and interviews with respondents from the companies. In , the meetings conducted as part of this study are presented. Company names have been anonymized using Company A, Company B and so on, and hereafter, R is used together with a respondent number in line with to indicate the respondent of interest.
Table 1. Compilation of empirical data collection.
A traditional approach has been applied to study the existing literature because of the distinct nomenclature within the subject area of interest. The case study included interviews, document studies and a workshop. Four of the companies were part of a research project (Companies A–D), while two were added for the purpose of this study (Companies E–F). Only manufacturing companies were considered for this study, and respondents were selected based on the criteria of having a holistic understanding of production planning and control, being knowledgeable about procurement, and having knowledge about sales for the customer perspective. In addition, it was considered preferable if the respondent was involved in strategic decision-making for the manufacturing company in order to know more about the details connected to the actions applied in the company.
The companies included in the research project were provided with questions to discuss internally before the workshop. During the workshop, the companies presented the work carried out related to the questions and were offered the opportunity to develop further thoughts through discussions (in , 10 h represents the total amount of time for the whole workshop, i.e. including presentations from the companies and discussions, distributed over two days). Before the interviews, audio-recordings from the workshop were studied for the purpose of creating an interview guide and ensuring that all parts covered during the workshop would also be addressed during the interviews with the two additional companies. Lincoln and Guba (Citation1985) described the importance of reliability, which is considered to be strengthened in this study by the recording of interviews and the workshop, where relevant information has been transcribed.
4. Research results and analysis
The theoretical frame of reference unfolds a framework that is here integrated with the results from the conducted workshop and interviews regarding the extent to which the studied companies utilize a set of proposed actions. A total of 22 causes and 60 actions for reducing variations have been identified. In the framework, columns A through F represent Company A, Company B and so forth. In the columns for the companies, an X means that the company use the action to reduce variations. The use of proposed actions varies among the six studied companies, where the most utilized actions and findings will be explained further in the following sections. See also Appendix 1 for a supplementary table of the discussed actions, where actions applied by at least five out of six companies are summarized together with an example quote from one of the respondents.
4.1. Actions related to variations in demand
For variations in demand, only one action has been applied by all six companies and four actions are not mentioned by any company at all (see ), indicating a gap between theory and application in practice. Large customer orders, changed delivery lead-times to customers and returns from customers are the most commonly experienced causes for variations in demand that the companies try to reduce by a couple of the proposed actions.
Table 2. Applied actions to reduce variations in demand.
The most-common action connected to order size for this type of variation is to facilitate order placement, especially for large customers, which can contribute to more-frequent ordering and decreased order sizes (Mattsson Citation1995). Interestingly, most of the companies offer quantity discounts and have campaigns, inducing customers to order more, which amplifies order quantities and variations in demand. The consequences of lumpy demand, challenges to maintain low inventories, and even capacity utilization may erode the advantages of temporarily increased sales (Croson and Donohue Citation2009). In addition, the increased sales from a promotion might be perceived as gained market shares if communication within the company is lacking or deficient (Mather Citation1996). This happened to Company D, where it went so far as to make major investments to reinforce manufacturing. When the promotion ended, sales dropped radically and resulted in barely one of four machines for the product being fully utilized.
Generally, if internal communication is lacking, a gap between required resource availability and demand due to a promotion might occur. This could, in turn, lead to delivery problems with extended delivery lead-times (Mather Citation1996) and could, consequently, increase variations in demand if customers start questioning the deliver capability and start ordering larger quantities or ordering earlier in advance than required (Christopher and Lee Citation2004). Several companies argued that urgent volumes always need to be delivered but that partial deliveries are investigated as an option in periods of high demand. Delivering with longer delivery lead-times for large orders is in line with the recommendation made by Mattsson (Citation2012). Using simulations, he showed that tied-up capital is significantly affected if exceptionally large customer orders are included in the inventory management. Company E’s respondents also emphasized the importance of maintaining customer trust by keeping what is promised to reduce variations that arise because of delivery problems. However, R8 explained that there are some exceptions. Specifically, Company E had a case of a large customer where a strategic deal was made and resulted in many other customers being affected. This highlights that prioritization is always involved when there are apparent constraints (Pacheco, Antunes Jr., and de Matos Citation2021).
All the companies’ respondents stressed a need to work with continuous process development to avoid reclaims (i.e. returns from customers) due to quality problems (as recommended by O’Neill, Sohal, and Teng [Citation2016]), which is an expected result as the companies have brands associated with high-quality products. Company E’s respondents argued that they would prefer to scrap a manufacturing order if they are uncertain about being able to deliver a level of quality that corresponds to the customers’ expectations. R8 of Company E talked about a large reclaim from a customer where the company made investigations with test orders to identify the problem. The problem was found to be in the customer’s manufacturing process, resulting in change of attitude when Company E could demonstrate control over their processes as well as the ability to identify the customer’s problem, thereby increasing customer loyalty.
4.2. Actions related to variations in internally generated capacity requirements
Regarding actions to reduce variations in internally generated capacity requirements, there are four of twelve actions applied in all the studied companies. Rework, inadequate planning data and inadequate planning processes are the main experienced causes for internally generated capacity requirements that all the companies work actively to reduce ().
Table 3. Applied actions to reduce variations in internally generated capacity requirements.
Company B’s respondents explained that rework is a consequence of inadequate quality from suppliers, assembly errors, flawed maintenance or faulty design. R1 said that Company A has strived to create a culture that promotes root cause analysis so that the same problem should not be repeated. This type of improvement work is apparent in all the companies and aligns with the general process proposed in quality management literature; see e.g. Viveros et al. (Citation2018).
To improve current planning processes or planning data unfolds to be the main applied actions in practice, where measurements are considered fundamental to enable the improvement work. Company A emphasized the need to measure achieved values to compare expected versus actual values, for example, of operating times, to use as accurate parameters to the extent possible within the business systems. This is an important notion as what is measured often is done and enables greater control of what is measured, but foremost, measuring planned and achieved values is a prerequisite for becoming aware of deviations and understanding actual problems (Mather Citation1996) in order to create a reference point in improvement work (Palmatier Citation1988). Discussing Company A’s work to improve basic data quality and reduce deficiencies in the production planning data, R1 explained, ‘We measure outcomes continuously, pre-calculation against post-calculation…trying to use the parameters in the business system to give an as accurate capacity picture as possible’. Company C added that errors easily sneak into the configurations for customer order-driven products, which also applies to the product structures. R5 believes that continuous improvement work is the key to reducing these causes of variations in capacity requirements.
Company F’s respondents explained how they work to avoid sub-optimization in their planning, pinpointing the importance of creating a holistic understanding for all employees so that a customer-centric focus can be established instead of focussing on what is easiest for themselves. Company E struggles with the challenge of planning manufacturing influenced by several parties, including research and development, global sales, global planning, various projects and various production units. R8 explained that they work extensively on collocating the needs of all these actors because, previously, there have been orders entered into manufacturing without going through the planning department. Furthermore, R8 added, ‘We try to puzzle it all together; we usually joke that we are more of a parry department instead of a planning department. We struggle a lot with that’. The planning for the various manufacturing sections has, therefore, been initiated by having joint meetings to avoid sub-optimization.
4.3. Actions related to variations in available capacity
Two of the companies utilize all the proposed actions for variations in available capacity, while five of twelve actions were mentioned by all companies and four actions were mentioned by five of six companies (). In other words, many of the proposed actions for variations in available capacity are applied in practice. Resource availability strongly influences delivery capability (Viveros et al. Citation2018). If the reliability in the available capacity is questionable, it can ultimately lead to variations in demand if customers experience delivery problems (Taylor Citation2000), meaning that one source of variation (e.g. in capacity availability) can impact another source of variation (e.g. in demand). Variations in available capacity are well-known to the companies and are situations they experience on a daily basis due to temporary capacity losses. The high utilization of proposed actions for this source of variation is probably due to the direct impact on daily operations that variations in available capacity cause. This is in line with Assid, Gharbi, and Hajji (Citation2015), who emphasized reducing short-term absences of personnel and ensuring preventive maintenance to decrease the number of unexpected manufacturing disruptions.
Table 4. Applied actions to reduce variations in available capacity.
Almost all the companies work to reduce capacity losses by planning and structuring as much as possible, together with various actions to decrease capacity losses due to machine failure and sick leave, although it is not only a matter of technical issues. Company E, R8 explained, ‘We have sick leave that we know is not due to sick people…. We therefore work a lot with leadership training and not only spread it to managers but also to informal leaders in the organization to increase attendance’. Hence, absence may not always be a result of illness but rather a matter of soft values that are important to consider when identifying appropriate actions for this type of capacity loss.
Inadequate planning can create variations in available capacity because, among other factors, actual availability does not always correspond to the availability that was assumed during planning. An important aspect to take into consideration, according to Company B, is to include ramp-up losses when using temporary employment or starting new projects and to ensure that all meetings are included in indirect time when planning. R3 expressed that this has helped Company B to maintain good delivery reliability to customers. Company C’s respondents explained that their planning is based on a promised capacity where deviations occur due to short-term absences, material shortages and rework. R5 continued, ‘There is an overcapacity of up to 40% but it diminishes quickly’. R8 explained that, for planning at Company E, ‘We work to reduce set-up times but above all to set correct times’ and added that they are implementing a new system where information on actual times and actual manufacturing efficiency can be obtained. This is expected to result in an increased understanding of the current situation and is a starting point that will help in the improvement work to reduce variations.
4.4. Actions related to variations in delivery lead-time from suppliers
Variations in delivery lead-time from suppliers are often argued to have more-severe consequences than the length of the delivery lead-time (Corbett Citation1992). There still seems to be a strong focus on short delivery lead-times in both theory and practice that has prevailed for the last couple of decades, with a focus on shortening rather than ensuring secure delivery lead-times. Interestingly, this contradicts several studies that indicate that businesses generally value secure timing of deliveries more than short delivery lead-times (see e.g. Keebler and Manrodt [Citation2000] or Van der Hoop and Pfohl [Citation1996]). The respondents from the six manufacturing companies in this study agree that reliable delivery lead-times are important; nevertheless, their agreements with suppliers are for approved intervals instead of fixed delivery lead-times (i.e. delivery windows as described by [Corbett Citation1992]). Two of the companies do not have any agreements at all but found this to be a fundamental area for improvement in the near future as they have encountered problems when supplier performance does not correspond to expectations. Regarding Company E, R9 mentioned that it is hard to complain when actual delivery lead-time does not correspond to what was expected if no agreements are in place, which is the current situation in their case. However, this is about to change as Company E has plans to hire a person responsible for contracts with suppliers who will also work on reducing variations in delivery lead-times.
The most-common actions applied by the companies were monitoring delayed orders and providing technical support to suppliers to minimize prevailing variations (). Company B uses a shortlist of delayed orders that is updated daily, where critical orders or materials are carefully monitored. Company D and Company A have a structured way of keeping track of supplier performance (including variations in delivery lead-time) and maintaining pressure on questionable suppliers. Confirmed delivery lead-times are compared with actual delivery lead-times for measuring delivery capability of Company A’s suppliers, to be used in quality reviews with the suppliers with intent to reduce the variations.
Table 5. Applied actions to reduce variations in delivery lead-time from suppliers.
R1 explained that Company A has an escalation model called the ‘Pyramid’, where the focus is on those suppliers who cause the most problems. According to R1, ‘At the top we basically have one person at the supplier all the time depending on how critical the material is. The suppliers know about the Pyramid and no one wants to be at the top of it’. In spite of this, R1 pointed out that there are a lot of variations in delivery lead-time and that, in part, Company A deserves the long delivery lead-times it has: ‘…we absorb a lot of disturbances due to poor delivery performance [from suppliers] as we still have a good delivery capability out [to customers]’.
5. Actions not applied in practice
The causes in the conceptual framework are more or less experienced by the companies depending on their manufacturing environments. The empirical part of this study has focussed on the experienced causes and applied actions, rather than why the companies do not utilize one or the other proposed action. In this section some potential explanations why certain actions are not applied in the companies are discussed.
When it comes to variations in demand, several proposed actions are not applied in practice. One example is Company A that has engineer-to-order and make-to-order products, where orders usually constitute one product per order. Large customer orders as a cause for variations in demand would then be when two or more products are ordered by customers (without a delivery schedule), which is seldom the case. This can explain why Company A do not apply that many of the proposed actions for variations in demand.
None of the companies mentioned the alternative of dividing a large manufacturing order among several manufacturing sites as an action to prevent unsynchronized flows and reduce variations in internally generated capacity requirements, which would probably be utilized only when capacity on-site is insufficient or as a strategy to come closer to the market. Only half the companies apply any of the proposed actions for unsynchronized flows, although all of them mentioned that they experience unsynchronized flows as an important cause for variations in capacity requirements. This could be explained by the costs associated with the actions if substantial investments in capacity are needed to avoid intersecting flows (Hopp and Spearman Citation2004). Additional examples of actions not applied in the studied companies are delivery monitoring for all deliveries (pre- and post-monitoring) and delivery monitoring before or after all deliveries for variations in delivery lead-time from suppliers. This is to be expected, given the extensive requirements of resources that would be needed to control all deliveries, where most delivery monitoring before delivery would be unnecessary for reliable suppliers (Mattsson Citation2017a).
Subsequently, actions not applied in practice are potentially related to, for example, causes not experienced as a problem in practice and actions connected to large investments. Other potential explanations could be that the companies do not consider the action suitable or necessary for their business (e.g. the theoretical possibility of delivery monitoring for all deliveries), or have not thought of the action as a potential solution for reducing variation (i.e. have not been aware of the connection between variation, cause and action before introduction to the conceptual framework).
6. Implications for practice
Instead of blaming variations on customers and suppliers, it is of fundamental importance to examine the internal rules, routines and behaviours that contribute to both internal and external variations (Hopp and Spearman Citation2021). Managers can address the causes for self-induced variations by identifying which causes are apparent in their own company and which potential actions are appropriate to consider. Few problems are unique. ‘Firefighting’ is often used for recurring problems without solving the root cause. Measuring is required to observe and identify the correct cause for variations (Lei and MacKenzie Citation2020), while awareness and caution are needed as structures (e.g. key performance indicators, KPIs) that create certain behaviours that can, in turn, increase variations. The conceptual framework of self-induced causes and actions presented in this study seeks to increase awareness and can be used as a support and a step, together with traditional methods for improvement work (see e.g. Viveros et al. [Citation2018]), towards reducing variations. Hence, this study proposes that improvements in variation-reducing actions can be increased as more alternatives are acknowledged by using a conceptual framework with explicit actions for common causes experienced in manufacturing companies. In practice, the conceptual framework can be used as support when certain events occur and problems with variations are acknowledged. First, the source of the variation needs to be identified and its severity investigated (Lei and MacKenzie Citation2020). This could be acknowledged based on patterns or trends in behaviour, where underlying structures need to be scrutinized if internal company procedures are found to be the cause of the problem. The listed causes can facilitate the identification of the problem, and listed actions can be evaluated for prioritizing those with which to proceed (Gupta et al. Citation2022). One of the companies acknowledged the potential for using the framework internally and cross-functionally to increase awareness of how decisions in different departments affect each other, by having a workshop to review the conceptual framework and to initiate discussions for enhancing their improvement work connected to variations. This is in line with the intended practical possibilities of this study.
7. Theoretical contribution and further research
The less variation, the higher financial performance, and managers should therefore continuously evaluate variations and ways to reduce them (Germain, Claycomb, and Dröge Citation2008). Gupta et al. (Citation2022) argued that organizational culture has a direct impact on growth and profitability. The results of this study build on this notion, where certain behaviours that lead to suboptimizations and undesirable effects on variations could and should be avoided.
Consequently, variations need to be identified and there are several ways to identify variations, see e.g. Lei and MacKenzie (Citation2020). Traditional techniques for continuous improvement could be used to identify variations but do not fully capture all variations (Luz et al. Citation2022), and companies might then miss to identify some causes for variation. The conceptual framework in this study can therefore complement such techniques, potentially leading to more causes to evaluate than first perceived. Lei and MacKenzie (Citation2020) also argued that people try to reduce variations based on own experiences and might make faulty decisions if the one making the decision miss that the variation has a random rather than assignable (and self-induced) cause. This study complements the study by Lei and MacKenzie (Citation2020) by connecting self-induced variations to specific causes that are common in companies and suitable actions for these causes, leading to a reduced need to correctly evaluate the variation and instead focus on the causes and actions.
Causes for variations include faulty policies that most often are based on age-old assumptions no longer valid for today’s operating environments. These are found at all levels in supply chains and can be devastating for competitiveness (Modi, Lowalekar, and Bhatta Citation2019). Modi, Lowalekar, and Bhatta (Citation2019) further found that simple changes can contribute to substantial improvements. The importance of identifying causes of variation and to establish potential solutions was highlighted by Sibanda and Ramanathan (Citation2019), although in general term by e.g. brainstorming and cause-effect diagrams. This study complements existing work by Modi, Lowalekar, and Bhatta (Citation2019) and Sibanda and Ramanathan (Citation2019) around reducing variations, by synthesizing scattered knowledge of specific causes and actions for self-induced variations into a conceptual framework, with rather simple changes proposed as actions for improvement. Which causes impact variations the most and the actions with highest effect on reducing variations, costs, and delivery performance in different types of companies and situations are potential areas for further research. Big data applications could potentially be used for risk analysis and control can increase visibility of emerged variations in the supply chain (Ivanov and Dolgui Citation2021) but no matter how advanced technological solutions there are, human integration is most often needed (Helo and Hao Citation2022). The causes and actions for self-induced variations in this study are connected to underlying structures, which are certainly management decisions that could and should be considered when designing advanced technological solutions (Min et al. Citation2019).
A need for further qualitative research that addresses a comprehensive view of variations and the interplay between variations has been emphasized by Simangunsong, Hendry, and Stevenson (Citation2012). An enhanced integrated and comprehensive perspective, covering variations in demand, internally generated capacity requirements, capacity availability and delivery lead-time from suppliers is provided in this study. Several of the identified causes can affect other causes for variation, e.g. that temporary capacity loss (i.e. variation in available capacity) can lead to a need for changed delivery lead-time to customer and therefore potentially also lead to variations in demand. Further research could investigate such interrelations and propagation between causes, qualitatively and quantitatively. In addition, to determine which actions are key in different contexts and in relation to the alternative cost of buffers is proposed as a further research direction.
8. Conclusions
In this study, a total of 22 causes for self-induced variations have been identified and 60 different actions proposed in a conceptual framework designed to reduce self-induced variations that affect a company and are possible to affect. By including both internal and external variations, a more-holistic perspective is possible, as warranted by Koh, Saad, and Jones (Citation2002). In contradistinction to Koh, Saad, and Jones (Citation2002), this area of research is considered to benefit from qualitative research approaches for the development of management practices and decision support for practical application. This insight has become apparent in the collaboration with the manufacturing companies as overly advanced theoretical and quantitative methodologies are considered overwhelming and difficult to grasp.
All the causes in the proposed framework have been more or less experienced in the studied companies. 38 out of 60 actions were mentioned as utilized by at least half the companies, indicating that many actions are utilized by many of the companies and that the conceptual framework is reasonably complete and relevant for practice. Hopp and Spearman (Citation2004) emphasized the importance of reducing variations through general improvement methodologies (as e.g. Viveros et al. [Citation2018]). The proposed framework can contribute to variation-reducing actions for internal and external variations, especially together with general improvement methodologies. As it is the combination of existing variations that determines the need for buffers, an increased awareness of which variations occur and the causes behind them, together with potential actions, can lead to an increased understanding of how self-induced variations can be reduced and managed. The obtained results give an indication of how companies work to reduce their variations, often through simple changes in internal policies and procedures. The study indicates that one type of variation may influence other types of variations. Further research is needed to study such relationships. There is also a need for further research regarding how effective various kinds of variation-reducing actions are in practice for facilitated prioritization between different alternatives of methods and actions.
Acknowledgement
The authors acknowledge the Knowledge Foundation, Jönköping University, and the industrial partners for financially supporting the research and education environment on Knowledge Intensive Product Realization SPARK at Jönköping University, Sweden.
Disclosure statement
No potential conflict of interest was reported by the author(s).
Additional information
Funding
Notes on contributors

Lisa Hedvall
Lisa Hedvall is a Ph.D. candidate in Production Systems at the Department of Supply Chain and Operations Management, School of Engineering, Jönköping University, Sweden. She holds a Lic. Eng. in Production Systems, with a licentiate thesis titled ’Reducing and absorbing variations in a manufacturing context: A capacity management perspectivé. Her research interests are primarily in variation management and buffer management, with a special interest in the decision-making process connected to these issues for facilitating practical application. This is also the focus of her work towards becoming a Ph.D.

Stig-Arne Mattsson
Stig-Arne Mattsson has over 30 years of company experience in Production and Inventory Management, Supply Chain Management and Information Systems. Parallel to his industrial career he was Adjunct Professor in Supply Chain Management at Växjö/Linnaeus University, Lund University, Chalmers University and is currently senior professor at Jönköping University in Sweden. He has written a number of textbooks and papers in internationally acknowledged journals within the area of Production and Inventory Management. He is certified in Production and Inventory Management (CFPIM) by The Association for Supply Chain Management, ASCM, and in Logistics (ESLog) by European Logistics Association, ELA.
References
- Alshawi, Sarmad, Marinos Themistocleous, and Rashid Almadani. 2004. “Integrating Diverse ERP Systems: A Case Study.” Journal of Enterprise Information Management 17 (6): 454–462. doi:10.1108/17410390410566742
- Angulo, Andres, Heather Nachtmann, and Matthew. A. Waller. 2004. “Supply Chain Information Sharing in a Vendor Managed Inventory Partnership.” Journal of Business Logistics 25 (1): 101–120. doi:10.1002/j.2158-1592.2004.tb00171.x
- Assid, M., A. Gharbi, and A. Hajji. 2015. “Joint Production, Setup and Preventive Maintenance Policies of Unreliable Two-Product Manufacturing Systems.” International Journal of Production Research 53 (15): 4668–4683. doi:10.1080/00207543.2015.1030468
- Begen, Mehmet. A., Hubert Pun, and Xinghao Yan. 2016. “Supply and Demand Uncertainty Reduction Efforts and Cost Comparison.” International Journal of Production Economics 180: 125–134. doi:10.1016/j.ijpe.2016.07.013
- Ben-Ammar, Oussama, Belgacem Bettayeb, and Alexandre Dolgui. 2020. “Integrated Production Planning and Quality Control for Linear Production Systems under Uncertainties of Cycle Time and Finished Product Quality.” International Journal of Production Research 58 (4): 1144–1160. doi:10.1080/00207543.2019.1613580
- Beraldin, Andrea Roberto, Pamela Danese, and Pietro Romano. 2022. “Employee Involvement for Continuous Improvement and Production Repetitiveness: A Contingency Perspective for Achieving Organisational Outcomes.” Production Planning & Control 33 (4): 323–339. doi:10.1080/09537287.2020.1823024
- Bititci, Umit, Patrizia Garengo, Viktor Dörfler, and Sai Nudurupati. 2012. “Performance Measurement: Challenges for Tomorrow.” International Journal of Management Reviews 14 (3): 305–327. doi:10.1111/j.1468-2370.2011.00318.x
- Bourne, Mike, and Matteo Mura. 2018. “Performance and Risk Management.” Production Planning & Control 29 (15): 1221–1224. doi:10.1080/09537287.2018.1520319
- Buzacott, John A., and J. George Shanthikumar. 1994. “Safety Stock versus Safety Time in MRP Controlled Production Systems.” Management Science 40 (12): 1678–1689. doi:10.1287/mnsc.40.12.1678
- Cachon, Gérard P., and Marshall Fisher. 2000. “Supply Chain Inventory Management and the Value of Shared Information.” Management Science 46 (8): 1032–1048. doi:10.1287/mnsc.46.8.1032.12029
- Cardoso, Diogo, and Luís Ferreira. 2020. “Application of Predictive Maintenance Concepts Using Artificial Intelligence Tools.” Applied Sciences 11 (1): 18. doi:10.3390/app11010018
- Chen, Injazz J., and Michael H. Small. 1996. “Planning for Advanced Manufacturing Technology.” International Journal of Operations & Production Management 16 (5): 4–24. doi:10.1108/01443579610113915
- Christopher, Martin, and Hau Lee. 2004. “Mitigating Supply Chain Risk through Improved Confidence.” International Journal of Physical Distribution & Logistics Management 34 (5): 388–396. doi:10.1108/09600030410545436
- Corbett, Lawrence M. 1992. “Delivery Windows – A New View on Improving Manufacturing Flexibility and on-Time Delivery Performance.” Production and Inventory Management Journal 33 (3): 74–79.
- Cox, James F. III, and John G. Schleier, Jr. 2010. Theory of Constraints Handbook. New York: McGraw-Hill Education.
- Croson, Rachel, and Karen Donohue. 2009. “Impact of POS Data Sharing on Supply Chain Management: An Experimental Study.” Production and Operations Management 12 (1): 1–11. doi:10.1111/j.1937-5956.2003.tb00194.x
- Dettmer, H. William. 1997. Breaking the Constraints to World-Class Performance. Vol. 1. Millwaukee: McGraw-Hill.
- Disney, S. M, and D. R. Towill. 2002. “A Procedure for the Optimization of the Dynamic Response of a Vendor Managed Inventory System.” Computers & Industrial Engineering 43 (1–2): 27–58. doi:10.1016/S0360-8352(02)00061-X
- Forslund, Helena, and Patrik Jonsson. 2007. “The Impact of Forecast Information Quality on Supply Chain Performance.” International Journal of Operations & Production Management 27 (1): 90–107. doi:10.1108/01443570710714556
- Fox, M. L. 1996. “Integrating Vendor-Managed Inventory into Supply Chain Decision-Making.” In APICS International Conference and Exhibition, 126–128.
- Fredriksson, Anna, Carl Wänström, and Lars Medbo. 2014. “Assuring Materials Availability during the Production Transfer Process: Critical Characteristics of the Materials Planning Environment.” Journal of Manufacturing Technology Management 25 (3): 310–333. doi:10.1108/JMTM-02-2012-0016
- Germain, Richard, Cindy Claycomb, and Cornelia Dröge. 2008. “Supply Chain Variability, Organizational Structure, and Performance: The Moderating Effect of Demand Unpredictability.” Journal of Operations Management 26 (5): 557–570. doi:10.1016/j.jom.2007.10.002
- Goldratt, Eliyahu M. 2009. “Standing on the Shoulders of Giants: Production Concepts versus Production Applications. The Hitachi Tool Engineering Example.” Gestão & Produção 16 (3): 333–343. doi:10.1590/S0104-530X2009000300002
- Goldratt, Eliyahu M., and Robert E. Fox. 1986. The Race. NY, USA: The North River Press.
- Gopalakrishnan, Maheshwaran, Mukund Subramaniyan, and Anders Skoogh. 2022. “Data-Driven Machine Criticality Assessment – Maintenance Decision Support for Increased Productivity.” Production Planning & Control 33 (1): 1–19. doi:10.1080/09537287.2020.1817601
- Gupta, Mahesh, Abhijeet Digalwar, Ajay Gupta, and Animesh Goyal. 2022. “Integrating Theory of Constraints, Lean and Six Sigma: A Framework Development and Its Application.” Production Planning & Control 2022: 1–24. doi:10.1080/09537287.2022.2071351
- Hasan, Ruaa, Muhammad Mustafa Kamal, Ahmad Daowd, Tillal Eldabi, Ioannis Koliousis, and Thanos Papadopoulos. 2022. “Critical Analysis of the Impact of Big Data Analytics on Supply Chain Operations.” Production Planning & Control 2022: 1–25. doi:10.1080/09537287.2022.2047237
- Hayes, Robert H., and Steven C. Wheelwright. 1984. Restoring Our Competitive Edge: Competing through Manufacturing. New York: John Wiley & Sons Inc.
- Hedvall, Lisa, Joakim Wikner, and Per Hilletofth. 2017. “Introducing Buffer Management in a Manufacturing Planning and Control Framework.” In Advances in Production Management Systems. The Path to Intelligent, Collaborative and Sustainable Manufacturing, 366–373. IFIP International Federation for Information Processing 2017: Springer International Publishing AG 2017.
- Hedvall, Lisa. 2018. “Buffers in Capacity Management: A Multiple Case Study.” Paper Presented at the 25th International Annual EurOMA Conference, Budapest, Hungary, June 24–26.
- Helo, Petri, and Yuqiuge Hao. 2022. “Artificial Intelligence in Operations Management and Supply Chain Management: An Exploratory Case Study.” Production Planning & Control 33 (16): 1573–1590. doi:10.1080/09537287.2021.1882690
- Hopp, Wallace J., and Mark. L. Spearman. 2004. “To Pull or Not to Pull: What is the Question?” Manufacturing & Service Operations Management 6 (2): 133–148. doi:10.1287/msom.1030.0028
- Hopp, Wallace J., and Mark S. Spearman. 2021. “The Lenses of Lean: Visioning the Science and Practice of Efficiency.” Journal of Operations Management 67 (5): 610–626. doi:10.1002/joom.1115
- Ivanov, Dmitry, and Alexandre Dolgui. 2021. “A Digital Supply Chain Twin for Managing the Disruption Risks and Resilience in the Era of Industry 4.0.” Production Planning & Control 32 (9): 775–788. doi:10.1080/09537287.2020.1768450
- Jonsson, Patrik, and Stig-Arne Mattsson. 2003. “The Implications of Fit between Planning Environments and Manufacturing Planning and Control Methods.” International Journal of Operations & Production Management 23 (8): 872–900. doi:10.1108/01443570310486338
- Kaipia, Riikka. 2009. “Coordinating Material and Information Flows with Supply Chain Planning.” The International Journal of Logistics Management 20 (1): 144–162. doi:10.1108/09574090910954882
- Keebler, James S., and Karl B. Manrodt. 2000. “The State of Logistics Performance Measurement.” In Council of Logistics Management Fall Meeting, 273–283. New Orleans, LA, USA.
- Koh, S. C. L., S. M. Saad, and M. H. Jones. 2002. “Uncertainty under MRP-Planned Manufacture: Review and Categorization.” International Journal of Production Research 40 (10): 2399–2421. doi:10.1080/00207540210136487
- Koufteros, Xenophon, Anto Verghese, and Lorenzo Lucianetti. 2014. “The Effect of Performance Measurement Systems on Firm Performance: A Cross-Sectional and a Longitudinal Study.” Journal of Operations Management 32 (6): 313–336. doi:10.1016/j.jom.2014.06.003
- Lamba, Kuldeep, and Surya Prakash Singh. 2017. “Big Data in Operations and Supply Chain Management: Current Trends and Future Perspectives.” Production Planning & Control 28 (11–12): 877–890. doi:10.1080/09537287.2017.1336787
- Laseter, Timothy M. 1998. Balanced Sourcing: Cooperation and Competition in Supplier Relationships. San Francisco: Jossey-Bass Publishers.
- Leachman, Chien, C. Carl Pegels, and Seung Kyoon Shin. 2005. “Manufacturing Performance: Evaluation and Determinants.” International Journal of Operations & Production Management 25 (9): 851–874. doi:10.1108/01443570510613938
- Lee, Hau L., V. Padmanabhan, and Seungjin Whang. 1997. “Information Distortion in a Supply Chain: The Bullwhip Effect.” Management Science 43 (4): 546–558. doi:10.1287/mnsc.1040.0266
- Lei, Xue, and Cameron A. MacKenzie. 2020. “Distinguishing between Common Cause Variation and Special Cause Variation in a Manufacturing System: A Simulation of Decision Making for Different Types of Variation.” International Journal of Production Economics 220: 107446. doi:10.1016/j.ijpe.2019.07.019
- Lincoln, Yvonna S., and Egon G. Guba. 1985. Naturalistic Inquiry. Newbury Park: Sage Publications.
- Love, Peter E. D., Jim Smith, Fran Ackermann, and Zahir Irani. 2018. “The Praxis of Stupidity: An Explanation to Understand the Barriers Mitigating Rework in Construction.” Production Planning & Control 29 (13): 1112–1125. doi:10.1080/09537287.2018.1518551
- Luz, Gabriel Preuss, Guilherme Luz Tortorella, Marina Bouzon, José Garza-Reyes, and Paolo Gaiardelli. 2022. “Proposition of a Method for Stochastic Analysis of Value Streams.” Production Planning & Control 33 (8): 741–757. doi:10.1080/09537287.2020.1833377
- Mather, H. 1996. “Stabilize Demand to Maximize Return on Assets.” In APICS International Conference and Exhibition, 94–96.
- Mattsson, Stig-Arne. 1995. “Hur kan man komma tillrätta med variationer i efterfrågan?” Bättre Produktivitet 2 (1): 1–5.
- Mattsson, Stig-Arne. 2003. “Vad betyder leveranstider i förhållande till leveranstidsvariationer för säkerhetslagret?” Bättre Produktivitet 6 (1): 16–18.
- Mattsson, Stig-Arne. 2006. “Lösa problem eller leva vidare med dem?” Bättre Produktivitet 6 (1): 1–5.
- Mattsson, Stig-Arne. 2007a. “Konsekvenser av sju vanliga fel vid lagerstyrning.” In PLANs forsknings- och tillämpningskonferens, 159–178. Jönköping, Sweden: PLAN.
- Mattsson, Stig-Arne. 2007b. “Varifrån kommer alla efterfrågevariationer?” Intelligent logistik 7 (1): 38–41.
- Mattsson, Stig-Arne. 2012. “Alternativa sätt att behandla stora kundorderkvantiteter vid lagerstyrning.” In Permatron Research 1 (1): 1–10.
- Mattsson, Stig-Arne. 2017a. “Strategier för att minska osäkerhet och variationer i leveranstider och dess påverkan på kapitalbindning.” In Intern forskningsrapport från Linnéuniversitetet, Växjö, Sweden: Linnéuniversitetet.
- Mattsson, Stig-Arne. 2017b. “Strategier som påverkar efterfrågevariationer och kapitalbindning i säkerhetslager.” In PLANs forsknings-och tillämpningskonferens, 217–231. Gothenburg, Sweden, October 25–26.
- Mattsson, Stig-Arne. 2020. “Flödesegenskapers och flödesstrukturers betydelse för kötider, leveranstider och leveransprecision.” In PLANs forsknings-och tillämpningskonferens, 17–31. Stockholm, Sweden, October 21.
- Melnyk, Steven A., David R. Denzler, and Lawrence Fredendall. 1992. “Variance Control vs. Dispatching Efficiency.” Production and Inventory Management Journal 33 (3): 6–13.
- Min, Qingfei, Yangguang Lu, Zhiyong Liu, Chao Su, and Bo Wang. 2019. “Machine Learning Based Digital Twin Framework for Production Optimization in Petrochemical Industry.” International Journal of Information Management 49: 502–519. doi:10.1016/j.ijinfomgt.2019.05.020
- Modi, Kartik, Harshal Lowalekar, and N. M. K. Bhatta. 2019. “Revolutionizing Supply Chain Management the Theory of Constraints Way: A Case Study.” International Journal of Production Research 57 (11): 3335–3361. doi:10.1080/00207543.2018.1523579
- Momoh, A., R. Roy, and E. Shehab. 2010. “Challenges in Enterprise Resource Planning Implementation: State‐of‐the‐Art.” Business Process Management Journal 16 (4): 537–565. doi:10.1108/14637151011065919
- O’Neill, Peter, Amrik Sohal, and Chih Wei Teng. 2016. “Quality Management Approaches and Their Impact on Firms׳ Financial Performance – an Australian Study.” International Journal of Production Economics 171: 381–393. doi:10.1016/j.ijpe.2015.07.015
- Olson, Christopher T. 1998. “The Theory of Constraints: Application to a Service Firm.” Production and Inventory Management Journal 39 (2): 55–59.
- Pacheco, Diego Augusto de Jesus, José Antonio Valle Antunes Jr., and Celso Augusto de Matos. 2021. “The Constraints of Theory: What is the Impact of the Theory of Constraints on Operations Strategy?” International Journal of Production Economics 235: 107955. doi:10.1016/j.ijpe.2020.107955
- Palmatier, G. E. 1988. “Reducing Uncertainties in Demand.” In 31st Annual International APICS Conference, 128–132. Las Vegas, NV, USA.
- Rahman, Shams-ur. 1998. “Theory of Constraints: A Review of the Philosophy and Its Applications.” International Journal of Operations & Production Management 18 (4): 336–355. doi:10.1108/01443579810199720
- Raval, Shruti. J., Ravi Kant, and Ravi Shankar. 2018. “Lean Six Sigma Implementation: Modelling the Interaction among the Enablers.” Production Planning & Control 29 (12): 1010–1029. doi:10.1080/09537287.2018.1495773
- Samson, Danny, and Marianne Gloet. 2018. “Integrating Performance and Risk Aspects of Supply Chain Design Processes.” Production Planning & Control 29 (15): 1238–1257. doi:10.1080/09537287.2018.1520314
- Sánchez‐Rodríguez, Christóbal, and Angel Rafael Martínez‐Lorente. 2011. “Effect of IT and Quality Management on Performance.” Industrial Management & Data Systems 111 (6): 830–848. doi:10.1108/02635571111144937
- Sandvig, J. Christopher, and James. J. Allaire. 1998. “Vitalizing a Service Parts Inventory.” Production and Inventory Management Journal 39 (1): 67–71.
- Shoaib-Ul-Hasan, Sayyed, Marco Macchi, Alessandro Pozzetti, and Ruth Carrasco-Gallego. 2018. “A Routine-Based Framework Implementing Workload Control to Address Recurring Disturbances.” Production Planning and Control 29 (11): 943–957. doi:10.1080/09537287.2018.1494344
- Shurrab, Hafez, Patrik Jonsson, and Mats. I. Johansson. 2022. “A Tactical Demand-Supply Planning Framework to Manage Complexity in Engineer-to-Order Environments: Insights from an in-Depth Case Study.” Production Planning & Control 33 (5): 462–479. doi:10.1080/09537287.2020.1829147
- Sibanda, Nhlanhla, and Usha Ramanathan. 2019. “A Holistic Approach of Quality: A Case of UK Chocolate Manufacturing.” International Journal of Quality & Reliability Management 37 (5): 711–731. doi:10.1108/IJQRM-12-2018-0332
- Simangunsong, E., L. C. Hendry, and M. Stevenson. 2012. “Supply-Chain Uncertainty: A Review and Theoretical Foundation for Future Research.” International Journal of Production Research 50 (16): 4493–4523. doi:10.1080/00207543.2011.613864
- Singer, Marcos, Patricio Donoso, and Garo Konstantinidis. 2009. “Who Wants to Break the Hockey-Stick Sales Pattern in the Supply Chain?” Annals of Operations Research 169 (1): 131–147. doi:10.1007/s10479-008-0480-5
- Singh, Lakhwinder Pal, and Ravi Teja Challa. 2016. “Integrated Forecasting Using the Discrete Wavelet Theory and Artificial Intelligence Techniques to Reduce the Bullwhip Effect in a Supply Chain.” Global Journal of Flexible Systems Management 17 (2): 157–169. doi:10.1007/s40171-015-0115-z
- Slack, Nigel, and Michael Lewis. 2001. Operations Strategy. New York: Financial Times/Prentice Hall.
- Smeltzer, Larry. R, and Sue. P. Siferd. 1998. “Proactive Supply Management: The Management of Risk.” International Journal of Purchasing and Materials Management 34 (4): 38–45. doi:10.1111/j.1745-493X.1998.tb00040.x
- Swenseth, Scott. R, and Frank. P. Buffa. 1991. “Implications of Inbound Lead Time Variability for Just-in-Time Manufacturing.” International Journal of Operations & Production Management 11 (7): 37–48. doi:10.1108/EUM0000000001273
- Taylor, David. H. 2000. “Demand Amplification: Has It Got Us Beat?” International Journal of Physical Distribution & Logistics Management 30 (6): 515–533. doi:10.1108/09600030010372630
- Telles, Eduardo Santos, Daniel Pacheco Lacerda, Maria Isabel Wolf Motta Morandi, and Fabio Antonio Sartori Piran. 2020. “Drum-Buffer-Rope in an Engineering-to-Order System: An Analysis of an Aerospace Manufacturer Using Data Envelopment Analysis (DEA).” International Journal of Production Economics 222: 107500. doi:10.1016/j.ijpe.2019.09.021
- Tomlin, Brian. 2006. “On the Value of Mitigation and Contingency Strategies for Managing Supply Chain Disruption Risks.” Management Science 52 (5): 639–657. doi:10.1287/mnsc.1060.0515
- Traini, E., G. Bruno, and F. Lombardi. 2021. “Tool Condition Monitoring Framework for Predictive Maintenance: A Case Study on Milling Process.” International Journal of Production Research 59 (23): 7179–7193. doi:10.1080/00207543.2020.1836419
- Van der Hoop, H, and H.-C. Pfohl. 1996. “World Class Logistic Practices.” In Conference Proceedings, Eurolog 96, 233–242.
- van Donselaar, K. H, and B. J. Gubbels. 2002. “How to release orders in Order to Minimise System Inventory and System Nervousness?” International Journal of Production Economics 78 (3): 335–343. doi:10.1016/S0925-5273(01)00209-2
- van Kampen, Tim. J., Dirk Pieter van Donk, and Durk-Jouke van der Zee. 2010. “Safety Stock or Safety Lead Time: Coping with Unreliability in Demand and Supply.” International Journal of Production Research 48 (24): 7463–7481. doi:10.1080/00207540903348346
- Viveros, Pablo, Christopher Nikulin, Mónica López-Campos, Roberto Villalón, and Adolfo Crespo. 2018. “Resolution of Reliability Problems Based on Failure Mode Analysis: An Integrated Proposal Applied to a Mining Case Study.” Production Planning & Control 29 (15): 1225–1237. doi:10.1080/09537287.2018.1520293
- Vollmann, Thomas. E., William. L. Berry, D. Clay Whybark, and F. Robert Jacobs. 2005. Manufactuing Planning and Control Systems for Supply Chain Management. Vol. 5. New York: McGraw-Hill.
- Wikner, Joakim. 2005. “Management of Uncertainties in Supply Chains.” In Working Paper 338. Institutionen för Produktionsekonomi, Linköpings Universitet, Sweden.
- Williams, B. 1991. "Understanding Available Resource Capacity in the Manufacturing Sector." The Performance Advantage (November).
- Xu, Hongjiang, Jeretta Horn Nord, Noel Brown, and G. Daryl Nord. 2002. “Data Quality Issues in Implementing an ERP.” Industrial Management & Data Systems 102 (1): 47–58. doi:10.1108/02635570210414668
- Yin, Robert. K. 2014. Case Study Research: Design and Methods. London: Sage Publications Ltd.
Appendix 1. Most commonly applied actions in practice.