
Abstract
Organisations practicing lean effectively show operational performance improvement through various tools, including Kaizen Events. Evidence of how measurable operational performance improvement relates to specific Kaizen Event process factors is lacking though. Building upon three organisational behaviour theories, and using the six phase-based process characteristics of Kaizen Events, we first distilled nine factors that might relate to operational performance improvement. We analysed archival documentation of 79 Kaizen Events. Four Kaizen Event factors, typically applied in specific Kaizen Event phases, were significantly related to operational performance improvement: 1) in phase one, problem definition, the group is committed to solve the problem and 2) a problem indicator must be specified; 3) in phase three, idea generation, countermeasures must be quantified in relation to the problem indicator; and 4) in phase five, implementation, the line manager champions idea implementation. A conceptual model is presented to eventually obtain even more effective Kaizen Events in the future.
1. Introduction
To become more resilient, many organisations strive to continuously improve themselves. A collective continuous improvement (CI) mindset is an important condition to become such a continuously improving, lean organisation, whereby CI is also referred to with the Japanese term ‘Kaizen’ (Imai Citation1997; Suárez‐Barraza, Ramis‐Pujol, and Kerbache Citation2011; Aoki Citation2008). A Kaizen mindset is a philosophy of CI which encourages employee involvement, focuses on sustainable problem solving, and fosters a culture of respect for people (Imai Citation1997; Singh and Singh Citation2009). Whenever organisations want to truly solve problems, they apply Kaizen (Liker Citation2004; Brunet and New Citation2003). Although many forms of Kaizen exist, Kaizen Events (KEs) in particular are applied when complex organisational issues have to be solved. A KE is defined as ‘a focused and structured continuous improvement project, using a dedicated cross-functional group to address a targeted work area, to achieve specific goals in an accelerated timeframe’ (Farris et al. Citation2009, 42). KEs are regarded to be more effective in solving an organisation’s problem than other types of problem solving like intuitive problem solving (Mohaghegh and Größler Citation2020). Furthermore, KEs are deemed successful when operational performance improvement (OPI) is achieved (Negrão, Godinho Filho, and Marodin Citation2016; Helmold Citation2022), and when participants have learned (Farris et al. Citation2009). However, despite a considerable body of knowledge on KEs (Garza-Reyes et al. Citation2022; Bader et al. Citation2023), many organisations still struggle to accomplish successful KEs.
It is of utmost importance though that KEs are successful to convince management that investing in developing KE capabilities to become a continuously improving organisation is worthwhile (Galeazzo, Furlan, and Vinelli Citation2021; Netland Citation2016). Commitment, perseverance, and time and resource investment are required for developing the appropriate Kaizen mindset and accompanying skills (Netland Citation2016; Smith Citation2008; Bateman Citation2005). This commitment, perseverance, and continued time and resource investment is influenced by reports of positive KE results (Smith Citation2008), as well as seeing tangible and financial outcomes (Galeazzo, Furlan, and Vinelli Citation2021). If no OPI is achieved an organisation’s continuous operational improvement journey is likely to stall (Darragh and Campbell Citation2001; Secchi and Camuffo Citation2019). Hence, it is important to understand in much more detail what it takes to conduct successful KEs.
What we do know is that successfully executing a KE assumes that a group follows a structured problem-solving process (Liker Citation2004; Laraia, Moody, and Hall Citation1999) and achieve results that lead to OPI (Farris et al. Citation2009). In general, solving an organisational problem is indeed known as a process (Woods Citation2000). After first observing and then analysing a problem (phase 1: problem definition; and phase 2: root cause analysis), a solution must be found (phase 3: idea generation) and implementation scheduled (phase 4: plan implementation). After the solution implementation (phase 5), the final step in the process is to assess if the problem has been solved and if OPI is achieved (i.e., phase 6: check and sustain) (Woods Citation2000; Imai Citation1997; McKinsey&Company Citation2003). Indeed, for a KE to be effective and realise OPI (Farris et al. Citation2009), KE process quality needs to be high, that is, the group has to follow the six consecutive phases orderly, without phase skipping or jumping back and forward (Franken, Van Dun, and Wilderom Citation2021).
KE process quality emerges from KE group members’ individual behaviour and team collaboration (Kozlowski and Ilgen Citation2006). A KE’s process quality is also dependent on the extent to which team members are willing and eager to follow the standardised approach to problem solving. Organisational Behaviour (OB) research already revealed many insights on why individuals commit themselves to a standardised approach (Cinite and Duxbury Citation2018; Herscovitch and Meyer Citation2002; Vlaar, Van den Bosch, and Volberda Citation2006; Locke and Latham Citation2002). Known KE success factors that stem from the OB domain are: goal clarity, commitment, and management support (Farris et al. Citation2009; Antony et al. Citation2023). Those insights resulted from academic studies in which KEs were regarded as a whole. But, the role of behavioural factors in the six sequential KE phases have hardly been empirically examined (Aleu and Van Aken Citation2016). Therefore, this study sought a better understanding of how phase-based behavioural KE factors relate to achieving OPI. Hence, we took a micro perspective on the KE process, with the main research question: Which phase-based behavioural Kaizen Event factors relate to operational performance improvement?
We expected to discover new phase-based success factors for KEs by exploring the OB literature, including the small-group literature. Therefore, we started our research with perusing those areas. First, we explored commitment to change theory because KEs are geared to make operational process adjustments, which tends to require changing behaviours and tasks (Ajzen Citation1991; Bortolotti, Boscari, and Danese Citation2015). Secondly, goal setting theory was explored (Locke and Latham Citation2002; Klein et al. Citation2001), because organisational improvement through KEs start with situations in which organisational goals are not met and KE groups are assigned to help achieve them (Bellisario and Pavlov Citation2018; Schmidt Citation2019). Finally, sensemaking theory was explored, as people tend to reject change such as process improvements when they do not believe that an intended change does make sense for the organisation (Kotter and Schlesinger Citation1979) and because continuous process improvement will only be sustained and lead to OPI when it makes sense to the participants (Malik and Abdallah Citation2020; Farris et al. Citation2009). After exploring these bodies of literature, we combined the results and examined them, using archival databases, as plausible process factors for achieving OPI in KE settings.
The results of our two consecutive studies led to a better understanding of which behavioural KE process factors related to specific KE phases are associated with achieving OPI. When KE practitioners apply our findings to their KE group processes OPIs may be expected more frequently, undoubtedly leading to leaders’ (continued) belief in lean and specifically kaizen as a vital means to become a more learning and resilient organisation (Ruiz-Benítez, López, and Real Citation2018; Dahlgaard and Anninos Citation2022; Suárez-Barraza, Rodríguez González, and Miguel Dávila Citation2018).
2. Literature review
2.1. Kaizen Events as part of the Kaizen philosophy
A Kaizen mindset is a philosophy of CI (Imai Citation1997; Singh and Singh Citation2009; Hosono Citation2020), which can be applied in different forms. For instance, Kaizen can appear in variations like: Kaizen Kata (Rother Citation2019; Suárez-Barraza, Miguel-Dávila, and Morales-Contreras Citation2021), Kaizen Blitz (Laraia, Moody, and Hall Citation1999), Kaizen Events (KEs) (Glover, Farris, and Van Aken Citation2014; Liker Citation2004), and Kaikaku (Imai Citation1997; Womack and Jones Citation1996). These Kaizen variations have in common that they are being performed by a group of within-organisational experts, and that the group follows a standardised plan-do-check-adjust process. As displayed in , the Kaizen variations differ slightly in focus (ranging from quickly addressing specific issues to more radical changes), scope (from well-defined problems to innovations), duration (from just a few minutes to multiple weeks or even months), and approach (the way of working applied). Whereas all variations contribute to the continuous improvement of organisational performance, the adoption of KEs in organisations is a widespread phenomenon on which we focus our attention in light of this study.
Table 1. Overview of differences in various Kaizen instruments.
2.2. Effective Kaizen Event processes
Much of the literature elucidates the different phases during effective KE processes. Although variations exist, a KE process tends to follow six consecutive phases: 1) problem definition; 2) root cause analysis; 3) generate ideas; 4) plan implementation; 5) implement; and 6) check and sustain (Franken, Van Dun, and Wilderom Citation2021; Woods Citation2000). With respect to achieving the desired OPI, these phases have a clear logic. For example, if you do not start, the current problematic situation may remain the same, and without a proper analysis of the root causes behind the problem, the solutions risks being merely superficial or cosmetic. If you do not analyse why the problem occurs and not decide on a countermeasure, the solution risks to be merely superficial or cosmetic.
This six-phases model was revealed by Woods (Citation2000) to be inherent to most structured problem-solving approaches, after comparing 150 different strategies for structured problem solving. Differences between those strategies often relate to specific needs of the type of organisation in which they are applied. For example, the process industry tends to rely on the phases of Define, Measure, Analyse, Implement, and Control (DMAIC) (De Mast and Lokkerbol Citation2012); in this industry solutions often involve adjusting machine settings, meaning that human resistance might be low such that a separated ‘plan implementation’ phase is not needed and is integrated in the implementation phase (De Mast and Lokkerbol Citation2012). Another example is McKinsey’s expansion of the DMAIC cycle to DMAGIC by adding the G (‘generate ideas’) in order to emphasise the importance of this activity in structured problem solving. Based on those considerations, we used the previously mentioned six-phases KE approach in our study.
Such a KE process is effective when it has the ability to achieve its intended goals, efficiently, accurately, and consistently (Hackman and Morris Citation1975). This implies that the KE group has the capability to accurately execute the standardised process in such a way that the problem, the intended goal, is solved (Liker Citation2004). Franken, Van Dun, and Wilderom (Citation2021) describe effective high-quality KE processes as 1) processes in which the group follows the standardised sequential phases orderly, without phase skipping; 2) where groups decide on phase results consensually, before explicitly moving to its next phase; and 3) where KE groups reflect on and learn from their performed process quality. A KE process is ineffective when the process is chaotic, i.e. when the KE group jumps back and forth between the intended sequential phases, without reaching consensus on achieved results for each phase (Franken, Van Dun, and Wilderom Citation2021). Consequences of ineffective KE processes are that it takes the KE group more time to implement the solution (Liker Citation2004), that symptoms instead of root causes are being solved (Tucker, Edmondson, and Spear Citation2002), or, even worse, that that nothing is solved at all (Antony and Gupta Citation2019).
2.3. Commitment to change
Solving an organisational problem requires changing a situation into a desired one. However, as long as the status quo is not seen as undesirable, most employees do not think the change is needed (Locke and Latham Citation2002; Fournier et al. Citation2023). ‘Commitment is a force that binds an individual to a course of action of relevance to a target’ (Meyer and Herscovitch Citation2001, 299). People’s commitment to change consists of three forms (Herscovitch and Meyer Citation2002): continuance commitment, normative commitment, and affective commitment. Continuance commitment (‘It could be costly to me if I do not achieve this goal’) and normative commitment (‘I owe it to this organisation to do my best to achieve this goal’) relate to an individual’s perceived relation with the organisation. Affective commitment (‘Achieving this goal is as important to me as it is to the organisation’) relates to solving a specific problem and realising a goal. All three forms of commitment have been correlated with positive organisational outcomes, but only affective commitment is strongly linked to a willingness to go beyond the boundaries of traditional production tasks and to participate in activities such as a KE-based improvement project (Angelis et al. Citation2011). During a KE, solving the problem might present as difficult and requires persistence of the KE group. In such situations, especially affective commitment to solve the problem and achieve the pre-defined target will motivate the team to continue to solve the problem and gain benefits together with OPI (Meyer and Herscovitch Citation2001). When team members are committed to solving the problem, they will avoid behaviour related to procrastination (Gagnon, Dionne, and Pychyl Citation2016) like postponing meetings; not making time to schedule the next meeting on a short notice; shoot down ideas in the brainstorm phase; reject a structured problem-solving process approach, etc. As a result of lacking problem-solving commitment, both the quality of the KE process and the amount of OPI will be low (Franken, Van Dun, and Wilderom Citation2021).
Commitment to change is a known success factor of KEs (Farris et al. Citation2009). Achieving such commitment to change is a dynamic mental process in which individuals start to first become aware of a problem, followed by acceptance of the problem and then commitment to solve it (Jaros Citation2010). Therefore, based on the commitment to change literature, we can reformulate a first set of KE process factors: KE groups should not only be aware of the problem (see, , factor 1), but they should be committed to solve it as well (, factor 2).
Table 2. Possible Kaizen Event process factors related to Kaizen Event goal achievement.
Supportive behaviour from lean leaders (Van Dun, Hicks, and Wilderom Citation2017) and employees’ trust in line management is important for accepting any change (Gigliotti et al. Citation2019; Lüscher and Lewis Citation2008). A key element of this supportive managerial behaviour is their expressions of a sense of urgency, managers must convince KE groups that their effort will be valued. Employees get convinced about their leaders’ sense of urgency through the behaviour of their leaders (Van Dun and Wilderom Citation2021). For example, involvement of management in kick-off meetings or progress presentations, and managers freeing up KE resources, could convince employees of their managers’ commitment to the KE process as well as to the suggested change (Bateman Citation2005). So, line management should be creating a sense of urgency for solving a particular problem through KE (, factor 3).
A fourth type of commitment needed for a successful KE process, is commitment of the line managers for the countermeasures suggested by the KE group (Bartunek et al. Citation2006). The effectiveness of a solution is known to depend on the quality of the solution as well as on the level of acceptance of the solution. Whereas change is often represented as an issue of leadership (Thurlow and Mills Citation2009), a KE group of non-managerial employees has the autonomy to suggests a solution to be implemented in a department (Bortolotti et al. Citation2018). The responsible line manager might have not been involved in the selection of the countermeasure. This means the line manager has to accept an organisational change indicated by others (Bartunek et al. Citation2006). The leader should then show trust in the KE group and become committed to the suggested change while supporting the KE groups when implementing the change (Imai Citation1997; Farris et al. Citation2009). For the employees to implement the selected solution it is thus important that the direct supervisor is in favour of the change (Gigliotti et al. Citation2019; Oreg, Vakola, and Armenakis Citation2011). The supervisor’s behaviour should be congruent with his/her oral support to the change by championing the implementation of the suggested idea (Oreg, Vakola, and Armenakis Citation2011). This latter point can then be added to the list of possible commitment to change type KE process factors (, factor 4).
For a KE team to realise the improvement, motivation is another aspect of commitment to change. Motivation is associated with affective commitment to change, and is strengthened by both tangible and intangible rewards (Kerrin and Oliver Citation2002). Previous lean studies have emphasised the importance of intangible rewards in creating a continuously improving organisation. For instance, it was found that effective lean leaders listen to their employees (Van Dun, Hicks, and Wilderom Citation2017). Linked with the fact that such listening activates the reward system (Kawamichi et al. Citation2015) and that respectful inquiry by managers motivates employees to perform (Van Quaquebeke and Felps Citation2018), the fifth factor taken into account in our research is therefore the interest that management shows in the KE results, for instance by having a meeting with the KE team to discuss the learnings and KE improvement results (, factor 5).
2.4. Goal setting
In goal setting theory, a goal is defined as a desired end result of an action that is expected to be achieved at a specified time in the future (Ogbeiwi Citation2017; Locke and Latham Citation2002). The goal setting theory purports that if clearly defined, challenging goals are set at the start, they will give direction and energy, drive persistence, and create a context in which creative solutions can be developed (Locke and Latham Citation2002). Farris et al. (Citation2009) noted goal clarity as an important precondition to starting a KE. The term ‘goal clarity’, however, is still open to multiple interpretations especially in regard to the level of specificness (Vlaar, Van den Bosch, and Volberda Citation2006). A goal should be made very specific to create motivation and endurance (Vlaar, Van den Bosch, and Volberda Citation2006; Locke and Latham Citation2002). A specific, challenging, and clearly-phrased goal is assumed to indirectly predict goal attainment (Ogbeiwi Citation2017; Vlaar, Van den Bosch, and Volberda Citation2006). Hence, effective goals are known to be specific, measurable, assigned, realistic, and timed (SMART) (Ogbeiwi Citation2017). Thus, to increase the chances of goal achievement, it is essential to specify the desired outcome, with a measurable indicator, an attainable target, and a realistic timeframe (Ogbeiwi Citation2017).
A group becomes and stays motivated by the belief that they can attain the goal (Locke and Latham Citation2002). In the context of KEs, Garza-Reyes et al. (Citation2022) concluded that one of the main reasons managers decide not to implement KEs in an organisation is when performance measurement is lacking. To be able to measure problem-solving performance, i.e., whether the goal was achieved, a clearly set indicator related to the focal difficult problem is needed (Garza-Reyes et al. Citation2022). In order to motivate the KE group to start solving the complex problem, in the early stage of a KE, such a clearly specified problem indicator, i.e., a quantitative measure thereof, must express the potential impact of the problem for the organisation. This includes typically a form of measurement of the current situation (Locke and Latham Citation2002). Goal setting theory also states that the goal-performance relationship is strongest when people are committed to their challenging goal and believe that they can attain that goal (Locke and Latham Citation2002). So, in order to create a high-performing KE group, we argue that the problem indicator should be specified in the first KE phase, including a specific quantified target (, factors 6 and 7).
2.5. Sensemaking
Similar to the goal setting theory, the sensemaking theory (Malik and Abdallah Citation2020) states that explicitly formalising a goal in a group allows the participants to keep their focus on it. Hence, a specified goal clarifies why decisions must be made, supports decision making (Brown, Colville, and Pye Citation2015), and prevents participants from being distracted (Vlaar, Van den Bosch, and Volberda Citation2006). A KE group in particular does challenge its members by its task to identify the problem’s root causes (Liker Citation2004), including a clear indicator through which its ultimate impact can be determined. Without the availability of a specific problem indicator during the root-cause analysis phase, a KE group would not be able to determine its root-cause impact or show to have selected the right root causes to be solved (Liker Citation2004; Malik and Abdallah Citation2020). So, sensemaking theory is also in support of the previously identified factor 6, the problem indicator should be specified in the first KE phase ().
To decide which root cause needs to be solved first, one must be able to measure and weigh the impact of the root cause on the perceived problem. To do so, a root cause must be quantified in relation to the problem indicator (Moreira and Tjahjono Citation2016) (, factor 8). This is because for all stakeholders of the KE it should make sense that solving that particular root cause is worth the effort (Brown, Colville, and Pye Citation2015).
Furthermore, if the people in a KE group are allowed to implement their proposed change, they are kept motivated, particularly also after they understand how much an element of their countermeasure might contribute to solving a specific root cause of the problem (Lüscher and Lewis Citation2008; Locke and Latham Citation2002). Ideally, a countermeasure for a problem’s root cause must be quantified in relation to the specific problem indicator, including its expected impact on the root cause and overall problem. This quantification is not only relevant for the KE group members, but also for the involved line managers. As line management is responsible for freeing up the resources for the KE process and the subsequent change, they have to be convinced that the time and financial investments make sense (Malik and Abdallah Citation2020) and that the operational problem is important enough to be solved. Knowing that leaders tend to find it hard to support ideas suggested by others than those by themselves (Bartunek et al. Citation2006; Lüscher and Lewis Citation2008), the implementation plan should also include an objective forecast of the extent to which the suggested countermeasures will solve the core problem. Therefore, the expected impact of a countermeasure should be calculated against the pre-defined problem indicator (, factor 9).
The first empirical study reported below explores which of the nine process factors, listed in and stemming from the commitment to change, goal setting, and sensemaking theories, might relate to the KE goal achievement and objective OPIs created by KEs. At the end of Study 1, factors are selected for further examination with a larger sample of archival KE documentation in Study 2.
3. Overall research design
We chose an explorative approach using a qualitative method (Blumberg, Cooper, and Schindler Citation2011) As OPIs result from finalising the full KE cycle, which may take multiple weeks (Choo Citation2014), we looked for opportunities to study finished KEs. To avoid lengthy timeframes, using well-documented archival data on finished KEs is a valid approach (Das, Jain, and Mishra Citation2018). In the present study, we therefore followed the archival study template of Kessler and Shoss (Citation2022) which states: 1) articulate a key research question and hunches, based on relevant areas of the literature; 2) search for and select a valid dataset; and 3) select variables to include in the study.
We had the opportunity to use two KE archives (Fisher and Chaffee Citation2018). Each archive was owned by a different senior KE facilitator. Both archives had the following similar characteristics: 1) KE data was collected for benefit tracking and learning purposes; 2) each KE was performed in a real-life business situation where the focal organisation tried to solve a persistent problem; 3) employees of each organisation were asked to solve the problem using a KE approach; and 4) the archive owners were involved in all KEs as the senior facilitator. The first archive, used in Study 1, containing the documentation of 10 KEs, was obtained by the first author, a Dutch female PhD student and lean program manager within a Dutch university, who has 20 years of lean consultancy and KE facilitation experience. This archive consisted of over 300 KE related documents, which included the achieved performance outcome for each KE. The second archive was owned by a Dutch lean consultant with over 20 years of international lean implementation experience. This archive contained in total 207 documents, including the final KE reports of 69 performed KEs, from 44 different organisations located in 9 different countries, gathered over the last 15 years. This second archive was used in Study 2.
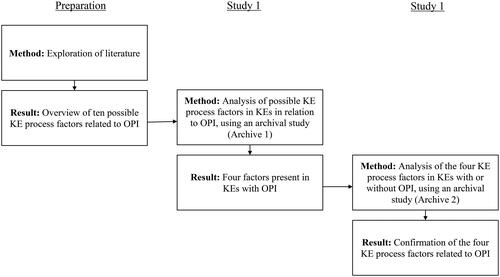
An overview of the entire research is presented in . Before the start of Study 1, we explored the literature from the goal setting, sensemaking, and commitment to change theories for factors (variables) which we then examined in the archives (Kessler and Shoss Citation2022). In Study 1 we explored the presence of those possibly conditional factors of effective KEs in the first archive. In Study 2 we examined whether the factors identified in Study 1 were present in another archive consisting of the documentation of successful and non-successful KEs. In both consecutive studies we sought for relations between OPI achieved in each KE and behavioural, phase-based facilitating factors.
Figure 1. Overview of the research design.
4. Study 1: methods and results
4.1. Research design Study 1
In this first study, the archive enabled a retrospective longitudinal design (Kessler and Shoss Citation2022) because enough data was available to reconstruct the time lines of the KEs. Hence, a retrospective longitudinal design was chosen to study the available archival documentation of ten KE processes and their objective OPI. The archive was started by the first author (JF) in 2006 and grew over the last 15 years. This author (JF) conducted the role of KE facilitator in all of the KEs present in this first archive. Retrospective analysis of all documents was conducted, thereby reconstructing a timeline for each KE process. Next, the KEs were coded for the existence of the nine literature-based factors () and the level of OPI achieved. After analysing these data, the second author (DvD), also an experienced KE facilitator, conducted an interview with the first author. During this interview, the first author reflected on the KE processes to gather a broader understanding of the impact of the presence or absence of the focal KE process factors. The second author also challenged the first author’s data analysis to double check the comprehensiveness of the database and to ensure analytical objectivity.
4.2. Sampling and sample description
The ten KEs were selected based on the following two criteria: 1) there was ample documentation available to reconstruct the KE’s timeline (such as kick-off session presentations and workshop results); and 2) the objective performance improvement outcomes were well documented. The documents in this archive were produced mainly by the KE participants and stakeholders. Examples are: training materials; progress reports; workshop programs; and workshop results. presents the characteristics of the ten KEs. The KEs were held in five different large Dutch organisations, being two for-profit and three non-profit organisations, which were all familiar with lean but in different stages of lean maturity (Netland Citation2016).
Table 3. Overview of the Kaizen Events analysed in Study 1.
4.3. Data collection and analysis
The KEs were initially categorised based on the operational performance improvement (OPI) achieved at the end: When a KE achieved a positive impact on objective performance, e.g., the amount of production-cost reduction or throughput-time reduction, it received a score of 1. Zero points were given to a KE that had not resulted in any OPI. The KEs were scored based on available archival evidence of OPI, like financial reports or reported lead time reduction graphs.
The nine KE process factors () were operationalised as presented in and identified in the documents. Hence, we content analysed each document to determine the existence of these nine factors in each KE. We scored a + when a factor was in place; and - when no written evidence for the process factor could be found. After coding, the first author and the second author discussed each KE analysis one-by-one, including the question: Which factors might have influenced the OPI achieved through this particular KE process? This analysis of the KE process factors aimed to explore accomplished literature-based KE process factors ().
Table 4. Overview of Kaizen Event process factors.
4.4. Findings Study 1
The coding results of each factor for each of the 10 KEs are presented in . It shows that 6 of the 10 KEs achieved OPI. During their process we were able to score the presence of at least seven of the nine process factors. KEs with a weak or lacking problem-solving commitment of the KE group achieved no OPI. KE 8, for instance, clearly exemplifies a lack of group problem-solving commitment which co-occurred with no substantial OPI. The facilitator and first author (JF) recalled that the group members were urged by their supervisors to attend the workshop but that the group, during the workshop, repeatedly questioned the value of the KE approach. In addition, although the KE participants were aware of the problematic situation, they did not show any eagerness to resolve it. In another KE group, KE 6, it was not possible to schedule a new KE appointment within four weeks. The KE facilitator recalled: ‘We had to end this KE and discuss a new approach, as the group resisted to schedule a follow up session’. The KE group wrote in their evaluation statement that they saw the KE approach as ‘inappropriate for this problem’. In KEs with evidence of high KE group problem-solving commitment, participants finalised their actions on time, e.g., a root cause analysis of specific topics was executed before their next weekly KE meeting.
Table 5. Factors present in the Kaizen Event archival documentation.
KE groups without line manager involvement (as was the case with KE # 3, 6, and 8) did not realise any OPI. In contrast, the archive of KE 1 documented an explicit discussion about who was in the lead during the implementation phase. The facilitator recalled that in this KE, which created a €700,000 OPI, the line manager had strongly pleaded to be the project lead of the implementation phase, taking accountability for realising the improvement and for updating the higher management about the KE’s progress and results. Also in other cases, we identified that the line manager championing idea implementation is a factor related to OPI. If a consultant felt responsible to implement the envisaged change but not the KE group or line manager (like in KE 3, 6, and 8), then the desired performance improvement appeared stifled.
We noted that all KEs that achieved their goal and realised OPI, had specified a problem indicator at the start of their KE. Where some KEs started with a clearly specified indicator as input for the KE, like €50k needed cost-reduction or reduction of waste hours with 50%, other successful KEs defined their KE problem indicator during the first KE phase of problem definition. During the interview, the KE facilitator (JF) acknowledged that, indeed, at the end of a KE where there was no identified problem indicator, then no success was celebrated as the impact could not be measured. She even recalled the negative emotions that resulted, because the team had worked hard to improve, but no one in the organisation seemed to value the changes made. This was demotivating for the KE group, and the group fell apart, eventually.
Last, a difference was found between those KEs in which countermeasures were quantified against the available problem indicator. During the discussion after coding all the KEs, the facilitator (JF) emphasised that a specified problem indicator enables KE groups to start solving a problem. However, the groups and the management also need some estimation of the impact of a countermeasure on OPI. A quantification indicating how much of the problem will be solved after implementing the suggested countermeasure motivates management to free up resources to implement the solution. Celebrating the improvement and receiving compliments from line managers was also recalled as being very motivating for each KE group.
Thus, based on Study 1, we argue that the KE process factors 2, 4, 6, and 9 (in bold in ) are especially associated with OPI or KE goal achievement. Hence, in Study 2 these four process factors are further examined with a larger, different sample of archived KEs.
5. Study 2: methods and results
5.1. Research design
In the second study, we cross-validated the four derived process factors associated with OPI derived from Study 1. We used mixed methods, which fits our ‘which’-type research question (Edmondson and McManus Citation2007). The dataset included another, larger KE sample. It consists of an archive containing 69 final A3s from 34 different international organisations, which were operating in different sectors, like fast-moving consumer goods, food production, and machine building. A3 reports tend to be used to communicate the KE phases and final results (Shook Citation2008; Liker Citation2004); they update all stakeholders about the particular KE process and their outcomes. An A3’s structure is fairly standardised (Shook Citation2008); the results of each KE phase (Franken, Van Dun, and Wilderom Citation2021) are put on this one A3 (tabloid-sized) page, although its page has a relatively free format. The A3s of each finished KE contains evidence of the KE process as well as the OPI. All organisations in which the KEs were held used the A3 instrument as a way to communicate their process and results.
Moreover, the facilitator who created this rich archive, a very experienced lean consultant with over 20 years of international lean implementation experience, was interviewed three times throughout our research. We interviewed him: 1) when we started coding the A3s, we jointly coded the first 10 A3s (120 minutes); 2) after coding all A3s we contacted the facilitator for a semi-structured interview to discuss if our interpretation of the A3s was correct (90 minutes); and 3) in another semi-structured interview we presented the findings after analysing all the coded A3s and asked him to elaborate on our findings (60 minutes).
5.2. Sampling and sample description
On perusing all the available, 207 original KE files that were labelled as A3s, we selected only those A3s that were fully complete and reported the KE outcome. More precisely, we removed A3s with only pictures and/or drawings (-41); preliminary/unfinished or merely conceptual A3s (-11); KE project proposals that lacked execution (-11); mere KE result presentations (-10); or A3s that only covered the implementation phase (-7). Ten A3s were more strategic and described larger programs in which multiple KEs had been initiated; these ten were also excluded from this sample because we intended to study the processes and outcomes of single KEs. This led to a final sample of 69 A3s for further analysis in terms of the earlier distilled four effective KE process factors.
5.3. Data collection
Two methods were used: First, the available A3s were coded in terms of OPI, as well as the presence of the four factors. Second, the facilitator was interviewed to collect a more qualitative understanding of our findings.
5.3.1. Analysis of the archival documentation
The four KE process factors that were derived from Study 1 (in bold in ) were operationalised with a slightly elaborated version of the coding scheme used in Study 1, as shown in . When present, the process factor received one point; when not present, the factor received zero points. When the information was incomplete (e.g., a problem indicator was mentioned but not specified), the factor was left blank in our database. The first ten A3’s were coded together with the facilitator during a two-hour session, to better understand how to read the A3s. The other 59 A3s were independently coded by the first author. To finalise and validate the coding, the results of the coding of each A3 was discussed with the facilitator (90-minute interview). In the below, we situate each of these four factors within disparate theoretical domains.
Table 6. A3 coding scheme of the core Kaizen Event process factors.
5.3.1.1. KE group problem-solving commitment
The theory of planned behaviour (Ajzen Citation1991) states that action results from an intention, which, in turn, is influenced by motivational factors such as social norms that identify how strongly people are committed to the change. So, to operationalise KE group problem-solving commitment we looked for planned action items and whether a participant was mentioned by name (not by role) to be the action holder. Furthermore, the inclusion of a KE group picture was seen as the group being committed to solving the problem because a picture is highly visible to others and expresses the group members’ eagerness to be associated with each other in relation to the problem to be resolved (Salancik Citation1977).
5.3.1.2. Line manager champions idea implementation
Formal communication is a way to achieve people’s commitment to change (Bouckenooghe Citation2012). A3s tend to be used as a formal communication instrument to share results of KE groups within the organisation. Thus, being mentioned by name on an A3 creates visibility and indicates that line management is involved (Salancik Citation1977). In addition, it expresses management’s trust in the outcomes (Bouckenooghe Citation2012). Thus, line managers being mentioned by name or being one of the individuals responsible for any follow-up action is a proxy for a line manager’ championing the implementation of the idea.
5.3.1.3. A problem indicator is specified in the first KE phase
This factor is operationalised by the reporting of a problem indicator in the first section of the A3, either in written form or graphically (Locke and Latham Citation2002; Ogbeiwi Citation2017).
5.3.1.4. The countermeasures are quantified in relation to the problem indicator
Evidence for this factor is found when the expected impact of a certain countermeasure is reported, or specifically pointed out in the analysis of the current situation. For example, when a value stream map is part of the A3, a complete drawing typically indicates the expected impact of implementing the specific countermeasure (Rother and Shook Citation2003).
5.3.1.5. Operational performance improvement (OPI)
Achieved OPI was operationalised as positive technical results that were clearly visible on the A3 or when achieved results were mentioned in an overall organisational (A3) report: e.g., a graph showing the reduction of the throughput time or ‘a reduction of inventory with 6.3 days’.
5.3.2. Interview with the KE facilitator
In a final semi-structured interview (30 minutes), the KE facilitator was asked to react on the integrated findings, based on his personal experiences. First, the overall findings of the A3 coding were shared with the facilitator (30 minutes). Next, the facilitator was asked to elaborate on those findings, starting the interview with the broad question ‘Looking at those outcomes, what stands out for you’. Furthermore, the facilitator was asked to reflect on each of the four KE process factors in relation to OPI. This final interview was audio-taped and transcribed.
5.4. Additional data analysis
After verification with the facilitator that the coding of the A3s was valid, the zero-order correlations among the variables were calculated. The data of both the independent and dependent variables were categorical in nature (yes/no), so the Pearson Chi-square test was used to explore the relationship between the four process factors and OPI, combined with a Cramérs V analysis to assess the strength of the association (Blumberg, Cooper, and Schindler Citation2011). Using a Mann-Whitney U analysis, we compared and analysed the difference between the number of KE process factors present in KEs with or without OPI.
To corroborate the findings, we also analysed (anonymized) anecdotal evidence from the A3 documents. On top of the quantitative analyses, we therefore also offer examples in the A3s of the process factors in relation to OPI.
Finally, the semi-structured interview was content analysed deductively. For each of the four process factors we looked for the facilitator’s remarks, to either support or refute the findings we derived from the quantitative data. This qualitative data was used to better understand the impact of our findings on KE process quality and achieving OPI.
5.5. Findings Study 2
5.5.1. Statistical analysis
shows significant correlations between the four KE process variables and the dependent variable OPI. All variables significantly correlated with each other.
Table 7. The four kaizen event process factors correlated with operational performance improvement..
is divided into the two OPI categories (No/Yes) and depicts the number of KEs in which the KE process factors were present. The chi-square test of independence showed there was a significant relationship between OPI and KE group problem-solving commitment: X2 (1, N = 65) = 20.53, p < .001, with Cramér’s V = .56, denoting a significant association.
Table 8. Factors present in the analysed A3s.
Furthermore, the data analysis showed that to achieve OPI, line management must champion the implementation of ideas to achieve OPI: X2 (1, N = 65) = 33.11, p < .001, with another significant association: Cramér’s V = .75.
Moreover, OPI was achieved also when a specified problem indicator was set in an early phase: X2 (1, N = 68) = 47.80, p < .001, showing a 3rd significant association: Cramér’s, V = .84.
OPI due to the KE process was noted also when a countermeasure had been quantified in relation to the problem indicator: X2 (1, N = 68) = 42.80, p < .001, with a significant association: Cramér’s V = .79.
Finally, when analysing the differences between the number of KE process factors present related to OPI, it appeared that the 22 KEs without OPI had an average of 1.17 factors present, whereas the 47 KEs with OPI had an average of 3.59 factors present. The independent Mann-Whitney U test showed a significant difference between these two OPI categories (p < .001). Furthermore, this finding lends support for the core idea of this paper that the four selected KE process factors might indeed be related to achieving OPI.
5.5.2. Anecdotal evidence
In support of our quantitative findings, we now illustrate briefly how effective KE processes were depicted in the dataset. We will highlight how the four KE process factors had been made visible on three different A3s. Firstly, one of the analysed A3s reported a cost saving of over €1.5 million and almost a 25% reduction of throughput time (minus 6 days on a total of 25 days). KE group problem solving commitment was clear through a picture of the group in front of their value stream map analysis, including line managers. Furthermore, a clear problem indicator was identified upfront, namely a reduction of costs in the entire supply chain. Also, the KE group identified root causes and specified the possible countermeasures related to this problem indicator; the A3 showed that the proposed reduction of pallets used was expected to lead to an improvement of €2,60 per pallet. In the action plan, action holders including line managers, were mentioned by name, which is a sign of line managers’ championing of idea implementation. In sum, all four KE process factors were present in this successful KE.
Another A3 reported a machine change-over time reduction from 97 minutes to less than 40 minutes. This reduction was part of the overall KE goal to improve machine uptime from 59% to 80%, a sign of a clearly specified problem indicator. Illustrating the KE group’s commitment to solving the problem, the A3 contained a team picture and the names of the group members, including line management, in the implementation plan. The fact that line management was visibly present, also showcases their championing of idea implementation. Finally, in the KE group’s current-state analysis, a detailed value stream map was made based on video footage. A value stream map of the future state showed the proposed improvements and their quantified impact on the total change-over time. Thus, also in this successful KE, all four KE process factors were visibly present.
To contrast the previous anecdotal evidence, we also analysed a non-productive A3 in which no KE results were reported at all. Although we found evidence of the KE group’s (initial) commitment to solving the problem, given that we found the names of the team members on the A3, evidence for the other three factors were lacking. For example, only a very generic problem indicator was mentioned, namely: ‘to become the most effective production plant’. Moreover, although the current situation was described on the A3, only recommended improvements were mentioned, without any quantified countermeasures. Hence, in this non-productive KE only one of the four KE process factors was identified from the A3 report. Altogether, the anecdotal evidence corroborates the findings derived from the statistical analyses.
5.5.3. Validation of the results – interviews with the facilitator
Finally, we validated the results with the interviews conducted with the facilitator. The facilitator stated that for organisations to perceive a KE as being successful, a real problem of the organisation should be solved, and a positive operational performance impact has to be made. He mentioned: ‘Without any hard results, management will no longer invest in KEs’. He also stressed the importance of a group’s knowledge on how to effectively perform a KE but admitted that the groups were purely constructed based on people’s technical knowledge deemed necessary to solve the problem instead. As will be elaborated below, he also reflected on the four identified KE process factors.
5.5.3.1. KE group problem-solving commitment
The facilitator recognised the importance of group problem-solving commitment for OPI: ‘When team members do not attend meetings, postpone session, do not deliver actions, or when it is hard to schedule a next meeting, for me those behaviour are symptoms of non-commitment. It kills a KE’. In his opinion, when KE group members participate in the KE kick-off session, and the problem is explained based on fact and figures, awareness is easily achieved. However, for the group members to really start contributing to solving the problem requires commitment and a smooth process.
5.5.3.2. Line manager champions idea implementation
I even forget to mention’ that line management should champion the change:. He explained that in large KEs it is obviously important that management supports to start a KE, as they have to free up the resources. However, when it comes to implementation, individual managers sometimes find it hard to accept a change as suggested by the (autonomous) KE team. He called it the ‘not invented here’ syndrome.
5.5.3.3. A problem indicator is specified in the first KE phase
From his perspective, whenever a problem is too vaguely formulated, it becomes hard to improve. A KE team has to know what they have to improve, but also the management team must have a clear focus and must determine which performance indicators should improve. The importance of OPI and reporting the result of KE to management was stressed, as, according to the facilitator, ‘they [the management] have to know what has been achieved’.
5.5.3.4. The countermeasures are quantified in relation to the problem indicator
According to the facilitator, understanding the impact of a countermeasure, enables a group ‘to stay motivated as you know precisely what you are improving’. Hence, starting small with a specific topic is often a better approach than starting with a large overarching A3. At the end of the interview, the facilitator confirmed the need of a clearly specified problem indicator. For him, this related to the advice to start small
Overall, the facilitator confirmed the importance of the four identified KE process factors. Moreover, he noted that these outcomes also raised his consciousness on which KE factors are crucial to deliver OPI. In fact, he expected that incorporating those findings into the training of KE participants and KE facilitators will increase the chance that a KE will deliver OPI.
6. Discussion
Increased operational performance tends to convince management to continue investing in refining organisation’s CI and complex problem-solving skills (Netland Citation2016; Suárez‐Barraza, Ramis‐Pujol, and Kerbache Citation2011). Hence, it is worthwhile to better understand the KE process in conjunction with OPI. Most KE researchers have analysed KEs based on the event as a whole (Aleu and Van Aken Citation2016). While this relatively broad scope has led to valuable insights, practitioners still struggle with achieving OPI through KEs (Bortolotti, Boscari, and Danese Citation2015; Garza-Reyes et al. Citation2022). Therefore, our study contributes to a better understanding by focusing on the various phases in KEs’ structured problem-solving process (Liker Citation2004; Laraia, Moody, and Hall Citation1999; Woods Citation2000) and by exploring which behavioural, phase-specific process factors relate to subsequent OPI. Based on the commitment to change, goal setting, and sensemaking theories, we first identified behavioural factors that facilitate OPI. The two consecutive archival studies point to four specific KE factors, linked to specific KE phases, that are proposed to be related to high OPI: 1) in phase one, the group is committed to solve the problem; 2) also in phase one, a problem indicator must be specified; 3) in phase three, idea generation, countermeasures must be quantified in relation to the problem indicator; and 4) in phase five, implementation, the line manager champions idea implementation. The fine-grained findings identify the value of the three earlier-mentioned OB theories in successful KEs, as will be elaborated below, in the theoretical implications.
6.1. Theoretical implications
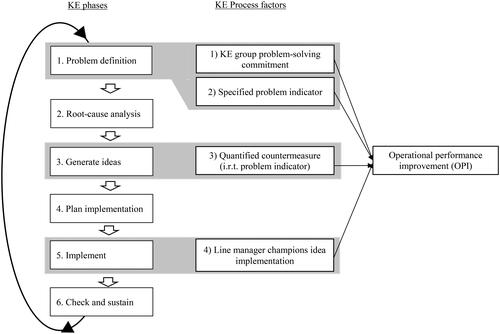
The findings of two consecutive archival studies led us to draw a conceptual model on how specific behavioural factors relate to achieving a KE’s OPI; each of the identified factors are related to a specific KE phase in which they must be applied ().
Figure 2. Conceptual model of Kaizen Event process factors in relation to operational performance improvement, mapped onto the Kaizen Event phases.
First, to realise OPI, we found that, in line with the commitment to change theory, it is important that KE participants commit themselves to identifying and solving the problem. This is because participants will only contribute to solving the problem when they accept the need for improvement (Lüscher and Lewis Citation2008) and when they know their effort is supported by management (Meyer and Herscovitch Citation2001; Gigliotti et al. Citation2019). Also based on the commitment to change theory, line management must be intent on championing the implementation of the solution, as another key to a successful KE process (Lüscher and Lewis Citation2008). This can be explained by the autonomy for change a KE team typically has, and the needed acceptance of that change by management even though management is not involved in a KE process of finding a solution (Bartunek et al. Citation2006).
Second, goal setting theory offers relevant explanations on why goal specificness is a key process factor for an effective KE. This theory led us to identify the need of a precise and measurable specification of a problem in the first phase of a KE, to motivate the KE group and aid in achieving measurable performance improvement (Locke and Latham Citation2002; Ogbeiwi Citation2017). Without specific goals, KE groups might lose focus and persistence (Locke and Latham Citation2002) or cannot decide and prioritise on countermeasures (Vlaar, Van den Bosch, and Volberda Citation2006). Likewise, their managers might lose attention as without clear goals the progress on OPI (i.e., through credible performance measurements) cannot be precisely tracked and reported (Smith Citation2008; Garza-Reyes et al. Citation2022).
Third, the sensemaking theory specifies that to be able to select and prioritise countermeasures and remain motivated for a change, the countermeasures should make sense to both the KE group members and the line managers involved; they must also be directly related to the core problem (Brown, Colville, and Pye Citation2015). In addition, any feedback on the realised impact should be shared with the KE group (Vlaar, Van den Bosch, and Volberda Citation2006). Therefore, the countermeasures must be quantified in relation to the problem indicator to be able to forecast and then track the impact of implementing them.
Altogether, the two consecutive archival studies presented herein, offer important insights with more granularity than currently provided by the existing KE models (Farris et al. Citation2009; Franken, Van Dun, and Wilderom Citation2021). Existing models for KE success contain either input variables, like group-compositional factors (Farris et al. Citation2009) or process factors, like orderly following the KE phases and no-phase skipping (Franken, Van Dun, and Wilderom Citation2021). With the results of the present research, we not only add behavioural process factors to the success factors of the well-known KE phases, but also give more insight into which factors are more important than others to realise OPI.
Thus, this present research points to four precise, KE process factors which are associated with objective OPI. These micro-level, phase-specific KE process factors enrich our process-type knowledge on how to execute effective KEs as an organisational lean tool that must still be optimised before it will be used with much more ease more often.
6.2. Practical implications
Effective problem solving that leads to better operational performance remains a key challenge for organisations that strive to become a continuously improving organisation. Although structured problem-solving approaches, like a KE, are promising, performance results tend to be hard to achieve. Our research identified four behavioural factors that can support practitioners to better realise operational improvement in specific KE phases: 1) the KE group is committed to solve the problem (phase 1, problem definition); 2) a problem indicator is specified in the first KE phase (phase 1, problem definition); 3) countermeasures are quantified in relation to the problem indicator (phase 3, generate ideas); and) 4) the line manager champions idea implementation (phase 5, implementation). Indeed, commitment to solve the issue is key for KE success. Therefore, in the phase of problem definition, it should be checked that KE group members are aware of the problem, see the sense of urgency to solve the problem, and are also willing to solve the problem. Also, KE groups should not go to the second phase of a KE without having formulated a ‘SMART’ problem indicator and should relate suggested countermeasures to the impact they aim to have on this problem indicator. And during the implementation phase, although a KE group has autonomy to change operational ways of work, line management has to champion this change. Integrating this process-type knowledge in KEs and in KE facilitator- and group-training courses, will make the full execution of KEs more effective, so that more OPIs are likely to result. It shows that people who populate (and/or facilitate) KE groups must not only have (or understand) the technical knowledge to solve the problem but can benefit from knowledge of the best behavioural process factors that must precede any solving of persistent complex problems through KE in organisations. More focus on these four essential KE behavioural process factors may therefore benefit all organisations that wish to improve their operations effectively and continuously.
7. Strengths, limitations, and future research
This archival research explored behavioural KE factors leading to OPI. We first identified nine factors derived from three different theories related to OB, aiming for a better understanding and handling of the structured problem-solving process of KEs as a potentially powerful ‘tool’ to resolve persistent complex operational problems in all sorts of organisations. Our original, two-pronged analyses of archival data was designed to offer behavioural insights from the field of Organisational Behaviour to the field of operations and production management, illustrating how fruitful that could be.
The two studies’ archival natures constitutes both a strength and a limitation. The examined KEs were held in a total of 39 different organisations (five in Study 1, and 34 in Study 2) and the KEs addressed different types of problems. This allowed for the required diversity. A major advantage was that we knew that the data was already available when starting the study (Das, Jain, and Mishra Citation2018), which allowed us to skip the time consuming process of selecting KE projects, performing the KEs, and waiting for the results. Another advantage was the reduced risk of KE and experimenter sample bias (Shultz, Hoffman, and Reiter-Palmon Citation2005) as we as researchers could not influence the group composition or execution of the KEs (Kessler and Shoss Citation2022). However, the two utilised private data sets were not made with the intention to be analysed on the selected variables, and as a consequence we had to operationalise the factors using proxies (Shultz, Hoffman, and Reiter-Palmon Citation2005). Furthermore, archival studies are retrospective without having the opportunity to observe the actual process. As a countermeasure, to enrich our understanding of the archival data, we held interviews with the facilitators who had documented the KEs.
In the future, it would be useful to start surveying and interviewing KE group members and their facilitators as well as other stakeholders, for more direct measurement. When selecting KEs for future research, it is advised to also incorporate various control variables. For instance, taking into account the variable ‘years of work experience’ can illuminate whether explicitly applying the revealed factors is more important for a novice workforce compared to an experienced one (Netland Citation2016). Another interesting control variable is the type of organisation, as service organisations might be less inclined or used to using problem indicators compared to manufacturing firms (Northcott and Ma’amora Taulapapa Citation2012). Obtaining such (ideally longitudinal, mixed methods) field data could further strengthen the phase-based KE framework for achieving high OPI. Through analysing two separate A3 archives, which had been curated by two lean experts, we laid the groundwork for such practically impactful future research.
Disclosure statement
No potential conflict of interest was reported by the author(s).
Additional information
Notes on contributors

José C. M. Franken
Dr José C. M. Franken is currently working as a continuous improvement programme manager at the University of Twente, the Netherlands. With a background in computer science she worked for over 15 years as IT project leader and ICT manager. Since 2003 she worked as a lean advisor (lean master black belt) in many different multinational production as well as service organisations. She started her Ph.D. research in 2018 from a personal interest in improving the dynamics and outcomes of teams and individuals in kaizen events. Her thesis is titled: ‘Group capabilities and process quality in complex problem solving’ and was successfully defended April 2024. Her first empirical study received the 2020 European Operations Management Association Harry Boer Best Doctoral Paper Runner-up Award and got published in International Journal of Operations & Production Management. https://people.utwente.nl/j.c.m.franken

Desirée H. van Dun
Dr Desirée H. van Dun is assistant professor in Organisational Behaviour, Change Management and Consultancy at the University of Twente, the Netherlands, and has previously been a visiting researcher at Cardiff Business School, United Kingdom. Besides having 10 years of management consulting experience, she obtained a cum laude Ph.D. degree in 2015; this thesis won various local and international awards. Her academic work has appeared in management journals such as the International Review of Industrial and Organisational Psychology, International Journal of Operations & Production Management, Production Planning & Control, European Management Journal, Creativity and Innovation Management, and International Journal of Qualitative Methods. Van Dun currently studies effective human behavioural dynamics for digital and green organisational transformation, including leading lean (& green), agile, and Industry 4.0 technology adoption. https://people.utwente.nl/d.h.vandun

Celeste P. M. Wilderom
Prof. Dr Celeste P. M. Wilderom holds the chair in Change Management and Organisational Behaviour at the University of Twente, Enschede, the Netherlands. In 1987, she obtained her PhD in Psychology from the State University of New York, Buffalo (USA) and then worked in the Economics and Business Administration Faculties at both Tilburg University and the Free University in the Netherlands. She has been an associate editor of various international management journals such as the British Journal of Management, the Academy of Management Executive/Perspectives, and the Journal of Service Management; she is currently a member of various editorial boards. Her research pivots on effective leader- and followership as well as teamwork in various profit-making and non-profit work settings: https://people.utwente.nl/c.p.m.wilderom
References
- Ajzen, I. 1991. “The Theory of Planned Behavior.” Organizational Behavior and Human Decision Processes 50 (2): 179–211. https://doi.org/10.1016/0749-5978(91)90020-T.
- Aleu, F. G., and E. M. Van Aken. 2016. “Systematic Literature Review of Critical Success Factors for Continuous Improvement Projects.” International Journal of Lean Six Sigma 7 (3): 214–232. https://doi.org/10.1108/IJLSS-06-2015-0025.
- Angelis, J., R. Conti, C. Cooper, and C. Gill. 2011. “Building a High‐Commitment Lean Culture.” Journal of Manufacturing Technology Management 22 (5): 569–586. https://doi.org/10.1108/17410381111134446.
- Antony, J., and S. Gupta. 2019. “Top Ten Reasons for Process Improvement Project Failures.” International Journal of Lean Six Sigma 10 (1): 367–374. https://doi.org/10.1108/IJLSS-11-2017-0130.
- Antony, J., V. Swarnakar, N. Gupta, J. Kaur, R. Jayaraman, G. L. Tortorella, and E. Cudney. 2023. “Critical Success Factors for Operational Excellence Initiatives in Manufacturing: A Meta-Analysis.” Total Quality Management & Business Excellence 34 (9-10): 1152–1172. https://doi.org/10.1080/14783363.2022.2157714.
- Aoki, K. 2008. “Transferring Japanese Kaizen Activities to Overseas Plants in China.” International Journal of Operations & Production Management 28 (6): 518–539. https://doi.org/10.1108/01443570810875340.
- Bader, M., J. Antony, R. Jayaraman, V. Swarnakar, R. S. Goonetilleke, M. Maalouf, J. A. Garza-Reyes, and K. Linderman. 2023. “Why Do Process Improvement Projects Fail in Organizations? A Review and Future Research Agenda.” International Journal of Lean Six Sigma 15 (3): 664–690. https://doi.org/10.1108/IJLSS-07-2023-0126.
- Bartunek, J. M., D. M. Rousseau, J. W. Rudolph, and J. A. DePalma. 2006. “On the Receivinge End: Sensemaking, Emotion, and Assessments of an Organizational Change Initiated by Others.” The Journal of Applied Behavioral Science 42 (2): 182–206. https://doi.org/10.1177/0021886305285455.
- Bateman, N. 2005. “Sustainability: The Elusive Element of Process Improvement.” International Journal of Operations & Production Management 25 (3): 261–276. https://doi.org/10.1108/01443570510581862.
- Bellisario, A., and A. Pavlov. 2018. “Performance Management Practices in Lean Manufacturing Organizations: A Systematic Review of Research Evidence.” Production Planning & Control 29 (5): 367–385. https://doi.org/10.1080/09537287.2018.1432909.
- Blumberg, B., D. Cooper, and P. Schindler. 2011. Business Research Methods. Berkshire: McGraw-Hill Education.
- Bortolotti, T., S. Boscari, and P. Danese. 2015. “Successful Lean Implementation: Organizational Culture and Soft Lean Practices.” International Journal of Production Economics 160: 182–201. https://doi.org/10.1016/j.ijpe.2014.10.013.
- Bortolotti, T., S. Boscari, P. Danese, H. A. Medina Suni, N. Rich, and P. Romano. 2018. “The Social Benefits of Kaizen Initiatives in Healthcare: An Empirical Study.” International Journal of Operations & Production Management 38 (2): 554–578. https://doi.org/10.1108/IJOPM-02-2017-0085.
- Bouckenooghe, D. 2012. “The Role of Organizational Politics, Contextual Resources, and Formal Communication on Change Recipients’ Commitment to Change: A Multilevel Study.” European Journal of Work and Organizational Psychology 21 (4): 575–602. https://doi.org/10.1080/1359432X.2011.591573.
- Brown, A. D., I. Colville, and A. Pye. 2015. “Making Sense of Sensemaking in Organization Studies.” Organization Studies 36 (2): 265–277. https://doi.org/10.1177/0170840614559259.
- Brunet, A. P., and S. New. 2003. “Kaizen in Japan: An Empirical Study.” International Journal of Operations & Production Management 23 (12): 1426–1446. https://doi.org/10.1108/01443570310506704.
- Choo, A. S. 2014. “Defining Problems Fast and Slow: The U-Shaped Effect of Problem Definition Time on Project Duration.” Production and Operations Management 23 (8): 1462–1479. https://doi.org/10.1111/poms.12219.
- Cinite, I., and L. E. Duxbury. 2018. “Measuring the Behavioral Properties of Commitment and Resistance to Organizational Change.” The Journal of Applied Behavioral Science 54 (2): 113–139. https://doi.org/10.1177/0021886318757997.
- Dahlgaard, J. J., and L. N. Anninos. 2022. “Quality, Resilience, Sustainability and Excellence: Understanding LEGO’s Journey towards Organisational Excellence.” International Journal of Quality and Service Sciences 14 (3): 465–485. https://doi.org/10.1108/IJQSS-12-2021-0183.
- Darragh, J., and A. Campbell. 2001. “Why Corporate Initiatives Get Stuck?” Long Range Planning 34 (1): 33–52. https://doi.org/10.1016/S0024-6301(00)00095-9.
- Das, R., K. K. Jain, and S. K. Mishra. 2018. “Archival Research: A Neglected Method in Organization Studies.” Benchmarking: An International Journal 25 (1): 138–155. https://doi.org/10.1108/BIJ-08-2016-0123.
- De Mast, J., and J. Lokkerbol. 2012. “An Analysis of the Six Sigma DMAIC Method from the Perspective of Problem Solving.” International Journal of Production Economics 139 (2): 604–614. https://doi.org/10.1016/j.ijpe.2012.05.035.
- Edmondson, A. C., and S. E. McManus. 2007. “Methodological Fit in Management Field Research.” Academy of Management Review 32 (4): 1246–1264. https://doi.org/10.5465/amr.2007.26586086.
- Farris, J. A., E. M. van Aken, T. L. Doolen, and J. Worley. 2009. “Critical Success Factors for Human Resource Outcomes in Kaizen Events: An Empirical Study.” International Journal of Production Economics 117 (1): 42–65. https://doi.org/10.1016/j.ijpe.2008.08.051.
- Fisher, G. G., and D. S. Chaffee. 2018. “Research Using Archival Data.” In Advanced Research Methods for Applied Psychology, edited by Paule Brough, 76–84. London: Routledge.
- Fournier, P.-L., M.-H. Jobin, L. Lapointe, and L. Bahl. 2023. “Lean Implementation in Healthcare: Offsetting Physicians’ Resistance to Change.” Production Planning & Control 34 (6): 493–505. https://doi.org/10.1080/09537287.2021.1938730.
- Franken, J. C. M., D. H. Van Dun, and C. P. M. Wilderom. 2021. “Kaizen Event Process Quality: Towards a Phase-Based Understanding of High-Quality Group Problem-Solving.” International Journal of Operations & Production Management 41 (6): 962–990. https://doi.org/10.1108/IJOPM-09-2020-0666.
- Gagnon, J., F. Dionne, and T. A. Pychyl. 2016. “Committed Action: An Initial Study on Its Association to Procrastination in Academic Settings.” Journal of Contextual Behavioral Science 5 (2): 97–102. https://doi.org/10.1016/j.jcbs.2016.04.002.
- Galeazzo, A., A. Furlan, and A. Vinelli. 2021. “The Role of Employees’ Participation and Managers’ Authority on Continuous Improvement and Performance.” International Journal of Operations & Production Management 41 (13): 34–64. https://doi.org/10.1108/IJOPM-07-2020-0482.
- Garza-Reyes, J. A., C. Christopoulos, A. Kumar, S. Luthra, F. González-Aleu, V. Kumar, and B. Villarreal. 2022. “Deploying Kaizen Events in the Manufacturing Industry: An Investigation into Managerial Factors.” Production Planning & Control 33 (5): 427–449. https://doi.org/10.1080/09537287.2020.1824282.
- Gigliotti, R., J. Vardaman, D. R. Marshall, and K. Gonzalez. 2019. “The Role of Perceived Organizational Support in Individual Change Readiness.” Journal of Change Management 19 (2): 86–100. https://doi.org/10.1080/14697017.2018.1459784.
- Glover, W. J., J. A. Farris, and E. M. Van Aken. 2014. “Kaizen Events: Assessing the Existing Literature and Convergence of Practices.” Engineering Management Journal 26 (1): 39–61. https://doi.org/10.1080/10429247.2014.11432003.
- Hackman, J. R., and C. G. Morris. 1975. “Group Tasks, Group Interaction Process, and Group Performance Effectiveness.” In Advances in Experimental Social Psychology, edited by Leonard Berkowitz, 45–99. London: Academic Press.
- Helmold, M. 2022. Strategic Performance Management, Achieving Long-Term Competitive Advantage through Performance Excellence. Cham: Springer Nature Switzerland
- Herscovitch, L., and J. P. Meyer. 2002. “Commitment to Organizational Change: Extension of a Three-Component Model.” The Journal of Applied Psychology 87 (3): 474–487. https://doi.org/10.1037//0021-9010.87.3.474.
- Hosono, A. 2020. “Kaizen Toward Learning, Transformation, and High-Quality Growth: Insights from Outstanding Experiences.” In Workers, Managers, Productivity: Kaizen in Developing Countries, edited by Akio Hosono, John Page and Go Shimada, 45–67. Singapore: Springer Singapore.
- Imai, M. 1997. Gemba Kaizen: A Commonsense, Low-Cost Approach to Management. Seattle: The Kaizen Institute.
- Jaros, S. 2010. “Commitment to Organizational Change: A Critical Review.” Journal of Change Management 10 (1): 79–108. https://doi.org/10.1080/14697010903549457.
- Kawamichi, H., K. Yoshihara, A. T. Sasaki, S. K. Sugawara, H. C. Tanabe, R. Shinohara, Y. Sugisawa, et al. 2015. “Perceiving Active Listening Activates the Reward System and Improves the Impression of Relevant Experiences.” Social Neuroscience 10 (1): 16–26. https://doi.org/10.1080/17470919.2014.954732.
- Kerrin, M., and N. Oliver. 2002. “Collective and Individual Improvement Activities: The Role of Reward Systems.” Personnel Review 31 (3): 320–337. https://doi.org/10.1108/00483480210422732.
- Kessler, S. R., and M. K. Shoss. 2022. “Archival Data Sets Should Not Be a Secondary (or Even Last) Choice in Micro-Organizational Research.” Group & Organization Management 47 (5): 907–919. https://doi.org/10.1177/10596011221112521.
- Klein, H. J., M. J. Wesson, J. R. Hollenbeck, P. M. Wright, and R. P. DeShon. 2001. “The Assessment of Goal Commitment: A Measurement Model Meta-Analysis.” Organizational Behavior and Human Decision Processes 85 (1): 32–55. https://doi.org/10.1006/obhd.2000.2931.
- Kotter, J. P., and L. A. Schlesinger. 1979. “Choosing Strategies for Change.” Harvard Business Review 57 (2): 106–114.
- Kozlowski, S. W. J., and D. R. Ilgen. 2006. “Enhancing the Effectiveness of Work Groups and Teams.” Psychological Science in the Public Interest: a Journal of the American Psychological Society 7 (3): 77–124. https://doi.org/10.1111/j.1529-1006.2006.00030.x.
- Laraia, A. C., P. E. Moody, and R. W. Hall. 1999. The Kaizen Blitz: Accelerating Breakthroughs in Productivity and Performance. New York: John Wiley & Sons.
- Liker, J. K. 2004. The Toyota Way. New York: McGraw-Hill
- Locke, E. A., and G. P. Latham. 2002. “Building a Practically Useful Theory of Goal Setting and Task Motivation: A 35-Year Odyssey.” The American Psychologist 57 (9): 705–717. https://doi.org/10.1037//0003-066X.57.9.705.
- Lüscher, L. S., and M. W. Lewis. 2008. “Organizational Change and Managerial Sensemaking: Working through Paradox.” Academy of Management Journal 51 (2): 221–240. https://doi.org/10.5465/amj.2008.31767217.
- Malik, M., and S. Abdallah. 2020. “The Relationship between Organizational Attitude and Lean Practices: An Organizational Sense-Making Perspective.” Industrial Management & Data Systems 120 (9): 1715–1731. https://doi.org/10.1108/IMDS-09-2019-0460.
- McKinsey&Company. 2003. “Kaizen.” In Lean course presentation. Amsterdam: McKinsey & Company.
- Meyer, J. P., and L. Herscovitch. 2001. “Commitment in the Workplace: Toward a General Model.” Human Resource Management Review 11 (3): 299–326. https://doi.org/10.1016/S1053-4822(00)00053-X.
- Mohaghegh, M., and A. Größler. 2020. “The Dynamics of Operational Problem-Solving: A Dual-Process Approach.” Systemic Practice and Action Research 33 (1): 27–54. https://doi.org/10.1007/s11213-019-09513-9.
- Moreira, M., and B. Tjahjono. 2016. “Applying Performance Measures to Support Decision-Making in Supply Chain Operations: A Case of Beverage Industry.” International Journal of Production Research 54 (8): 2345–2365. https://doi.org/10.1080/00207543.2015.1076944.
- Negrão, L. L. L., M. Godinho Filho, and G. Marodin. 2016. “Lean Practices and Their Effect on Performance: A Literature Review.” Production Planning & Control 28 (1): 1–24. https://doi.org/10.1080/09537287.2016.1231853.
- Netland, T. H. 2016. “Critical Success Factors for Implementing Lean Production: The Effect of Contingencies.” International Journal of Production Research 54 (8): 2433–2448. https://doi.org/10.1080/00207543.2015.1096976.
- Northcott, D., and T. Ma’amora Taulapapa. 2012. “Using the Balanced Scorecard to Manage Performance in Public Sector Organizations: Issues and Challenges.” International Journal of Public Sector Management 25 (3): 166–191. https://doi.org/10.1108/09513551211224234.
- Ogbeiwi, O. 2017. “Why Written Objectives Need to Be Really SMART.” British Journal of Healthcare Management 23 (7): 324–336. https://doi.org/10.12968/bjhc.2017.23.7.324.
- Oreg, S., M. Vakola, and A. Armenakis. 2011. “Change Recipients’ Reactions to Organizational Change: A 60-Year Review of Quantitative Studies.” The Journal of Applied Behavioral Science 47 (4): 461–524. https://doi.org/10.1177/0021886310396550.
- Rother, M. 2019. Toyota Kata: Managing People for Improvement, Adaptiveness and Superior Results. New York: McGraw-Hill.
- Rother, M., and J. Shook. 2003. Learning to See: Value Stream Mapping to Add Value and Eliminate Muda. Boston: Lean Enterprise Institute.
- Ruiz-Benítez, R., C. López, and J. C. Real. 2018. “The Lean and Resilient Management of the Supply Chain and Its Impact on Performance.” International Journal of Production Economics 203: 190–202. https://doi.org/10.1016/j.ijpe.2018.06.009.
- Salancik, G. R. 1977. “Commitment is Too Easy!.” Organizational Dynamics 6 (1): 62–80. https://doi.org/10.1016/0090-2616(77)90035-3.
- Schmidt, G. B. 2019. “The Need for Goal-Setting Theory and Motivation Constructs in Lean Management.” Industrial and Organizational Psychology 12 (3): 251–254. https://doi.org/10.1017/iop.2019.48.
- Secchi, R., and A. Camuffo. 2019. “Lean Implementation Failures: The Role of Organizational Ambidexterity.” International Journal of Production Economics 210: 145–154. https://doi.org/10.1016/j.ijpe.2019.01.007.
- Shook, J. 2008. Managing to Learn: Using the A3 Management Process to Solve Problems, Gain Agreement, Mentor and Lead. Cambridge: Lean Enterprise Institute.
- Shultz, K. S., C. C. Hoffman, and R. Reiter-Palmon. 2005. “Using Archival Data for IO Research: Advantages, Pitfalls, Sources, and Examples.” The Industrial-Organizational Psychologist 42 (3): 31–37.
- Singh, J., and H. Singh. 2009. “Kaizen Philosophy: A Review of Literature.” IUP Journal of Operations Management 8 (2): 51.
- Smith, M. E. 2008. “Implementing Organizational Change: Correlates of Success and Failure.” Performance Improvement Quarterly 15 (1): 67–83. https://doi.org/10.1111/j.1937-8327.2002.tb00241.x.
- Suárez-Barraza, M. F., J. A. Miguel-Dávila, and M. F. Morales-Contreras. 2021. “Application of Kaizen-Kata Methodology to Improve Operational Problem Processes: A Case Study in a Service Organization.” International Journal of Quality and Service Sciences 13 (1): 29–44. https://doi.org/10.1108/IJQSS-07-2020-0113.
- Suárez‐Barraza, M. F., J. Ramis‐Pujol, and L. Kerbache. 2011. “Thoughts on Kaizen and Its Evolution.” International Journal of Lean Six Sigma 2 (4): 288–308. https://doi.org/10.1108/20401461111189407.
- Suárez-Barraza, M. F., F. G. Rodríguez González, and J.-A. Miguel Dávila. 2018. “Introduction to the Special Issue on Kaizen: An Ancient Operation Innovation Strategy for Organizations of the XXI Century.” The TQM Journal 30 (4): 250–254. https://doi.org/10.1108/TQM-06-2018-180.
- Thurlow, A., and J. H. Mills. 2009. “Change, Talk and Sensemaking.” Journal of Organizational Change Management 22 (5): 459–479. https://doi.org/10.1108/09534810910983442.
- Tucker, A. L., A. C. Edmondson, and S. Spear. 2002. “When Problem Solving Prevents Organizational Learning.” Journal of Organizational Change Management 15 (2): 122–137. https://doi.org/10.1108/09534810210423008.
- Van Dun, D. H., J. N. Hicks, and C. P. M. Wilderom. 2017. “Values and Behaviors of Effective Lean Managers: Mixed-Methods Exploratory Research.” European Management Journal 35 (2): 174–186. https://doi.org/10.1016/j.emj.2016.05.001.
- Van Dun, D. H., and C. P. M. Wilderom. 2021. “Improving High Lean Team Performance through Aligned Behaviour-Value Patterns and Coactive Vicarious Learning-by-Doing.” International Journal of Operations & Production Management 41 (13): 65–99. https://doi.org/10.1108/IJOPM-11-2020-0809.
- Van Quaquebeke, N., and W. Felps. 2018. “Respectful Inquiry: A Motivational account of Leading through Asking Questions and Listening.” Academy of Management Review 43 (1): 5–27. https://doi.org/10.5465/amr.2014.0537.
- Vlaar, P., F. Van den Bosch, and H. Volberda. 2006. “Coping with Problems of Understanding in Interorganizational Relationships: Using Formalization as a Means to Make Sense.” Organization Studies 27 (11): 1617–1638. https://doi.org/10.1177/0170840606068338.
- Womack, J. P., and D. T. Jones. 1996. Lean Thinking. London: Simon & Schuster.
- Woods, D. R. 2000. “An Evidence‐Based Strategy for Problem Solving.” Journal of Engineering Education 89 (4): 443–459. https://doi.org/10.1002/j.2168-9830.2000.tb00551.x.