
ABSTRACT
As more technologies and industries converge, technology standards are more likely to be a strategic factor for firms and governments that are interested in the market with standards-based competition. From the previous research, a new standardisation framework was proposed by combining network analysis and the game theory model but was constrained by feasibility and dynamic approach. In this study, the case of the standards war between HD-DVD and Blu-ray was analyzed with patent data as an empirical case considering a dynamic framework. With this framework, we observed a change in a firm’s technology relations and could predict the decline in a firm’s preference and the shift of equilibrium ahead of Toshiba’s resignation.
1. Introduction
Technology standards refers to a consensus on the set of specifications between agents about key products or functions (Farrell and Saloner Citation1992; Nickerson and Muehlen Citation2006; Tassey Citation2000). In the past, the role of the technology standards focused on reducing market uncertainty between consumers and producers (Funk and Methe Citation2001). Under this social agreement on the technology, consumers could purchase products with confidence in their value, and producers could actively produce products with less uncertainty of consumer preference. As more technologies and industries started to converge, technology standards are now more likely to be a strategic factor for firms and governments that are interested in the market with standards-based competition.
With increased interest in the benefits and importance of technology standardisation, various research was conducted to measure or analyze the value or effect of it. As we see from these two cases, a firm that owns the technology standard possesses strong market power and high profit because the rule of ‘winner takes all’ exists in the market where the network effect prevails (Arthur Citation1989; Kelly Citation1998; Shapiro and Varian Citation1999). Bresnahan and Greenstein (Citation1996) stated that the economic value of technology can be improved not only by technology itself, but also by the involvement and experience of other players and users. Therefore, network effects are an essential part of discussion in the technology standardisation study and can be classified into two aspects: direct and indirect. Since the direct network effect is based on the demand of technology, the user base or total number of users is often used for the analysis (Ohashi Citation2003; Shankar and Bayus Citation2003). For the indirect network effect, factors like the hedonic function (Gandal Citation1994; Hartman and Teece Citation1990), and information costs (Weitzel Citation2004) are used to estimate indirect network effect. The indirect network effect, which refers to phenomenon that the value of the technology increases when the value of complementary goods is increased, has remarkable influence because compatibility is now considered a core function of technology standards.
However, existing studies showed two limitations on analyzing technology standards. First, as mentioned above, their analysis overlooked the importance of analyzing technical factors of technology standards. For instance, in order to gather collective power among the parties to a standard, the compatibility of technology has to be established so they can share the benefits. Nevertheless, most of researchers are more interested in the economic impact of standards especially considering the costs and benefits rather than network values like compatibility. Secondly, they have shown limitation on the analysis. In reality, a de facto standard is determined by relative understanding between firms and their technologies. Hence, it is necessary to consider relations between players rather than simply optimising the benefits. However, because of the difficulty in collecting feasible data and the scope of the framework, the quantitative analysis on this perspective was limited in existing studies.
From this aspect, a new standardisation framework using patent data was proposed to estimate the effect and analyze the actual process (Kim, Jung, and Hwang Citation2015). By combining network analysis and game theory models, we established a framework considering relative pay-offs between players to diagnose the current situation. However, this framework faced two limitations. First, it needs to be tested with existing cases in order to prove its validity. For example, the Internet of Things provides a case with which to validate the framework because it has yet to be standardised. Second, a dynamic approach was not considered although standardisation is a non-static process of seeking equilibrium among players. As the framework only considered static conditions, the policy implications that can be drawn is limited because policies implicitly change dynamics.
In order to consider these limitations and prove feasibility, this framework should be applied in actual cases that have clear results and credible applicable data. In this paper, we selected the standards war between HD-DVD and Blu-ray as an empirical case and implemented dynamics of standardisation because the case represents one of the most competitive standards battles between firms and shares some similarities with other standardisation cases. We also analyzed how relations between firms and technologies change, and examined whether this framework can be used to draw further implications such as the foresight studies for governments and firms.
2. Literature review
2.1. Standardisation factors
An interesting thing about standardisation is that it is not merely a matter of optimisation; it is a matter fraught with complexity between players. Since a standard is an outcome of the negotiation process between two or more independent interested parties (Funk and Methe Citation2001), various factors must be considered for the analysis. More to the point, the effect of each factor varies depending on the view of analysis and market conditions: for instance, whether the standard is established by public institutions (non-market) or the market distinguishes the main players and the goal of the game. Regarding this matter, previous literature derives standardisation factors according to the view of analysis and market conditions. As an example of a non-market standard study, Angulo, Calzada, and Estruch (Citation2011) conducted research on the standardisation for digital television in Latin America with four factors: technical and socio-economic features, network externalities and scale economies, industry policy, and neighbouring and political integration. Technical and socio-economic features show whether a technology standard is technically well-advanced and economically beneficial. Network externalities and scale economies refer to an effect of standard in both consumption and production. The industry policy factor considers the adequacy of national industry policy. The final factor, neighbouring and political integration, depends on the possibility of cooperation with other countries. By looking at case studies on Latin American countries, the study concluded that widespread standards have the advantage in network externalities, economies of scale, and lower cost.
In market standard studies, one of the classical approaches for this discussion is the diffusion theory. The aim of the technology standards is to promote compatibility and interoperability (Xie et al. Citation2016), which has positive influences on both demand and supply in the market. Similarly, diffusion theory focuses on situations where potential consumers are influenced to adopt a technology (Rogers Citation1983). By using the diffusion theory, Hovav, Patnayakuni, and Schuff (Citation2004) proposed the internet standard adoption model. The two main perspectives of this model are the environmental conduciveness to the adoption of a new standard (EC) and the usefulness of the features of the new standard (UF). EC consists of components that favour a firm’s adoption of a standard such as network externalities, related technologies, installed base, communication channels, sponsorship, and resources. UF refers to attractive features of standard to potential adopters including relative advantage, compatibility, complexity, and observable benefits. In a follow up study that focused on IPv6, the researchers included the existence of a ‘killer app’ under UF (Hovav and Schuff Citation2005) and analyzed with the survey data collected from companies in South Korea (Hovav, Hemmert, and Kim Citation2011). This model and its related determinants clearly defined standardisation, but it has a limitation of generalisation. Since it only considers the features of the internet market, it cannot be extended to other cases where the surrounding context is different.
Rather than focusing on a specific technology or industry, Kaa and Vries (Citation2015) provide a broader perspective on standardisation than previous studies. They establish a standardisation framework based on previous literature consisting of 29 standardisation factors including 5 main categories: characteristics of the format supporter, characteristics of the format, format support strategy, other stakeholders, and market characteristics (Kaa et al. Citation2011). They reviewed three historical battles over formats including information technology, telecommunications, and consumer electronics in 126 publications. Their contribution not only just confirms their framework but also integrates existing frameworks and provides a holistic view.
In order to determine the reliability of these factors, empirical analysis was conducted with the case studies and survey data. However, survey or interview data collected from individual firm contains problems of bias because their targets are limited (Hovav, Hemmert, and Kim Citation2011). Instead, patent data may be a good substitute. Kang and Motohashi (Citation2015) used patent data to investigate the determinants of essential intellectual property rights (IPRs) in wireless communication standards. In this research, they used four determinants including technological advancement, firm-level strategic involvement, strategic patent filling process, and national styles. They used patent data to measure technological advancement with forward citations (Bekkers, Bongard, and Nuvolari Citation2011; Rysman, Simcoe, and Heath Citation2008), and strategic patent filling process with the number of claims (Berger, Blind, and Thumm Citation2012). However, there should be a more consideration of this approach as the meaning of forward citation varies among researchers.
As we can see from the previous literature, various factors were included in the research framework to analyze standardisation. Among those factors, the value of compatibility is recognised as its effect showed a significant impact on most cases because a compatible standard enhances network externalities and economies of scale (Angulo, Calzada, and Estruch Citation2011; Berg Citation1988; Farrell and Saloner Citation1985). Therefore, the compatibility of a technology standard should be discussed prominently in the study of standardisation. In this sense, Kim, Jung, and Hwang (Citation2015)’s standard framework, which is further explored in a later chapter, satisfies all these issues of generalisation, quantitative studies, and compatibility. For this research, the dynamic condition of standardisation is additionally implemented for analyzing how technologies change by time period.
2.2. HD-DVD vs. Blu-ray
In the early 2000s, DVD technology was considerably advanced with the introduction of a blue laser. This technological improvement enabled greater memory capacity with higher video quality. With increasing interest in this technology, firms began to formulate two different consortiums leading by two major firms: Toshiba and Sony. The first consortium, led by Toshiba and called the HD-DVD Promotion Group, supported HD-DVD technology. The second consortium, the Blu-ray Disc Association, supported Sony’s Blu-ray technology. When these two technologies were commercially available in 2006, HD-DVD was in a better position than Blu-ray. Since HD-DVD was derived from existing DVD, it required lower marginal cost and had a larger installed base compared to Blu-ray. However, an interesting point here is that Blu-ray turned out to be the winner when Toshiba withdrew from the market in February, 2008.
Many researchers and experts tried to explain this standards war and pointed to various reasons. One of the interesting aspects about this standards war is that both consortia were associated with major content providers. The lessons from Betamax and VHS case taught them that cooperation with content providers is critical for standardisation. Accordingly, some argue that the alliance strategy was the tipping point in this standards war. More specifically, Sony enhanced copyright protection whereas Toshiba ignored it. Hollywood content providers lost millions of dollars from pirated DVDs (Chang and Huang Citation2016) because of weak protections. On the other hand, Blu-ray attracted many major movie studios by offering stronger copyright protection mechanism.
In addition, another complementary strategy was significant (Gallagher Citation2012). As mentioned earlier, the existing capacity of DVD technology allowed HD-DVD to enter the market at a lower cost and with a larger installed base. However, the cost advantage did not affect customers due to the close price gap between HD and Blu-ray disk. Moreover, the Blu-ray Disc Association actively engaged in increasing complementary technologies. An availability of complementary goods causes a positive influence on the installed base of the technology (Schilling Citation2002). In this case, high definition television sets and disc players were needed in order to appreciate the improvement in technology. Sony commercialised the products faster than Toshiba and set up the optimal goal to satisfy their stakeholders including big content providers and manufacturers. Especially, Sony’s decision on the utilisation of Blu-ray as a component in the ancillary product PlayStation 3 led to a larger installed base in 2007. Therefore, the success of Blu-ray relates to complementary goods, which provides better compatibility to both consumers and producers determining the result of this standards war.
3. Materials
In this research, we used the patent data of HD-DVD and Blu-ray. The patent data was retrieved from the various patent databases in United States, Europe, PCT (Patent Cooperation Treaty), Japan, and Korea. In general, either United States or European data is adopted in most studies, because they represent the most advanced countries with the largest patent pools. However, as HD-DVD and Blu-ray originate from Japanese firms and the influence of Korean manufacturing firms are significant, we included patents from Japan and Korea. Based on the literature review, we collected applied patent data with these two technology keywords from 2000 to 2008 according to the first announcement of the technology and the withdrawal of Toshiba. Since the goal of this research focuses not on the perspective of intellectual property but on technological competitiveness and technology adoption, we targeted the patent applications rather than the registered patents. With this collected data, we excluded overlapped and unrelated patents using patent office information, keywords, and summaries. We selected a total of 1,061 patents with 270 applicants without duplication. During this time period, the top applicants for HD-DVD were Toshiba, LG Electronics, Philips, Konica Minolta, Ricoh and Samsung, and the top applicants for Blu-ray were LG Electronics, Sony, Philips, Thomson, Funai Electrics and Samsung.
4. Methodology
The standardisation study analyzes the standardisation process and its outcomes to estimate the effect and derive policy implications. Thus, it is essential to figure out the value of the technology and its related agents in standardisation. In order to conduct a more technology-centered analysis, we proposed a new technology standardisation framework combining technology network analysis and game theory using patent data. To see how technological changes are made during standardisation, we considered the dynamics of this framework to analyze the variations of each variable depending on time changes. As you can see in , the result of network analysis is used to evaluate the game theory model and these two analyses are consequently conducted in annual time series.
Figure 1. The research process.
4.1. Game theory model
The game theory model consists of three components: player, strategy, and pay-off. The player is an agent who participates in the game and each player has his own strategies with different pay-offs. With this basic setting, the main purpose of game theory is to derive an equilibrium in the game depending on the players and their strategies. Because of its similarity to the actual standardisation procedure, it is widely used in related studies.
The basic game theory setting of this framework uses Belleflamme (Citation1998)’s two stage equilibrium model. This game theory model was designed for the situation where the firms adopt the network technologies including the operation system, communication carriers, and durable goods. Since it describes the firm’s strategic decisions based on the idea of compatible technology, this model suits the standardisation research framework. In the first stage, firms choose one of the two competing technologies and formulate two different groups. In terms of the network effect, the more a technology is used by firms, the expenditure on the information cost will be reduced by cheaper and faster communication with less uncertainty. Therefore, the use of standard technology induces strategic benefits and enables the realisation of saving potentials (Weitzel Citation2004). At the same time, it requires costs came from technology usage such as licensing fee, difficulty in obtaining core technology knowledge, limitation in developing extended technology, and etc. On the one hand, since this study is based on both usage and development of standard technology, firms that develop standard can take benefit from technology offering instead of technology cost mentioned earlier when it is standardised. In this context, the standardisation of a firm’s either used or developed technology provides greater advantage compare to the non-standardised case. Hence, the firms’ technological participation contributes to determining a firm’s marginal cost.
For the second stage, firms compete with their strategies (technologies) and the equilibrium is derived based on their pay-offs (Equation (1) and (2)), which are calculated with each firm’s preference on technology (θ, technology preference) and differentiation rate of technology (d, technology differentiation). Here, x (y) refers to the network size of technology X (Y) and n implies the number of firms. In this model, a firm has an incentive to be in large coalitions of compatible goods considering both positive and negative network effects. Based on this assumption, the value of θ lies between 0 and 1 and is considered common knowledge. In Belleflamme’s model, a firm’s pay-off is derived from the perspective of marginal cost. For consistency with the original model, θ should reflect both a firm’s marginal cost activity regarding its current capability and expected advantage on a certain technology. For example, if technology X is expected to be used among various firms with better compatibility and a firm owns advanced capability on technology X, we may assume that this firm achieves lower information costs with less uncertainty and their preference of technology X should be higher.
Belleflamme defines d as the degree of differentiation between two technologies and it also ranges from 0 to 1. As d reaches 1, the technology good becomes more substitutable and if d approaches 0 it is more independent with a higher degree of differentiation. For technology goods, the difference lies on their functions and this functional difference reflects the possibility of technological diversification. For instance, when a patent is applicable only to the single technology, there is no differentiation, but, if a patent can be implemented in numerous technologies, there exists high possibility of differentiation. Since technology diversity contributes to product and business diversification (Suzuki and Kodama Citation2004), the diversification of technology component is used as a proxy variable of d instead of the substitutability of functionality.(1)
(2) When a simple model with two players are considered, the game theory setting can be represented as two by two table (). In this research, a duopoly payoff was used because the main competition holds between two associations in the empirical case.
Table 1. n = 2, Cournot model.
4.2. Network analysis
We used technology network analysis to derive each firm’s technology preference (θ) and technology differentiation (d). The main purpose of social network analysis is to figure out the relation between nodes by analyzing the pattern and structure of nodes and edges (Monge and Contractor Citation2003; Wasserman and Faust Citation1994). From the previous studies, the relation between the firm-level social network indices and innovation has been investigated (Choi and Lee Citation2016; Egbetokun Citation2015; Tseng et al. Citation2016; Xue et al. Citation2017). In this sense, the technology network analysis is an effective tool for observing the technological advantage and features of a particular technology. Therefore, the combination of network indices can be used to represent θ as a firm’s preference based on its capability and the potential of the technology and d as the degree of technological differentiation.
To implement network analysis, we must build a network with nodes and edges. In technology network analysis, IPC (International Patent Classification) codes are used for nodes and patents are used for edges, which link different nodes (). For the linkage rule, a weighted network using IPC co-occurrence for the identical patents was adopted. Co-occurrence network is an effective way of analyzing the relationship between technologies and technological convergence (Curran and Leker Citation2011; Geum et al. Citation2012). Normally, patents have more than two IPC codes and some of them even share the same IPC codes. In this network, a shared IPC code is connected with patents that they belong to and more weight is given to edges where two patents share more than two IPC codes.
Figure 2. Technology co-appearance network.
4.2.1. Firm’s technology preference (θ)
Whenever a firm establishes either the business portfolio or technology strategy, it is reasonable to consider both of its own competitiveness and the potential value of targeting market. For business portfolio analysis, a firm’s decision is considered with its competitiveness and industry attractiveness using SWOT analysis (Dyson Citation2004) and GE matrix (Amatulli, Caputo, and Guido Citation2011). In technology strategy, a firm’s existing technology capability and technology opportunity are identified (Park and Yoon Citation2017), and in innovation model, industry affiliation, R&D intensity and labour quality are used to consider the firms’ competitiveness and also the market environment (Crepon, Duguet, and Mairesse Citation1998).
In this context, a firm’s competitiveness includes market share, productivity, etc., but standardisation is more focused on technology competitiveness (TC). Market attractiveness refers to market information like market size and market growth rate but under the same technology standard area, all the market factors are identical. Hence, it is more likely to consider technology attractiveness (TA) rather than market attractiveness in standardisation. We conceptualised Amatulli, Caputo, and Guido (Citation2011)’s framework into a standardisation model to derive a firm’s θ using TC and TA. Basically, a firm’s technology preference refers to relative preference between two technologies (Equation (3)), and it is calculated by multiplying a firm’s TC and TA (Equation (4)).
A firm’s TC refers to its technical capability and potential. In order to measure this value, we adopted the idea that firm i’s network indices imply its technical capability. Firms have numerous IPC codes for a given technology and each IPC code refers to a specific portion of technology. Therefore, we calculated a firm’s TC by multiplying the sum of three centrality values of firm’s IPC code and the market proportion of each IPC code (Equation (5)). These three centrality values are well-known indices used in network analysis (Scott Citation2003) and each value shows different aspects of a network. Degree centrality shows how often each node is connected to other nodes, betweenness centrality represents contribution of knowledge from one node to another, and closeness centrality measures how closely a node is positioned to other nodes. By multiplying the network value of an IPC and its market proportion, a researcher can determine a firm’s actual capability for a certain technology.
TA is derived by adding the normalised network density and network size (Equation (6)). Network density is used to figure out the potential applicability that a technology with a higher network density may have a higher possibility to be used in an innovative activity (Equation (7)). Network size is the total number of nodes, which refers to the technology scope covered by a technology standard. The reason we added these two factors is that multiplying them leads to the number of links in technology network and information loss. For example, if there is a large number of network links, it is hard to figure out whether it is because of convergence or network size.(3)
(4)
(5)
(6)
(7)
( : firm i’s relative technology preference,
: firm i’s technology preference on technology X,
: firm i’s technology competitiveness on technology X,
: firm i’s proportion of IPC j under technology X,
: degree centrality, betweeness centrality, closeness centrality of IPC j under technology X,
: technology attractiveness,
: technology X’s relative network density,
: technology X’s relative network size, N: number of nodes, L: number of links).
4.2.2. Technology differentiation (d)
When firms share the same technology, it does not guarantee that they share consistency of technological components. Since an IPC code is a classification that considers the technological layer, the degree of technology differentiation is measured with a diversification index using IPC codes. In this research, the Simpson index (Equation (8)) with range from 0 to 1 (Jost Citation2006) was adopted for d. Consistent with Belleflamme’s, the lower value refers to higher differentiation.(8) (
: proportion of IPC, j).
5. Results
First, we formulated the network of the two technologies using IPC code and patent information. Then, we calculated degree TC using centrality, betweenness centrality, closeness centrality and TA using network density and network size. To consider dynamic conditions of standardisation, all factors were analyzed annually from 2000 to 2008 and the changes in the firms’ TC values are shown in and . The graph intuitively demonstrates each firm’s technical competitiveness and the general tendencies among them.
Figure 3. TC of HD-DVD.
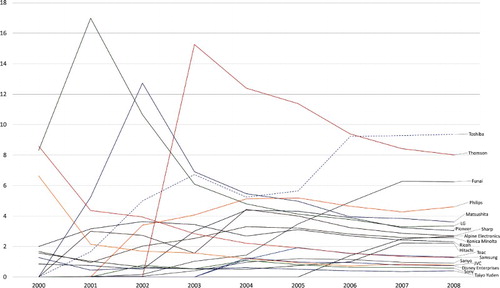
Figure 4. TC of Blu-ray.
For HD-DVD, LG, Matsushita, and Thomson showed stronger TC than others in the early stage but then started to decrease. Compared to them, Toshiba and Hitachi showed the gradual increments in TC. Despite its dip between 2003 and 2006, Toshiba’s TC was its highest in 2007. Except for Toshiba, most firms’ TC tend to decrease or remain the same even for those firms with strong TC. Although Sony was the leader of Blu-ray, they also had entered the HD-DVD market with a low TC.
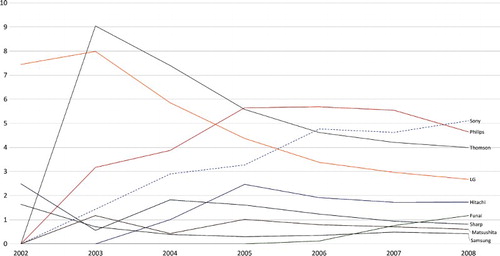
A similar pattern was observed in TC patterns of the Blu-ray market. LG and Thomson peaked early on in 2003. Sony was the only firm with gradual increment as most firms’ TC tended to diminish or maintain their value. Although HD-DVD’s TC plateaued from 2006, Sony’s TC continuously increased until 2008, which implies Sony consistently tried to improve their TC up to at least 2009. Toshiba was not included as it lacked patents in Blu-ray.
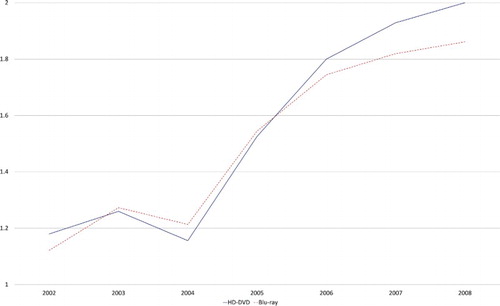
The changes in network size and network density showed similarities in both technologies. Because of its existing technological capacity, HD-DVD had greater network size and density than that of Blu-ray. However, Blu-ray achieved faster growth in the following years and narrowed the gap ( and ). Blu-ray technology expanded technology and applications faster than HD-DVD. Then we transformed these variables into relative value and calculated TA ().
Figure 5. Annual network size.
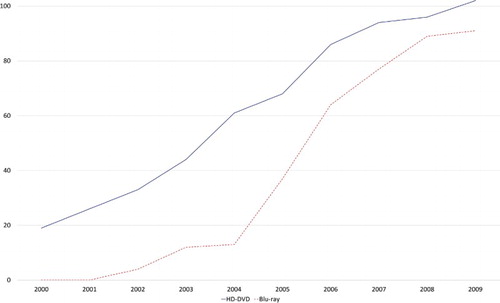
Figure 6. Annual network density.
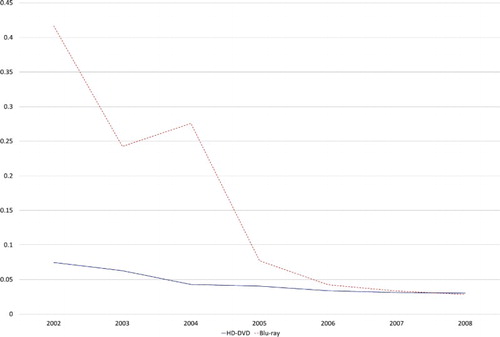
Figure 7. TA of HD-DVD and Blu-ray.
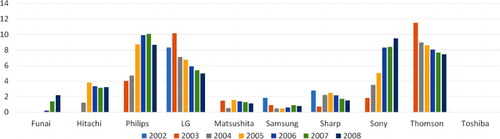
With the calculated results, we derived each firm’s technology preference. Among them, there were nine firms (Funai, Hitachi, Philips, LG, Matsushita, Samsung, Sharp, and Sony) that showed dual preference for both technologies. These are the top manufacturing firms in the market with high proportion of patents in this technology field. From these results, we found the changes in firms’ preferences for a certain technology ( and ). On both sides, only Toshiba and Sony showed clear preferences in their strategic technology area.
Figure 8. Absolute preference on HD-DVD.
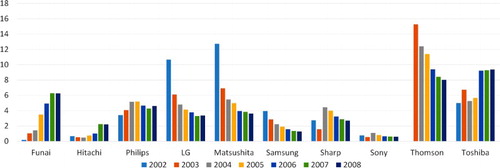
Figure 9. Absolute preference on Blu-ray.
Finally, we derived the technology differentiation value. Technology differentiation of both technologies fell close to zero, which suggests a higher rate of differentiation ().
Figure 10. Annual technology differentiation.
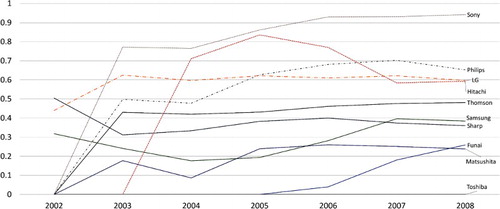
Based on these results, we computed relative technology preference of the top 10 major firms who have technical capabilities in both technologies including Toshiba. We included Toshiba, which had zero preference on Blu-ray, because it was one of the main players in this standard battle. We classified each group by the firms’ relative preferences. If a firm’s relative technology preference is higher than 0.5, then it has preference on Blu-ray, otherwise we assume that it prefers HD-DVD ().
Table 2. Firm’s technology relative preference.
In , firms preferring Blu-ray are plotted with dotted lines and those stand for HD-DVD are drawn with solid lines based on the result of the relative preference in the last year. Sony’s and Toshiba’s preferences were the highest for each side as Sony approached 1 and Toshiba stayed at 0. The rest of the firms showed weaker preference. An interesting point here is that major manufacturing firms such as Philips, LG Electronics, Hitachi, Thomson, Samsung, and Sharp were around 0.4 ∼ 0.6, which suggests a weak preference between HD-DVD and Blu-ray. Most firm’s preferences tended to remain the same, except the preference of Samsung and Funai started to change beginning in 2005.
Figure 11. Firm’s relative preference.
Since the standards battle between HD-DVD and Blu-ray was a competition between two associations rather than individual firms, the firms’ positions should be determined. In order to observe the annual changes in the game theory model, we classified firms by their relative preference by year. Based on the firm’s position, we used the average value of relative preferences of each member rather than the summation to get a value between 0 and 1. With these results, we derived the equilibriums for the game from 2002 to 2008 (). As you can see, choosing HD-DVD is a better choice for both sides until 2006. From 2007, a dual equilibrium emerges between HD-DVD and Blu-ray, but HD-DVD still showed greater pay-offs for both sides. However, interesting changes in pay-offs were found for both sides. Although choosing HD-DVD is better option for both sides under this rubric, HD-DVD’s pay-off started to decrease whereas Blu-ray’s pay-off remained the same. In 2002, the pay-offs for the players who preferred HD-DVD at equilibrium was 3.536 and decreased to 2.614 in 2008 where as Blu-ray side’s pay-offs stayed constant. This implies that even though the technological equilibrium continuously settled on HD-DVD, there was a significant change in firm’s technology preference.
Table 3. Game theory result.
6. Conclusion
Due to the importance of technology standards, various approaches were proposed to analyze the values and effects of the standards (Shin, Kim, and Hwang Citation2015), but, they have shown limitations of analyzing technological factors and collecting quantifiable data. This study presented a new standardisation framework using a model that combines network analysis and game theory with consideration of dynamics. As an empirical case, we analyzed the standards war between HD-DVD and Blu-ray and found the results to be consistent with the actual process of standardisation.
Technically, HD-DVD showed greater advantages than Blu-ray. This should be expected because HD-DVD derived its advantage from previous DVD technology and many firms already had technological capacity for it. During the standardisation process, none of the firms showed a clear preference for a particular technology except for Toshiba and Sony. Although major firms belonged to either the HD-DVD Promotion Group or Blu-ray Disc Association, most of firms’ preferences fluctuated or stayed near the middle position by pursuing two technologies at the same time. This implies that dual strategy was the most preferred strategy for most players in order to lower the risk of choosing the wrong side. One surprising result was that equilibrium still favoured HD-DVD in 2008, despite HD-DVD Promotion Group deciding to withdraw in that year. This does not mean that this framework is not valid, because this game theory result only applies to technological aspects of standards. In other words, even though they decided not to promote HD-DVD anymore, choosing HD-DVD was still the better technical choice for the players in 2008. However, we still observe changes in firms’ preferences and decrease in pay-offs for HD-DVD as a consequence of preference shifts from HD-DVD to Blu-ray.
The main contribution of this research is that it validated this framework as an effective tool for analyzing technology standardisation. Decision making on technology strategy is important for a firm’s performance (Bergek, Berggren, and Tell Citation2009). Because of limited information, it is very difficult to diagnose the current situation or foresee the result of the standardisation process. Since patent competitiveness can be used to evaluate a firm’s strategic position in a technological area (Yoon and Phaal Citation2013), this framework provides strategic information for corporate activities by analyzing technology competitiveness (TC), technology attractiveness (TA), technology preference (θ), and technology differentiation (d) with patent data. Moreover, the consideration of dynamics advanced this framework ability to analyze a firm’s technological strategy and to derive implications in the study of standardisation. Overall, this framework can be used to observe the paradigm shift of standards among players and reducing the uncertainties and risks during the standardisation for the foresight studies of firms and governments.
Nevertheless, this study has limitations. First, since each firm’s preference of technology is from separate networks, comparing two individual preferences on different technology may require additional study. If the size of the network is not controlled, a technology with a large network may overestimate network index value. In this sense, normalisation might provide a better solution to control the network size, however, we concluded that network size should be considered an important decision factors for standardisation. Therefore, implementing weights for each network indices must be further discussed. Second, additional empirical case studies are needed. Although this empirical case is a representative of the standards war, more reviews on empirical cases are needed for consistency.
Disclosure statement
No potential conflict of interest was reported by the authors.
Notes on contributors
Keungoui Kim is a Ph.D. candidate for Technology Management, Economics and Policy Program at Seoul National University in Korea. Prior to this, he studied mechanical engineering and electric control engineering at Handong Global University in Korea and worked for Hyundai Motors as an engineering researcher. His research interests are technology standard, IT policy, and science and technology innovation strategies.
Sungdo Jung is a senior researcher at the Department of Policy Research in Korea Engineering and consulting Association. He received his B.S degree in electrical engineering from the Korea Advanced Institute of Science and Technology (KAIST) in Korea and majored economics in Ph.D. for Technology Management, Economics and Policy Program at Seoul National University in Korea. His research interests are science and technology policy such as technology innovation and convergence, R&D management.
Junseok Hwang is a tenured full professor for Technology Management, Economics and Policy Program at Seoul National University in Korea. He is also the director of the International IT Policy Program (ITPP) and chairman of the Green Smart Development Vision (GSDV) conference. His interdisciplinary research spans information science and technology policy, network economics, performance efficiency and creativity modelling.
Ahreum Hong is a professor at Graduate school of Technology Management, Kyung Hee University. She received her Ph.D. degree in Technology Management, Economics and Policy Program at Seoul National University in Korea. Her research interests are internet communication technology policy such as media innovation and convergence, global Knowledge management.
ORCID
Keungoui Kim http://orcid.org/0000-0002-0839-8813
Sungdo Jung http://orcid.org/0000-0001-5883-4313
Junseok Hwang http://orcid.org/0000-0003-2415-1711
Ahreum Hong http://orcid.org/0000-0001-6625-2110
References
- Amatulli, C., T. Caputo, and G. Guido. 2011. “Strategic Analysis through the General Electric/Mckinsey Matrix: An Application to the Italian Fashion Industry.” International Journal of Business and Management 6 (5): 61–75. doi: 10.5539/ijbm.v6n5p61
- Angulo, J., J. Calzada, and A. Estruch. 2011. “Selection of Standards for Digital Television: The Battle for Latin America.” Telecommunications Policy 35 (8): 773–787. doi: 10.1016/j.telpol.2011.07.007
- Arthur, W. B. 1989. “Competing Technologies, Increasing Returns, and Lock-in by Historical Events.” Journal of Econometrics, 99 (394): 116–131.
- Bekkers, R., R. Bongard, and A. Nuvolari. 2011. “An Empirical Study on the Determinants of Essential IPR Claims in Compatibility Standards.” Research Policy 40 (7): 1001–1015. doi: 10.1016/j.respol.2011.05.004
- Belleflamme, P. 1998. “Adoption of Network Technologies in Oligopolies.” International Journal of Industrial Organization 16 (4): 415–444. doi: 10.1016/S0167-7187(98)00003-4
- Berg, S. V. 1988. “Duopoly Compatibility Standards with Partial Cooperation and Standards Leadership.” Information Economics and Policy 3 (1): 35–53. doi: 10.1016/0167-6245(88)90013-3
- Bergek, A., C. Berggren, and F. Tell. 2009. “Do Technology Strategies Matter? A Comparison of Two Electrical Engineering Corporations, 1988–1998.” Technology Analysis and Strategic Management 21 (4): 445–470. doi: 10.1080/09537320902818744
- Berger, F., K. Blind, and N. Thumm. 2012. “Filing Behavior Regarding Essential IPRs in Industry Standards.” Research Policy 41 (1): 216–225. doi: 10.1016/j.respol.2011.07.004
- Bresnahan, T. F., and S. Greenstein. 1996. “Technical Progress and Co-Invention in Computing and in the Uses of Computers.” Brookings Papers on Economic Activity, Microeconomics 47 (1): 1–77. doi: 10.2307/2534746
- Chang, S. C. W., and H. Huang. 2016. “Institutional Logics, Work and Outcomes: The Case of Soy and Toshiba in the HD Optical Disc Standard War.” The Journal of High Technology Management Research 27 (1): 37–52. doi: 10.1016/j.hitech.2016.04.004
- Choi, E., and K. C. Lee. 2016. “Relationship Between Social Network Structure Dynamics and Innovation: Micro-Level Analyses of Virtual Cross-Functional Teams in a Multinational B2B Firm.” Computers in Human Behavior 65: 151–162. doi: 10.1016/j.chb.2016.08.021
- Crepon, B., E. Duguet, and J. Mairesse. 1998. “Research, Innovation, and Productivity: An Econometric Analysis at the Firm Level.” Economics of Innovation and New Technology 7 (2): 115–158. doi: 10.1080/10438599800000031
- Curran, C., and J. Leker. 2011. “Patent Indicators for Monitoring Convergence: Examples from NFF and ICT.” Technological Forecasting and Social Change 78 (2): 256–273. doi: 10.1016/j.techfore.2010.06.021
- Dyson, R. G. 2004. “Strategic Development and SWOT Analysis at the University of Warwick.” European Journal of Operational Research 152: 631–640. doi: 10.1016/S0377-2217(03)00062-6
- Egbetokun, A. A. 2015. “The More the Merrier? Network Portfolio Size and Innovation Performance in Nigerian Firms.” Technovation 43-44: 17–28. doi: 10.1016/j.technovation.2015.05.004
- Farrell, J., and G. Saloner. 1985. “Standardization, Compatibility and Innovation.” The RAND Journal of Economics 16: 70–83. doi: 10.2307/2555589
- Farrell, J., and G. Saloner. 1992. “Converters, Compatibility, and the Control of Interfaces.” The Journal of Industrial Economics 40 (1): 9–35. doi: 10.2307/2950625
- Funk, J. L., and D. T. Methe. 2001. “Market- and Committee-Based Mechanisms in the Creation and Diffusion of Global Industry Standards: The Case of Mobile Communication.” Research Policy 30 (4): 589–610. doi: 10.1016/S0048-7333(00)00095-0
- Gallagher, S. R. 2012. “The Battle of the Blue Laser DVDs: The Significance of Corporate Strategy in Standards Battles.” Technovation 32 (2): 90–98. doi: 10.1016/j.technovation.2011.10.004
- Gandal, N. 1994. “Hedonic Price Indexes for Spreadsheets and Empirical Test for Network-Externalities.” The RAND Journal of Economics 25 (1): 160–170. doi: 10.2307/2555859
- Geum, Y., C. Kim, S. Lee, and M. S. Kim. 2012. “Technological Convergence of IT and BT: Evidence from Patent Analysis.” ETRI Journal 34 (3): 439–449. doi: 10.4218/etrij.12.1711.0010
- Hartman, R. S., and D. J. Teece. 1990. “Product Emulation Strategies in the Presence of Reputation Effects and Network Externalities: Some Evidence from Minicomputer Industry.” Economics of Innovation and New Technology 1 (1-2): 157–182. doi: 10.1080/10438599000000009
- Hovav, A., M. Hemmert, and Y. J. Kim. 2011. “Determinants of Internet Standards Adoption: The Case of South Korea.” Research Policy 40 (2): 253–262. doi: 10.1016/j.respol.2010.09.016
- Hovav, A., R. Patnayakuni, and D. Schuff. 2004. “A Model of Internet Standards Adoption: The Case of IPv6.” Information Systems Journal 14 (3): 265–294. doi: 10.1111/j.1365-2575.2004.00170.x
- Hovav, A., and D. Schuff. 2005. “The Changing Dynamics of the Internet: Adoption Patterns of the IPv6 Standard.” Communications of AIS 15: 242–262.
- Jost, L. 2006. “Entropy and Diversity.” OIKOS 113 (2): 363–375.
- Kaa, G., J. Ende, H. J. Vries, and E. Heck. 2011. “Factors for Winning Interface Format Battles: A Review and Synthesis of the Literature.” Technological Forecasting and Social Change 78 (8): 1397–1411. doi: 10.1016/j.techfore.2011.03.011
- Kaa, G., and H. J. Vries. 2015. “Factors for Winning Format Battles: A Comparative Case Study.” Technological Forecasting & Social Change 91 (2): 222–235.
- Kang, B., and K. Motohashi. 2015. “Essential Intellectual Property Rights and Inventors’ Involvement in Standardization.” Research Policy 44 (2): 483–492. doi: 10.1016/j.respol.2014.10.012
- Kelly, K. 1998. New Rules for the New Economy: Ten Radical Strategies for a Connected World. New York: Penguin Books.
- Kim, K., S. Jung, and J. Hwang. 2015. “A Study on Technology Standardization Method Using Network Analysis: Focused on Wireless Communication Technology Layer of Internet of Things.” Journal of Technology Innovation 23 (3): 43–66.
- Monge, P. R., and N. S. Contractor. 2003. Theories of Communication Networks. New York: Oxford University Press.
- Nickerson, J. V., and M. Z. Muehlen. 2006. “The Ecology of Standards Processes: Insights from Internet Standard Making.” MIS Quarterly 30: 467–488. doi: 10.2307/25148769
- Ohashi, H. 2003. “The Role of Network Effects in the US VCR Market, 1978–1986.” Journal of Economics & Management Strategy 12 (4): 447–494. doi: 10.1162/105864003322538929
- Park, Y., and J. Yoon. 2017. “Application Technology Opportunity Discovery From Technology Portfolios: Use of Patent Classification and Collaborative Filtering.” Technological Forecasting and Social Change 118: 170–183. doi: 10.1016/j.techfore.2017.02.018
- Rogers, E. M. 1983. Diffusion of Innovations. New York: The Free Press.
- Rysman, M., T. Simcoe, and C. Heath. 2008. “Patents and the Performance of Voluntary Standard-Setting Organizations.” Management Science 54 (11): 1920–1934. doi: 10.1287/mnsc.1080.0919
- Schilling, M. A. 2002. “Technology Success and Failure in Winner-Take-All Markets: The Impact of Learning Orientation, Timing, and Network Externalities.” The Academy of Management Journal 45 (2): 387–398. doi: 10.2307/3069353
- Scott, J. 2003. Social Network Analysis. 2nd ed. London: Sage Publications.
- Shankar, V., and B. L. Bayus. 2003. “Network Effects and Competition: An Empirical Analysis of the Video Game Industry.” Strategic Management Journal 24 (4): 375–384. doi: 10.1002/smj.296
- Shapiro, C., and H. R. Varian. 1999. Information Rules: A Strategic Guide to the Network Economy. Cambridge, MA: Harvard Business School Press.
- Shin, D., H. Kim, and J. Hwang. 2015. “Standardization Revisited: A Critical Literature Review on Standards and Innovation.” Computer Standards and Interfaces 38: 152–157. doi: 10.1016/j.csi.2014.09.002
- Suzuki, J., and F. Kodama. 2004. “Technological Diversity of Persistent Innovators in Japan.” Research Policy 33 (5): 531–549. doi: 10.1016/j.respol.2003.10.005
- Tassey, G. 2000. “Standardization in Technology-Based Markets.” Research Policy 29 (4-5): 587–602. doi: 10.1016/S0048-7333(99)00091-8
- Tseng, C. Y., S. C. Lin, D. C. Pai, and P. C. Tung. 2016. “The Relationship between Innovation Network and Innovation Capability: A Social Network Perspective.” Technology Analysis and Strategic Management 28 (9): 1029–1040. doi: 10.1080/09537325.2016.1181739
- Wasserman, S., and K. Faust. 1994. Social Network Analysis: Methods and Applications. New York: Cambridge University Press.
- Weitzel, T. 2004. Economics of Standards in Information Networks. New York: Physica-Verlag.
- Xie, Z., J. Hall, I. P. McCarthy, M. Skitmore, and L. Shen. 2016. “Standardization Efforts: The Relationship Between Knowledge Dimensions, Search Processes and Innovation Outcomes.” Technovation 48-49: 69–78. doi: 10.1016/j.technovation.2015.12.002
- Xue, X., X. Zhanag, L. Wang, M. Skitmore, and Q. Wang. 2017. “Analyzing Collaborative Relationships among Industrialized Construction Technology Innovation Organizations: A Combined SNA and SEM Approach.” Journal of Cleaner Production 147: 1–9. doi: 10.1016/j.jclepro.2017.01.072
- Yoon, B., and R. Phaal. 2013. “Structuring Technological Information for Technology Roadmapping: Data Mining Approach.” Technology Analysis and Strategic Management 25 (9): 1119–1137. doi: 10.1080/09537325.2013.832744