
ABSTRACT
Comparative empirical evidence for 22 OECD countries shows that country differences in cumulative mortality impacts of SARS-CoV-2 are caused by weaknesses in public health competences, pre-existing variances in structural socio-economic and public health vulnerabilities, and the presence of fiscal constraints. Remarkably, the (fiscally non-constrained) U.S. and the U.K. stand out, as they experience mortality outcomes similar to those of fiscally-constrained countries. High COVID19 mortality in the U.S. and the U.K. is due to pre-existing socio-economic and public health vulnerabilities, created by the following macroeconomic policy errors: (a) a deadly emphasis on fiscal austerity (which diminished public health capacities, damaged public health and deepened inequalities); (b) an obsessive belief in a trade-off between ‘efficiency’ and ‘equity’, which is mostly used to justify extreme inequality; (c) a complicit endorsement by mainstream macro of the unchecked power over monetary and fiscal policy-making of global finance and the rentier class; and (d) an unhealthy aversion to raising taxes, which deceives the public about the necessity to raise taxes to counter the excessive liquidity preference of the rentiers and to realign the interests of finance and of the real economy. The paper concludes by outlining a few lessons for a saner macroeconomics.
1. Introduction
This is the age of consequences: the outbreak of SARS-CoV-2 instantly exposed the inability of governing institutions to contain the epidemic, the inadequacy of public health systems (broken by decades of fiscal austerity) and the sharp economic and health inequalities and social fragmentation in society. SARS-CoV-2 has clinically uncovered our societies’ pre-existing structural weaknesses — most of which are due to the mistaken neoliberal macroeconomic policies pursued ever since the early 1980s (Marmot Citation2020a, Citation2020b; Woolhandler et al. Citation2021). Nature cannot be fooled.
The results of four decades of neoliberal (mis-)management of the OECD economies are not a secret (Storm Citation2017): long-term growth is declining (‘secular stagnation’), suffocated by rising inequalities in income and wealth and by an obsessive-compulsive fiscal austerity by governments, but barely kept alive by rising (private and public) indebtedness and quasi-permanent asset-price bubbles (‘financialization’). This neoliberal model suffered a first near-death experience in 2008, in the form of the Global Financial Crisis of 2008 and the ensuing not so Great Recession. But it rather miraculously survived, helped by massive support of governments and central banks and more by luck than through skill. But in the process, it further toxified, and this strongly fuelled the growth of (mostly right-wing) populism, destabilising erstwhile stable democracies, notably Britain (‘Brexit’) and the U.S. (‘Trump’).
When we let the corona-virus enter our societies through the front-door in early 2020, the virus rapidly found a deadly path through pre-existing socio-economic inequalities and vulnerabilities, with individuals and families at the bottom of the social and economic scale, who were missing out already long before the health emergency, suffering proportionally more, losing their health, jobs, lives, food security and educational opportunities (Case and Deaton Citation2020; Deuschl et al. Citation2020; Marmot, Allen, and Goldblatt Citation2020b; Abedi et al. Citation2021; Islam et al. Citation2021; Woolhandler et al. Citation2021). As daily infections rose and death counts mounted, governments fitfully responded by imposing social distancing and lockdowns and by introducing (spending) measures to cushion the economic blow from the health emergency and provide lifelines for vulnerable households and businesses.
The scale of the intervention is unprecedented. Fiscal measures announced as of September 11, 2020, are estimated to equal $11.7 trillion globally (or close to 12% of global GDP). Half of these measures have consisted of additional spending, and the other half of liquidity support, including loans, guarantees, and equity injections by the public sector. These measures (excluding the contingent liabilities) and the worldwide recession have pushed global public debt to an all-time high of close to 100% of global GDP in 2020 (IMF Citation2020). The central banks of Britain, the Eurozone and the U.S. have facilitated the fiscal response by (in-)directly financing large portions (of often more than 50%) of their government’s debt build-up.Footnote1
Hence, after decades of market liberalism and fiscal fundamentalism, policymakers had no other option but to return to Keynes — or, more precisely, to ‘Emergency Keynesianism’. Pressed by the gravity of events, and going off the neoliberal script, the IMF (Citation2021) warns against ‘prematurely imposing austerity’, urging nations to ‘rethink’ their public finance rules rather than to rush to reduce their liabilities, arguing that most advanced economies can live with much higher levels of public debt after the coronavirus crisis, at least for as long as interest rates are close to zero (Giles Citation2021b).Footnote2 Predictably, the IMF’s new stance is creating a strong push-back from heavyweights from Wall Street and mainstream academia who, pointing to the growing risks of rising inflation, are questioning the IMF’s view that growing public debts and deficits do not pose immediate threats. While this debate is important, I believe there are bigger, more structural, lessons to be learned from the SARS-CoV-2 crisis — lessons which would require us to abandon the mistaken neoliberal macro policies which brought us here in the first place. Before proceeding to drawing out these lessons, let me first consider major stylised facts, based on empirical evidence for a sample of 22 OECD countries (all appearing in and the Appendix).
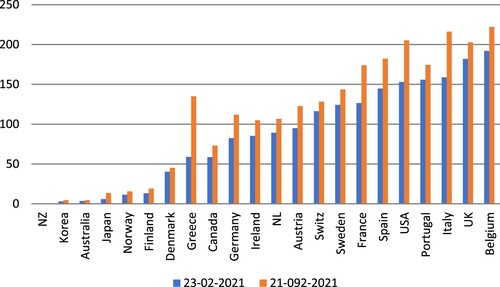
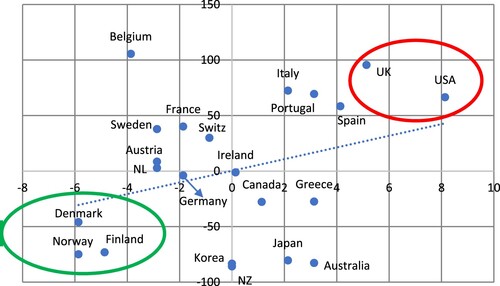
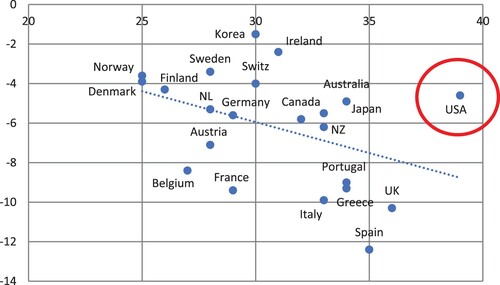
Figure 1. Cumulative confirmed COVID-19 deaths per 100,000 population (data up to February 23, 2021 and up to September 21, 2021).
Source: Johns Hopkins University & Medicine, Coronavirus Resource Centre (https://coronavirus.jhu.edu/data/mortality). NL = The Netherlands; NZ = New Zealand; Switz = Switzerland. The same in all subsequent figures. See (Appendix).
2. Stylised Facts
About 12 months after the beginning of the public health emergency, on February 23rd 2021, global cumulative confirmed SARS-CoV-2 mortality amounted to 2.48 million. Seven months later, on September 21st 2021, the global death count has increased to more than 4.70 million. Out of these 2.48 (4.70) million confirmed corona-virus deaths worldwide, 43% (30%), occurred in the panel of 22 OECD countries, listed in . Two countries — the U.S. and the U.K. — account for close to 60% of reported COVID-19 deaths in the panel countries, yet they account for less than 40% of the total population of around one billion persons in the sample. As is shown in , the relative cumulative mortality impacts of COVID-19 vary greatly between countries — from 0.5 deaths per 100,000 persons in New Zealand to more than 190 deaths per 100,000 persons in Belgium. The U.S. and the U.K. have 149 and 178 deaths per 100,000 persons in their respective populations (on 23-02-2021).Footnote3
These differential impacts are to some extent due to ‘geography’, as island nations such as Australia, Japan and New Zealand are better able to tighten border checks (including imposing quarantine measures) in order to stem the spread of SARS-CoV-2 than land-locked nations in Europe and North-America, but geography does not explain the observed differences completely. This is illustrated by the relatively high COVID-19 mortality rates in island nations such as Ireland and particularly the U.K. Hence, as I will argue below, more important than ‘geography’ have been three other factors: (1) differences in public health competence; (2) variances in structural socio-economic vulnerabilities to SARS-CoV-2; and (3) the presence or absence of fiscal constraints.
2.1. The Public Health Response
OECD governments differ considerably in the level of public-health competence with which they have responded to SARS-CoV-2. For instance, according to the Lancet commission on ‘Public Policy and Health in the Trump Era’, around 200,000 fewer Americans would have died from the coronavirus if the U.S. had treated SARS-CoV-2 with the same level of public health competence that its peer developed nations have demonstrated (Woolhandler et al. Citation2021).Footnote4
This is clear from . If COVID-19 mortality (per 100,000 population) in the U.S. were the same as mortality (per 100,000) in, for instance, Germany, the cumulative number of American COVID-19 deaths would have been 47% lower than it actually is — which would have meant 230,000 fewer deaths. As the Lancet commission concludes:
Many of the cases and deaths were avoidable. Instead of galvanising the US populace to fight the pandemic, President Trump publicly dismissed its threat (despite privately acknowledging it), discouraged action as infection spread, and eschewed international cooperation. His refusal to develop a national strategy worsened shortages of personal protective equipment and diagnostic tests. President Trump politicised mask-wearing and school re-openings and convened indoor events attended by thousands, where masks were discouraged and physical distancing was impossible. (Woolhandler et al. Citation2021, p. 711).
Figure 2. Scatterplot of additional public spending versus cumulative confirmed COVID-19 deaths per 100,000 population.
Sources: Data on additional (discretionary) public spending (as percentage of GDP, until January 2021) are from the IMF (Citation2020) October 2020 Fiscal Monitor Database of Fiscal Measures in response to COVID-19; data on COVID-19 mortality are from Johns Hopkins University & Medicine, Coronavirus Resource Centre (https://coronavirus.jhu.edu/data/mortality); data up to February 23, 2021. Notes: (1) average additional public spending (as percentage of GDP) is 7.2% for the panel of 22 OECD countries; the figure reports country-wise deviations from this average; (2) the unweighted average cumulative confirmed COVID-19 mortality is 86.4 deaths per 100,000 population for the panel of 22 OECD economies; the figure reports deviations from this average. (3) the estimated linear relationship is negative and statistically significant at 2.5% (when I exclude the observations for the U.K. and the U.S. from the regression).
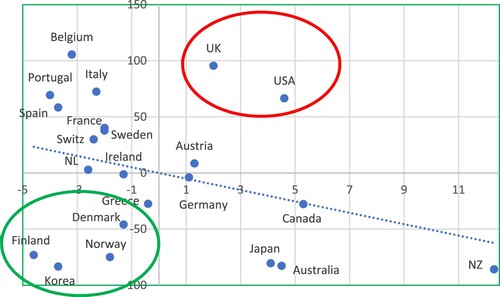
Of particular interest are those countries which are located far off the regression line. One group, including Denmark, Finland, Norway and South Korea, experienced significantly below-average COVID-19 mortality, while incurring below-average additional spending on relief measures. These countries appear to have managed the health emergency comparatively well (so far) in terms of both public health and public finances (focussing on ‘crushing the curve’ rather than ‘flatten the curve’). The same cannot be said for the other group which includes the U.K. and the U.S. Both Anglo-Saxon economies experienced significantly above-average COVID-19 death rates, despite incurring considerable above-average additional relief expenditures. The Johnson government and the Trump administration thus stand out for their expensive mismanagement of the public health emergency — both in terms of lives and taxpayers’ costs (Marmot, Allen, and Goldblatt Citation2020b; Woolhandler et al. Citation2021).
Before proceeding further, I have to make three methodological caveats. First, since I am looking at cumulative confirmed COVID-19 deaths (during the year from February 2020–February 23, 2021) across 22 OECD countries, I am — implicitly — using a space–time statistical model. My assumption is that the differences in cumulative mortality rates are unlikely to change considerably in the future (see the Appendix), and therefore can be read as ‘structural outcomes’ that are caused by differences in structural economic and social conditions; as a result, I will not explicitly deal with the time-dimension of the data. Second, my working hypothesis is that the data on cumulative confirmed COVID-19 deaths per country do give a correct picture of the health impact in that country. However, there are valid concerns that reported COVID-19 deaths are underestimating the true impact of the coronavirus on mortality by (around) 20–25%. In the Appendix, I compare cumulative confirmed COVID-19 deaths and excess deaths for 15 OECD countries and find that the two measurements are strongly correlated. I am confident, therefore, that the relative differences in mortality impacts are robust with respect to the method of registration (with the only exception of Belgium, as I explain below). Finally, it is possible that country-wise cumulative mortality impacts will change over time, for instance because of differences in progress made with vaccinations. However, in the Appendix I show that the relative country-wise COVID-19 mortality rates did not change significantly during February–September 2021 (see and ).
Returning to , the key factor in the mismanagement of the COVID-19 crisis has been the delayed, reactive, politicised and/or muddled (‘on-off’) public-health response to the health emergency, often out of fear, and encouraged by conservative media outlets and major business figures, that ‘lockdowns don’t work’ or that ‘the economic and public health damages from a lockdown are as bad or worse than those inflicted by the virus they are meant to stave off.’ The evidence is quite clear, however: countries that most consistently prioritised the public health emergency experienced the smallest economic damage, whereas countries that procrastinated, postponing interventions, re-opened prematurely, and mis-managed COVID-19 abatement are suffering the highest economic and public health damages (Alveda, Ferguson, and Mallery Citation2020).
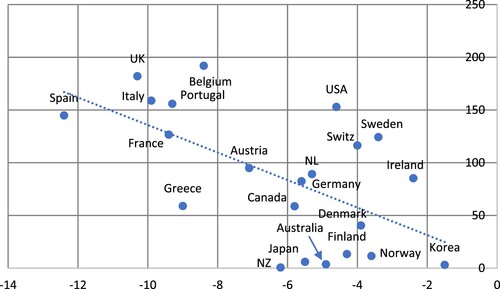
underscores this conclusion. I plot the (negative) change in real GDP during 2019–2020 for each of the 22 OECD countries against COVID-19 deaths per 100,000 population in each country. The chart can be read as a rough representation of how well each country has protected the health of its citizens versus the macroeconomic cost of doing so. There is a clear and statistically significant negative correlation between the depth of the recession and the average number of COVID-19 deaths. The U.K., Spain, Italy, Portugal and France all suffered excess mortality and above-average slumps in real GDP, whereas Denmark, Finland, Norway and also Germany experienced below-average mortality and below-average recessions. The U.K. is probably the clearest example of how a country can end up in the worst possible outcome due to a half-baked, reactive, and politicised policy response. It follows that there is no inescapable trade-off between ‘saving the economy’ versus ‘saving the people’, because outcomes depend on the quality and the consistency of public health interventions and of macroeconomic management.
Figure 3. Scatterplot of change in real GDP during 2019–2020 versus cumulative confirmed COVID-19 deaths per 100,000 population.
Sources: data on change in real GDP during 2019–2020 are from AMECO Database; data on COVID-19 mortality are from Johns Hopkins University & Medicine, Coronavirus Resource Centre (https://coronavirus.jhu.edu/data/mortality); data up to February 23, 2021. Notes: (1) the (unweighted) average decline in real GDP for the panel of 22 OECD economies is 6.2%; the figure reports country-wise deviations from this average; (2) the unweighted average cumulative confirmed COVID-19 mortality is 86.4 deaths per 100,000 population for the panel of 22 OECD economies. (3) the estimated linear relationship is negative and statistically significant at 1%.
The Scandinavian countries Denmark, Finland and Norway are telling examples of how pro-active and consistent policy responses (including social distancing, mask wearing, test-trace-and-isolate policies and classic isolation/quarantine of individuals and communities to stop transmission) carry the lowest cost in terms of public health and public finances. The contrast in outcomes between Denmark, Finland and Norway on the one hand, and Sweden, known for its more lenient approach and silent resignation to mass infections, on the other hand, is illustrative: Sweden’s GDP decline of 3.4% is lower but still comparable to the real GDP declines in Denmark (−3.9%), Finland (−4.3%) and Norway (−3.6%), but Swedish cumulative COVID-19 mortality rate is more than 3 times higher than that of Denmark, more than 9 times higher than that of Finland, and 11 times higher than that of Norway.
2.2. Structural Differences in Socio-Economic Vulnerabilities
The disturbing truth is that the excessive COVID-19 deaths in the U.K. and the U.S. occurred despite excessive relief spending, because of deep and long-standing flaws in British and American economic, health, and social policies. These structural flaws were evident, well before SARS-CoV-2 arrived, in stagnating longevity — which throughout history has signalled grave societal problems (Woolhandler et al. Citation2021) — and also in the chronically widening gaps in mortality across social classes, ethnic groups and geography (Abedi et al. Citation2021; Islam et al. Citation2021; Liao and De Maio Citation2021). The COVID-19 health emergency is reinforcing these long-standing economic and health inequities, often driven by racially patterns of disparities in housing, income and wealth, employment, and social and political rights.Footnote6 COVID-19 deaths, hospitalisations and cases have disproportionately affected Black, Latino and Indigenous people, who carry a greater burden of chronic diseases from living in disinvested communities with poor food options, poisoned air quality, and have less access to health care (Tan et al. Citation2021). American Indian or Alaska Native people have died at 2.4 times the rate of white people, Black people at 1.9 times the rate and Latino people at 2.3 times the rate, according to the CDC. Excess mortality rates are even worse for these groups. People of colour are more infected, because they are more exposed and less protected — and face more challenges to get a diagnostic test.
plots the percentage change in life expectancy at birth (for the total population) during 2014–2018 against the number of cumulative confirmed COVID-19 deaths (per 100,000 population). The U.S. stand out for experiencing the largest decline in life expectancy (by 0.38%) during these years. In addition to the U.S., only the U.K. (−0.06%) and Germany (−0.24%) experienced declines in life expectancy — longevity increased in all other OECD countries, with the largest relative gains in life expectancy occurring in Finland (+0.68%), Japan (+0.75%), Norway (+0.80%), Korea (+1.11%) and Ireland (+1.12%). Changes in life expectancy are negatively correlated with cumulative confirmed COVID-19 deaths — and the correlation is statistically significant at 1%. The chart can thus be read as a rough indication of how strongly long-standing economic and health inequities have reinforced the COVID-19 health emergency.
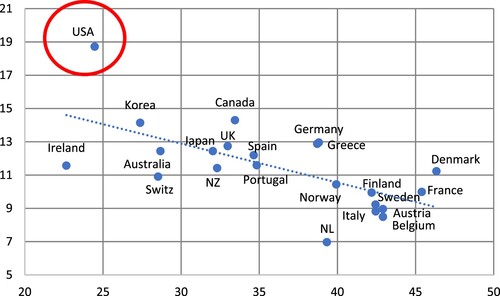
Figure 4. Scatterplot of percentage change in life expectancy (2014-2018) versus cumulative confirmed COVID-19 deaths per 100,000 population.
Sources: data on percentage change in life expectancy at birth (total population) during 2014–2018 are from World Bank’s World Development Indicators (https://data.worldbank.org/indicator/SP.DYN.LE00.IN?name_desc=false); data on COVID-19 mortality are from Johns Hopkins University & Medicine, Coronavirus Resource Centre (https://coronavirus.jhu.edu/data/mortality); data up to February 23, 2021. Notes: (1) the average percentage change in life expectancy at birth (total population) during 2014–2018 was 0.38% for the 22 OECD countries; (2) the unweighted average cumulative confirmed COVID-19 mortality is 86.4 deaths per 100,000 population for the panel of 22 OECD economies; (3) the estimated linear relationship is negative and statistically significant at 1%.
In general, structurally more unequal societies are hit harder by SARS-CoV-2 than more egalitarian societies. The reason is that economically under-privileged groups in more unequal countries are disproportionately more exposed to and vulnerable to the virus (Marmot, Allen, and Goldblatt Citation2020b; Abedi et al. Citation2021). As argued by the Lancet commission, this holds particularly true for the U.S.: Americans are — on average — more vulnerable to the virus, because their (average) health was hurtling ‘on a downward trajectory’ already long before Trump took office and SARS-CoV-2 arrived (Woolhandler et al. Citation2021, p. 707). In the U.S., most of those problems revolve around the long-standing and staggering inequality in incomes and health. Since the 1980s, the Lancet commission details, ‘the disparity between social and economic classes has widened’ as unions were crushed, automation and globalisation destructed high-paying jobs by fissuring the workplace, and tax and social policies have ‘increasingly favoured the wealthy’ (Woolhandler et al. Citation2021, p. 707) ‘The suffering and dislocation inflicted by COVID-19,’ the Lancet commission sums up, ‘has exposed the frailty of the U.S. social and medical order’ (see also Islam et al. Citation2021).
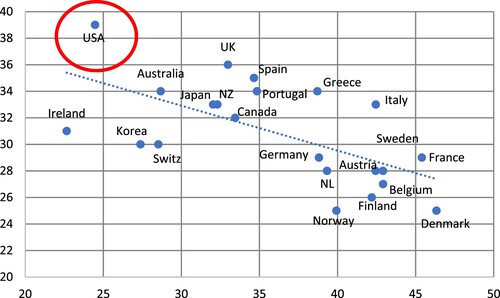
presents further evidence on the association between socio-economic inequality and COVID-19 deaths for our panel of 22 OECD countries. On the horizontal axis, I measure the difference between the Gini coefficient of (after-tax-and-transfer) income distribution of each country and the panel-average Gini coefficient. On the vertical axis, I measure the difference between COVID-19 deaths per 100,000 population in each country and the panel-average COVID-19 mortality rate. The U.S. and the U.K. find themselves in the upper-right quadrant of the graph, which means that they have above-average income inequality as well as above-average COVID-19 mortality. Likewise, Spain, Portugal and Italy are clear cases of above-average inequality and above-average mortality.
Figure 5. Scatterplot of (after-tax-and-transfer) inequality (Gini) versus cumulative confirmed COVID-19 deaths per 100,000 population.
Sources: Gini-coefficients are from OECD Data (https://data.oecd.org/inequality/income-inequality.htm); data on COVID-19 mortality are from Johns Hopkins University & Medicine, Coronavirus Resource Centre (https://coronavirus.jhu.edu/data/mortality); data up to February 23, 2021. Notes: (1) the average (after-tax-and-transfer) Gini coefficient for the panel of 22 OECD economies is 30.9; the figure reports country-wise deviations from this average; (2) the unweighted average cumulative confirmed COVID-19 mortality is 86.4 deaths per 100,000 population for the panel of 22 OECD economies; the figure reports deviations from this average. (3) the estimated linear relationship is positive and statistically significant at 2.5% (when I exclude the observations for Belgium from the regression).
Countries including Denmark, Norway, Finland and also Germany are located in the lower-left quadrant, as they feature below-average income inequality and below-average COVID-19 mortality. Australia, Canada, Japan and Greece recorded below-average corona-mortality but have above-average income inequality. The continental European countries Austria, France, the Netherlands, Sweden, and Switzerland have below-average inequality but above-average COVID-19 mortality (albeit considerably lower than the mortality rates of the U.K. and the U.S.). Belgium is an outlier in , having low inequality but the highest COVID-19 mortality; the reason for Belgium’s exceptionalism may lie in the fact that Belgian public health authorities are reporting not only confirmed cases (which are mostly hospital deaths) but also suspected cases (such as deaths in the community, especially in care homes). We must therefore keep in mind that Belgium’s (arguably more realistic) recorded death rate is not strictly comparable to death rates recorded in the other countries in the panel (see and the discussion in the Appendix).
2.3. Fiscal Constraints
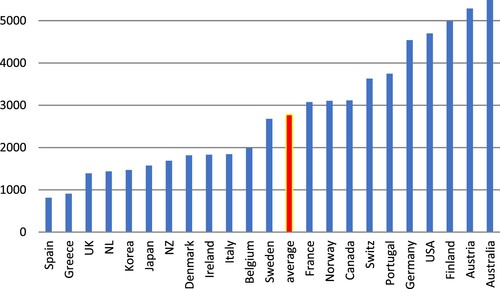
Cumulative public relief spending to cushion the negative impacts of the health emergency for households and vulnerable businesses (recorded until January 2021) varies €815 per person in Spain and €5490 per capita in Australia (see ). Average cumulative relief spending is €2778 for the 22 OECD economies in the panel. On a per-capita basis, Germany and Finland did spend more than 5 times as much on COVID-19 relief than Greece and Spain, and more than 2½ as much as Italy.Footnote7 Differences in per-capita relief spending are not always due to fiscal constraints (facing governments), as is shown by Denmark, Korea and New Zealand which all have below-average per-person relief funding in combination with relatively low COVID-19 death rates (see ).
Figure 6. Additional public spending on COVID-19 relief (in euro’s & until January 2021).
Sources: Data on additional public spending, until (January 2021) are from the IMF (Citation2020) October 2020 Fiscal Monitor Database of Fiscal Measures in response to COVID-19; data on GDP and population are from AMECO database.
But in countries such as France, Spain, and Italy, where per-capita spending was relatively low and COVID-19 mortality relatively high, the fiscal capacity of government to raise spending to cushion the economic impact of the health emergency (especially for households and vulnerable businesses) was compromised — because these (already highly-indebted) governments had limited access to financial (bond) markets and no national lender-of-last-resort.
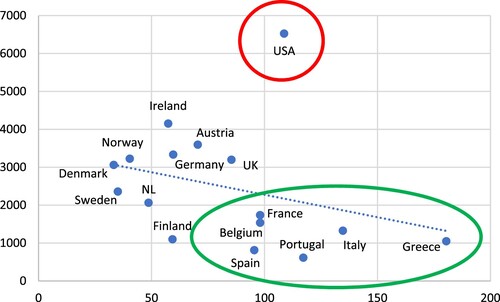
illustrates more directly which countries are facing fiscal constraints and which not. On the horizontal axis I plot the 2019 public debt-to-GDP ratio for the 22 countries and the vertical axis measures cumulative public COVID-19 relief spending per person (until January 2021). If I exclude the U.S. (which are a clear outlier), I find a statistically significant negative correlation between public debt and per-capita corona relief spending — which means that per-capita emergency spending is lower, the more highly indebted the country is. As shown by the figure, this holds true for Belgium, France, Greece, Italy, Portugal, and Spain, which are all — not coincidentally — heavily indebted Eurozone countries lacking monetary sovereignty. The U.S. are the exception, having an above-average public-debt-to-GDP ratio as well as the highest per-person COVID-19 relief spending. Due to its privilège exorbitant, the U.S. government faces no immediate fiscal restriction. (We have already seen above that despite the exorbitant relief spending, the U.S. COVID-19 death rate is among the highest in the panel.)
Figure 7. Scatterplot of public debt in 2019 (% of GDP) versus additional public spending on COVID-19 relief (euros per person).
Sources: Data on public debt in 2019 (as percentage of GDP) are from AMECO Database; data on additional public spending, until (January 2021) are from the IMF (Citation2020) October 2020 Fiscal Monitor Database of Fiscal Measures in response to COVID-19; data on GDP and population are from AMECO database. Note: the estimated linear relationship is negative and statistically significant at 1% (when I exclude the observations for the U.S.A. from the regression).
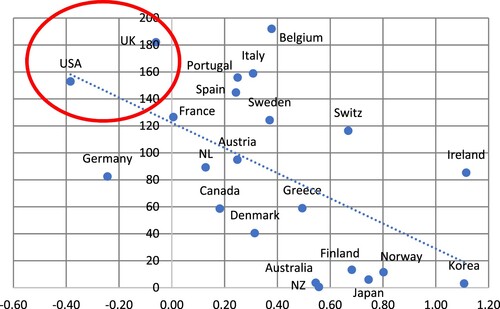
, finally, shows that the level of per-person public COVID relief spending matters for the public health outcome. plots cumulative per capita public relief spending (in euros) against cumulative confirmed COVID-19 deaths (per 100,000 population). The estimated linear relationship has a statistically significant negative slope: the higher the per-person relief, the lower the corona death rate. The U.S. are, again, a worrying outlier, combining the 2nd highest per capita relief spending and the 5th highest COVID-19 death rate.
Figure 8. Scatterplot of additional pubic spending on COVID-19 relief (euros per person) versus cumulative confirmed COVID-19 deaths per 100,000 population.
Sources: Data on additional public spending, until (January 2021) are from the IMF (Citation2020) October 2020 Fiscal Monitor Database of Fiscal Measures in response to COVID-19; data on GDP and population are from AMECO database. Data on COVID-19 mortality are from Johns Hopkins University & Medicine, Coronavirus Resource Centre (https://coronavirus.jhu.edu/data/mortality); data up to February 23, 2021. Note: the estimated linear relationship is negative and statistically significant at 2.5% (when I exclude the observations for the U.S.A. from the regression).
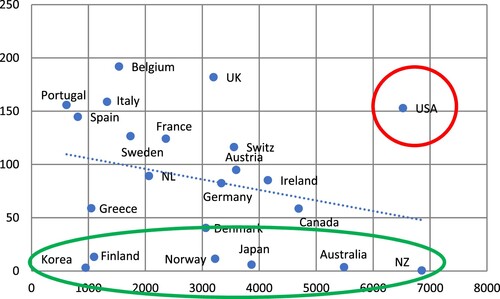
A closer look at reveals that six more countries — Korea, Finland, Norway, Japan, Australia and New Zealand — do not fit the negative relation between spending and mortality. Korea, Finland, Norway and Japan succeeded in containing COVID-19 deaths at low levels of per capita relief spending; Australia and New Zealand managed to protect public health as well, but with much higher levels of public spending (comparable to that of the U.S.) This reinforces the conclusion based on : the ‘quality’ of the public intervention matters, and pro-active and consistent public health responses did (so far) contain health impacts at manageable costs.
3. Lessons for the Age of Consequences
The negative impacts of the SARS-CoV-2 health emergency have been amplified by a longstanding failure of governance, which did not prioritise the conditions for good health; by the continuing increases in economic and social inequalities and poverty; by a perpetual policy of austerity and consequent cuts to funding of essential public services (including public health infrastructure) that were sharply regressive; and by a poor state of the health of the population. This holds true in particular for the U.S. and the U.K. which suffered high mortality outcomes similar to those of fiscally-constrained countries, although they are not fiscally constrained in their response to the public health crisis.
Now, with vaccines coming on stream, there is talk of getting back to ‘normal’. But the ‘normal’ that existed in February 2020 and before is neither normal nor acceptable. The COVID-19 health emergency must be taken as an opportunity to build a healthier, more resilient and therefore more equal society. This will be possible only if macroeconomists learn from their past mistakes and change — from being part of the problem to contributing to the solution. Here follow macro’s main failings. For reasons of space, I focus on the U.K. and U.S., the two economies suffering the most from pre-existing socio-economic inequalities and vulnerabilities and arguably hit hardest by SARS-CoV-2.
3.1. The Deadly Legacy of Austerity
The crisis exposed the hypocrisy of government-deficit hawks and balanced-budget conservatives (including many political ‘progressives’ and most mainstream macroeconomists). All of a sudden, the U.S. and U.K. governments could spare trillions of dollars and billions of pounds for companies big and small, as well as for helicopter drops of cash for households — spending that was earlier deemed unaffordable and out-of-bounds. Swiftly, governments presided over the largest peacetime spending bills in history — in reaction to the monumental failure by the same governments to prepare for the public-health calamity that had long been predicted. For generations, mainstream macroeconomists argued that governments do not have the money to pay for public services, provide healthcare, invest in our infrastructure, or provide income for seniors and low-income families. Just like a household, it was always argued, the government must balance its budget or else risk running up inflation and high levels of debt — and ultimately bankrupting the nation. What happened was the exact opposite: decades of fiscal austerity weakened economies and governments, created social and political fragmentation and, by aggravating economic and health inequalities, made populations significantly more vulnerable to the corona-virus.Footnote8
Let me consider Britain, the sixth largest economy in the world. Since 2010, the conservative-led British (coalition) government prioritised government deficit reduction above anything else. The public deficit was cut by deep (social) spending cuts (including on health care) and reductions in public-sector jobs (plus comparatively small tax increases) in order to boost ‘confidence’ of (financial) investors and hence promote investment and growth.Footnote9 The British ‘expansionary austerity’ measures were a comprehensive failure on their own terms, as they delivered little growth and failed to reduce the public debt-to-GDP ratio. The deep spending cuts did succeed in slowly reducing Britain’s public deficit (excluding interest payments) from 6.4% of GDP in 2010 to 0.2% of GDP in 2019, but British public debt continued its inexorable rise: from 74.4% of GDP in 2010 to more than 86% during 2015–17.
Economic stagnation, the rising cost of living, cuts to social security and public services, stagnating real incomes for 60% of the population, stalling social mobility, rising costs of housingFootnote10, and high household indebtedness created a deeply damaging situation in which millions British citizens are not just struggling to make ends meet, but also affected most by the mental health impacts of their precarious living conditions. Income inequality (measured in terms of the S80/S20, P90/P10, the Palma ratio and the share of the richest 1%, using ONS data) increased during 2011–2019.Footnote11 Bourquin, Joyce, and Norris Keiler (Citation2020, p. 5) of the Institute for Fiscal Studies (IFS) conclude:
The COVID-19 crisis hit at a time when income growth had already been extremely disappointing for some years. Median (middle) household income was essentially the same in 2018−19 (the latest data) as in 2015−16. This stalling itself came after only a short-lived recovery from the Great Recession. The combined effect had been a decade of unprecedented poor improvements in living standards, with average income before housing costs having grown less than over any other 10-year period since records began in 1961. [… .] Trends among low-income households had been worse still — they had experienced five years of real income stagnation between 2013−14 and 2018−19. This was entirely due to falls in income from working-age benefits and tax credits, which offset growth in employment incomes.
Workers whose livelihoods look most at risk during the COVID-19 crisis already tended to have relatively low incomes, and were relatively likely to be in poverty, prior to the onset of the crisis. Employees working in ‘shut-down sectors’, such as hospitality, were already almost twice as likely to be in poverty as other employees, and poverty rates were higher still for self-employed people working in these sectors. Cleaners and hairdressers stand out as groups with higher poverty rates than other workers who are unlikely to be able to work from home. (Bourquin, Joyce, and Norris Keiler Citation2020, p. 5)
From rising child poverty and the closure of children’s centres, to declines in education funding, an increase in precarious work and zero hours contracts, to a housing affordability crisis and a rise in homelessness, to people with insufficient money to lead a healthy life and resorting to foodbanks in large numbers, to ignored communities with poor conditions and little reason for hope. And these outcomes, on the whole, are even worse for minority ethnic population groups and people with disabilities.
Box 1. Austerity and public health policy: the U.K. and the U.S.
Mortality of the British middle-aged has begun to rise, one reason being the rise in the so-called ‘deaths of despair’ (Case and Deaton Citation2020): deaths from suicide, drug and alcohol overdose and alcohol-related liver disease, which, in turn, are related to the cumulative toll on mental health caused by rising job insecurity, growing precariousness, and economic hardship.Footnote13 The evidence is clear: austerity by consecutive conservative governments widened socio-economic inequalities in Britain, which in turn reinforced existing inequalities in physical and mental health more generally.Footnote14
As a result, Britain was comparatively badly prepared for SARS-CoV-2. Helped by the Johnson government’s exceptionally poor handling of the health emergency, Britain is recording a relatively high COVID-19 death toll, with inequalities in COVID-19 mortality rates following a similar social gradient to that seen for all causes of death.Footnote15 Mortality risks from COVID-19 are two to three times higher among BAME (Black, Asian and Minority Ethnic) groups than for the White population (Marmot, Allen, and Goldblatt Citation2020b, 20). These differences in mortality risks are reinforced by differences in occupational risks: mortality risks are far lower for people in the white-collar ‘professional’ occupations who can work from home, than mortality risks for people in ‘essential’ or ‘elementary’ occupations such as health-care workers, (hospital) cleaners and domestic workers, postal workers, bus and coach drivers whose jobs cannot be undertaken from home (Marmot, Allen, and Goldblatt Citation2020b, pp. 31–34). These ‘essential’ workers often hold precarious, zero-hours jobs, especially in care work and cleaning.
In the U.K., 11 million people have been furloughed, losing 20% of their income or more in many cases; the number of people relying on Universal Credit has increased from 3 million in March 2020 to 6 million today; and more than 70,000 households have been made homeless since March 2020.Footnote16 Wealthier households and retirees mostly managed to maintain their incomes and have built up around £180 billion of cash savings, while the wealth of British billionaires rose by 35% (or £40 billion). Tech-companies, estate agents, delivery companies, supermarkets and government subcontractors are making higher-than-ever profits (Macfarlane Citation2021). It is clear that the current crisis will leave legacies that will aggravate the pre-existing inequalities in the long term (Blundell et al. Citation2020).
A similar story can be told for the U.S. Box 1 details the impacts of austerity on American public health funding and policy preparedness (Woolhandler et al. Citation2021; Liao and De Maio Citation2021; Abedi et al. Citation2021; Islam et al. Citation2021). Well before the COVID-19 health emergency, life expectancy at birth in the U.S. began to decline due to the crisis of premature mortality affecting most demographic groups. But Black, Native American and Alaska Native people were the demographic groups most affected by premature mortality. Before the COVID-19 crisis, midlife (aged 25–64 years) mortality for Native American and Alaska Native people was 59% higher and for non-Hispanic Black people was 42% higher than for non-Hispanic white people. According to estimates by the Lancet commission, premature (avoidable) mortality in the U.S. is staggeringly high: in 2018 alone, 416,000 (mostly Black and Native) Americans would still have been alive if age-specific mortality rates in the U.S.A. had remained equal to the average of the other six G7 nations. These inequalities in premature mortality mirror high and widening economic inequality, with rising incomes for the wealthiest decile of the population, but stagnant real incomes for the bottom 50%. As Woolhandler et al. (Citation2021, p. 713) write:
By 2014, the life expectancy of the wealthiest 1% of men was 15 years longer than that of the poorest 1%; the difference for women was 10 years. Between 2000 and 2014, adult life expectancy increased by over 2 years for people in the top half of the income distribution, while the lower half of the income distribution had little or no improvement, and mortality increased among low-income white women.
In the U.S., high income inequality (in specific counties) is linked to the breakdown of critical social systems and public infrastructure, including education, transportation, and health care (in those counties) (Liao and De Maio Citation2021; Abedi et al. Citation2021; Tan et al. Citation2021). Accordingly, the sad — and entirely predictable — result of these structural inequalities driving health outcome is that (age-adjusted) mortality rates among Black and Hispanic populations are 3.6 and 3.2 times higher, respectively, than for the non-Hispanic White population — figures expected to increase substantially in the coming months (Woolhandler et al. Citation2021; Liao and De Maio Citation2021).
Austerity is doubtlessly a major factor in all this. But abandoning austerity will not be enough, because it was part of a larger, four-decade long drift toward neoliberal policies that bolstered corporate profits,Footnote17 privatised government services,Footnote18 and reinforced structural racism. In the words of the Lancet commission,
[Obama’s Affordable Care Act’s] provider-payment strategies reinforced decades of market-oriented reforms that made profitability the fundamental measure of performance, drove the commodification of care, and increasingly vested control in investor-owned conglomerates. Commercial interests have, for decades, promoted a health-care paradigm overly reliant on biomedical interventions, particularly pharmaceuticals, at the expense of holistic approaches to care and attention to social determinants of health. (Woolhandler et al. Citation2021, p. 710).
3.2. The Toxic Obsession with the Equity-Efficiency Trade-Off
Mainstream macroeconomists have blinders on when it comes to dealing with economic inequality. To most, inequality is an issue outside the scope of macroeconomics, because in their favoured DSGE models, neither monetary nor fiscal policy can, by assumption, do much about it, nor does inequality matter in determining long-run (potential) growth (Storm Citation2021). In addition, most macroeconomists tend to believe that attempts to reduce inequality (by redistributive policies) come at the cost of lower long-run growth. That is, they believe that there exists a trade-off between ‘efficiency’ (which is taken to mean the ‘maximisation’ of real GDP) and ‘equity’ (which refers to how GDP is distributed).Footnote19 If the trade-off holds, a more unequal distribution of income would lead to higher economic output. ‘This is the one lesson concerning the distribution of income about which almost everyone agrees’, writes Greg Mankiw (Citation2015, p. 429) with great confidence.Footnote20 In this mistaken but dominant view, more equality necessarily means less efficiency, and hence fewer goods to be distributed. A society must balance its desire for a more egalitarian society, it is claimed, against the conflicting desire for affluence (Mankiw Citation2021). The equality-efficiency trade-off provides a ready justification for economic inequality — as it implies that reducing inequality is (too) costly. The belief in this trade-off has had toxic effects — the rising economic and health inequalities already mentioned above — but most ‘serious’ macroeconomists stubbornly uphold it, quite in line with Friedrich Nietzsche’s aphorism that ‘a bad conscience is easier to cope with than a bad reputation.’
The COVID-19 health emergency is exposing the equality-efficiency trade-off as a myth: it does not prevail in practice. illustrates the point when it comes to the efficiency with which countries are handling the COVID-19 crisis. It shows that more unequal economies suffered a deeper recession due to the COVID-19 health emergency — as (roughly) a one-point increase in the Gini coefficient is associated with a decline in real GDP by ½ percentage point. More egalitarian countries were more ‘efficient’, in terms of macroeconomic costs, in responding to the emergency — a conclusion that is reinforced in terms of public health impacts by the finding from that SARS-CoV-2 mortality rates are significantly higher in more unequal societies.
Figure 9. Scatterplot of (after-tax-and-transfer) Gini coefficients versus change in real GDP during 2019–2020.
Sources: Data on real GDP are from AMECO Database. Data on inequality (Gini coefficients) are from the OECD (https://data.oecd.org/inequality/income-inequality.htm). Note: the estimated linear relationship is negative and statistically significant at 1% (when I exclude the observations for the U.S.A. from the regression).
We can look at the same issue in one more way. Relatively inegalitarian Britain, which has a Gini coefficient (after tax and transfers) of 0.36, suffered 100 COVID-19-deaths more (per 100,000 population) than relatively egalitarian Germany (with an after-tax-and-transfer Gini coefficient of 0.29), while spending roughly the same amount of money of relief measures than Germany on a per-person basis (i.c. €3,198 per British citizen versus €3,334 per German citizen). Britain further experienced its deepest annual fall in GDP since the eighteenth century (with real GDP in 2020 down by 10.3% relative to 2019), while Germany’s real GDP declined by ‘only’ 5.6%. Likewise, the inegalitarian U.S. (having a Gini coefficient of 0.39) suffered 70 COVID-19-deaths more (per 100,000 population) than more egalitarian Germany, while spending almost double the amount of money on COVID-19 relief than Germany (i.c. €6,525 per American citizen versus €3,334 per German citizen). Comparing the U.S. with Denmark (why not?) is even more sobering: Denmark has a (after-tax-and-transfer) Gini coefficient of 0.25 and lost 122 persons less (per 100,000 population) to SARS-CoV-2 than the U.S., while spending less than half the amount of money (i.c. €3,061 per Danish citizen versus €6,525 per American citizen). The recession of the Danish economy (a decline in real GDP of 3.9%) was less painful than the American recession (a decline in real GDP of 4.6%). Therefore, more unequal countries suffer from a deeper recession and much higher mortality, while spending more on COVID-19 relief. The reason is that high income inequality is associated with the breakdown of critical social systems and public infrastructure — and with greater social fragmentation and poor governance of the economy and of public health.
In recent congressional testimony, Federal Reserve Chair Jerome Powell rejected the notion that the goals of equality and growth necessarily conflict. Senator Elizabeth Warren (D-MA) put the question to him directly:
You’ve talked a lot about how inequality undermines opportunity and mobility, and you’ve described it as something that holds our economy back. So, I take it from these comments that you believe that inequality weighs our economy down and stunts economic growth. Is that a fair statement?
The economic and health (deficiency) impacts of the COVID-19 emergency are unevenly distributed and hence will further deepen pre-existing inequalities, particularly so in the most unequal OECD countries. If not undone, the entirely predictable macro impact of heightened income and health inequalities will be a reinforced shortage of aggregate demand,Footnote22 feeding into slower long-term growth and stagnating (median) living standards (Storm Citation2017; Taylor Citation2020). Secular stagnation will become hard-wired into our economic systems — turning the short-term recession into permanently lowered economic growth. This shows how dangerous the equality-efficiency trade-off myth actually is, because by stubbornly prioritising ‘efficiency’ over ‘equity’, we ended up in the worst possible outcome, conspicuously failing on either count.Footnote23
What is also not counted is the political fall-out of staggering inequality and growing economic and health deficiencies for the majority. As pointed out by the Lancet commission, in the U.S., the 2016 county-level vote for Trump was closely correlated with mortality trends. Counties in which more than 60% of people voted for Trump had higher life expectancy in 1980 than those counties in which more than 60% of people voted for Clinton. However, by 2014, the Trump counties lagged more than 2 years behind counties that had voted for Clinton (Woolhandler et al. Citation2021, p. 713). Helped by political money (Ferguson, Jorgenson, and Chen Citation2019, Citation2021), four decades of neoliberal policies that wreaked economic hardship and worsened health, also precipitated the rightward political shift that led to Trump’s election, what might be labelled a ‘politics of despair’ (Woolhandler et al. Citation2021, p. 714). The societal cost of this political shift is difficult to overstate.
3.3. The Oppressive Power of Functionless Financial Investors
The SARS-CoV-2 health emergency has accentuated as never before the oppressive power of — what Keynes (Citation1936, p. 376) called — ‘functionless financial investors’ over central bankers, treasury officials, politicians and the real economy. The excessive liquidity preference of these functionless investors is a structural causal factor underlying the ongoing secular stagnation and weakening of the real economy (Storm Citation2017; Palma Citation2020; Taylor Citation2020) and, as such, a major driver of heightened public-health vulnerabilities. And these functionless investors have grown so big as to become of systemic importance to the stability of the financial system. Exploiting its systemic importance, the rentier class has taken central banks and treasury officials hostage to push its partisan interests (Palma Citation2020). The corona-crisis has entrenched rentier power over the macroeconomy even further. Let us see how this has happened.
Predictably, stock markets crashed in early 2020, following the immediate stoppage of economic activity as financial investors adjusted to the new (unexpected) reality of a world with SARS-CoV-2. As shown in , the S&P500 Index lost 27% in just seven weeks — between the week of 07-02-2020 and the week of 20-03-2020. But then the panic was over. There followed a remarkably quick recovery and by early July 2020, the S&P500 Index was back at the level of early February. Overall, the Index increased by 63% during 20-03-2020 and 19-02-2021 — and is now 18½% higher than on 07-02-2020. This is quite extraordinary for a year in which the U.S. economy tanked (real U.S. GDP fell by 4.6%), U.S. unemployment (narrowly defined) increased by 4.2 percentage points (or 7 million additional unemployed workers), and debt of the U.S. government rose by 19.2 percentage points of GDP.
Figure 10. S&P500: stock-market ‘panic’, followed by ‘mania’ (February 2020–February 2021).
Source: S&P Dow Jones Indices, FRED Database. Notes: The index is shown in thousands; rates of growth indicated in the figure are for the respective phase.
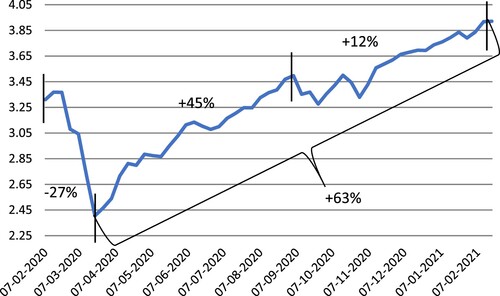
Many observers fear that it is another mania. Veteran financial investor Jeremy Grantham, the British co-founder of the U.S. investment firm GMO, for instance, warns that a ‘a fully-fledged epic bubble’ has formed on Wall Street (Pratley Citation2021). ‘Featuring extreme overvaluation, explosive price increases, frenzied issuance, and hysterically speculative investor behaviour, I believe this event will be recorded as one of the great bubbles of financial history,’ Grantham wrote in a letter to investors.
The mania is not confined to just the stock market. U.S. home prices have soared during 2020, as households took on almost $1.2 trillion in new mortgage debt in the final three months of 2020, the highest quarterly volume in the history of the New York Fed’s data (which begin in 2000).Footnote24 U.S. households refinanced more mortgage debt in 2020 than any time since 2003, while mortgages taken out to purchase a home surged to the highest since 2006. First-time buyers took on more debt than at any time in history. Collectively, homeowners withdrew $182 billion in home equity in 2020, or an average of about $27,000 for each household (Chappata Citation2021). Note that more than 70% of originations in Q4 of 2020 went to borrowers with the highest credit scores (higher than 760), which means that those benefiting from the boom in housing prices are Americans who are disproportionately the most creditworthy already (Chappata Citation2021).
The renewed ‘mania’ is, according to IMF economists Adrian and Natalucci (Citation2021), driven by a combination of factors: a belief that unprecedented government COVID-19 relief measures for households and businesses will continue; the expectation that interest rates will continue to remain very low for the foreseeable future, which helps to explain the attractiveness to speculators of monopolistic tech firms,Footnote25 the revenue streams of which are tilted far into the future; the hope that vaccines rollouts will enable a global economic recovery already in 2021; and, most crucially, an almost universal confidence that central banks will, in all circumstances, continue to unconditionally backstop private financial markets (by directly buying private bonds).
The Federal Reserve bought about $12 billion in corporate bonds (including junk bonds) and exchange-traded funds made up of corporate debt — notably without conditions requiring those corporations of which it bought those bonds, to keep all their employees. The bond purchases are intended to ensure that the corporate bond market functions smoothly and that large corporations can borrow by issuing debt. While its purchases have been relatively small relative to the size of the overall market, the Fed’s actions have restored confidence in the bond market and enabled large U.S. companies to embark on a borrowing binge. Adrian and Natalucci (Citation2021) point out the dilemma facing central bankers:
While there is for now no alternative to continued monetary policy support, there are legitimate concerns around excessive risk-taking and market exuberance. This situation creates a difficult dilemma for policymakers. They need to keep financial conditions easy to provide a bridge to vaccines and to the economic recovery. But they also need to safeguard the financial system against unintended consequences of their policies, while remaining in line with their mandates.
With investors betting on persistent policy backstop, a sense of complacency appears to be permeating markets; coupled with apparent uniform investor views, this raises the risk of a market correction or ‘repricing.’ A sharp, sudden asset-price correction — for example, as a result of a persistent increase in interest rates — would cause a tightening of financial conditions. This could interact with existing financial vulnerabilities, creating knock-on effects on confidence and jeopardizing macro-financial stability.
Indeed, while output, employment and investment were sinking like a stone [… .], one financial insider lamented, … our biggest mistake may be that we have not been optimistic enough (Palma Citation2020, p. 16).
Importantly, QE’s capacity for reactivating the real economy has been minimal, as the extra liquidity mostly stays within the financial system where it is used for anything but creating additional productive capacities.Footnote26 The situation is even worse: the excessive liquidity preference of rentiers is a structural causal factor underlying the secular stagnation of the real economy. It is precisely because major asset markets are backstopped by central banks that the excess liquidity is used for financial investments with ‘safe and high returns’ — rather than for risky and lower returns in the real economy.
The remarkable increase in the concentration of the asset management industryFootnote27 has been a key factor in strengthening the stranglehold of the rentier class on central banks and governments, because the ‘correlated behaviour of big conglomerates, combined with their sheer size, has repercussions on asset price stability that are mostly felt during times of market stress’ (Ben-David et al. Citation2020, p. 29). Excessive concentration in the U.S. asset management complex poses systemic risk — and exploiting its systemic importance, the rentier class has taken central banks hostage to push its partisan interests (Palma Citation2020).
Accordingly (and no matter how much this violates every possible principle of ‘market economics’), given the ‘perpetual orgy’ in financial markets, to borrow Palma’s (Citation2020) words, financial firms use the real economy to extract even more liquidity to be employed in win-only financial bets. The ‘Big Three’ asset managers — Vanguard, BlackRock and State Street Global Advisors (SSGA) — have a combined market share of 80% in the mutual funds industry and — crucially — together hold more than 20% of the shares in the average S&P500 company (Braun Citation2020, p. 3). The mutual funds operated by three giant asset managers therefore exercise strategic control over most of the U.S. corporate sector.Footnote28
Corporate managers understand that what is most important for them is to meet financial performance targets to satisfy their largest shareholders and to maximise their own — stock-options — pay. This has led to the financialization of U.S. corporations and to massive stock buybacks, which obviously is in the joint interest of corporate executives, the mutual fund managers and the richest households as well (Lazonick, Sakinç, and Hopkins Citation2020).Footnote29
The interests of the giant asset managers who work in the interest of the wealthiest 10% of U.S. households, and of corporate managers (who themselves belong to the wealthiest 10%) are aligned in suppressing wage growth and raising the profit share in income. The stagnation of (median) real wages and real household income of the bottom-80% of U.S. households (Taylor Citation2020; Stansbury and Summers Citation2020; Storm Citation2017) is, in considerable measure, the result of the reconcentration of share-ownership and the aligned interests of executives, money and asset managers and the wealthiest households — and of the political money (Ferguson, Jorgenson, and Chen Citation2019) they use to enhance their interests within the political system. Hence, rentier capitalism is also, quite directly, to blame for the widening socio-economic and health inequalities which increased the deadly vulnerability of large groups in our economies to infection with SARS-CoV-2.
The SARS-CoV-2 health emergency has reinforced the stranglehold of the rentiers on central bankers, by triggering an additional, crisis-induced, glut in liquidity in an otherwise stagnating economy. Specifically, the average personal savings rate of the U.S. increased from 7.5% in 2019 to 16.2% in 2020, after peaking at 33.7% (on a monthly basis) in April 2020. As a result, deposits in commercial banks rose by 18%, from $12.8 trillion in 2019 to $15.1 trillion in 2020.Footnote30 The reason for the increase in savings, occurring at low interest rates, is the crisis-induced drop in consumer spending on ‘social consumption’ (which constitutes roughly one-third of overall consumer expenditure). Such spending was cut the most by the already high-saving rich and super-rich who, as the dominant wealth-owners in the U.S. (Taylor Citation2020), are also benefiting the most from the permanently rising asset prices ().Footnote31 Banks, rich households and money market funds, flushed by cash, face a relative shortage of safe financial assets — and increasingly resort to higher risk investments, knowing they can always sell problematic assets to the central bank.Footnote32 The SARS-CoV-2 health emergency is magnifying existing financial stability risks — not just due to the large increases in (already high levels of) sovereign debt, but also on account of higher corporate debt, lower bank profitability, weakened solvency, asset-price bubbles and increased systemic risk in the financial sector.
The hands of central bankers including Federal Reserve chair Jerome Powell, the European Central Bank’s Christine Lagarde and the Bank of England’s Andrew Bailey, are tied by the functionless financial investors. Neel Kashkari, the president of the Minneapolis Federal Reserve, is clear:
I don’t know what the best policy solution is, but I know we can’t just keep doing what we’ve been doing, he said. As soon as there’s a risk that hits, everybody flees and the Federal Reserve has to step in and bail out that market, and that’s crazy. And we need to take a hard look at that (Politi Citation2020).
Higher public debt, as the late sociologist O’Connor (Citation1973) argued, increases capital’s power over the state: a government that is not pursuing market-friendly policies will find it hard to obtain funding from the bond markets. Of late, the structural ‘oppressive power’Footnote33 of the rentiers has become so strong that it is forcing states and central banks to de-risk certain systemic liabilities, notably repo liabilities collateralised by (investment-grade) tradable securities. Escaping the constraints of state-backed money, financial firms use the repo liabilities as ‘private money’ in transactions within the shadow banking system — and what renders repo liabilities ‘money’ is their ability to store value at par, that is, to credibly promise par convertibility between repo deposits and state-backed money through collateral valuation (Gabor Citation2020, Citation2021). To provide a safety net to these intra-financial markets, the state needs to ‘de-risk’ the tradable securities used as collateral. Likewise, under rules defined by global finance, the state is forced to ‘de-risk’ certain asset classes held by private asset managers including notionally ‘green finance’ and ‘public health-related bonds’.
The SARS-CoV-2 health emergency reinforces the oppressive power of global finance — as central banks bailout global finance, while governments are in no position to reform it. So, here we are, after four decades of neoliberal economics and obsessive-compulsive balanced-budget conservatism, stuck in a stagnating and unequal economic system, dominated by rentier interests, in which monetary policymakers are powerless, states are bonded by (even higher) debts, and the economic, social and medical orders are frail. To paraphrase Mr. Kashkari, I don’t what we should do to remove the stranglehold of the rentiers, but I know we can’t just keep doing what we’ve been doing until now.
3.4. The Misleading Rhetoric that Taxes Don’t Need to be Raised
Newspaper reports claim that austerity has been officially buried — and that the renewed emphasis on fiscal policy, rather than on monetary policy, ‘would revolutionise a generation of policymaking in which economic stimulus efforts have largely been driven by independent central banks motivated by concerns about inflation but not influenced by politics’ (Giles Citation2021a). True, governments and central banks have rolled out unprecedented stimulus measures in a bid to cushion their economies from the massive negative impact of the SARS-CoV-2 health emergency (). And in most OECD countries the official line is that tax rises are not appropriate now given the current economic crisis. Indeed, most economists join the IMF (Citation2021) in warning against repeating the mistake of ‘prematurely imposing austerity’, made in 2010 and 2011 when the OECD economies had not yet recovered from the financial crisis of 2008–09. Laurence Boone, the chief economist of the OECD, goes further and argues (Giles Citation2021b) in favour of a rethink of macroeconomic policy in favour of fiscal policy (rather than monetary policy). Boone advises that governments use fiscal stimulus for as long as necessary (and for as long as interest rates remain low), relegating independent central banks to a secondary role (Giles Citation2021b).
For economists belonging to the school of Modern Monetary Theory (MMT), the ‘macroeconomic policy revolution’ is not yet going far enough. In their thinking, government spending by a monetary-sovereign state can be increased to any desired level, without needing to worry about raising tax revenues to ‘pay for’ it, not just now (during the COVID-19 crisis) and not just for as long as interest rates remain low, but in principle always when there is excess capacity in the economy. The logic behind this claim is that as long as the central bank in a monetary-sovereign nation is willing to issue new money on behalf of the government (i.e., purchasing government bonds), the government can spend more without needing to tax more. Higher government debt is not considered to be a problem, especially not when it is held (for eternity) on the books of the central bank. Therefore, (monetary-sovereign) governments face no financing constraints in cushioning the negative shorter-run impacts of the COVID-19 crisis and also possess the necessary funding capacities to address the longer-term structural inequalities in health and economic conditions, which made many economies so vulnerable to the virus in the first place ( and ).
It is plain and conventional Keynesian understanding that ‘premature austerity’ must be avoided, because in a crisis driven at least partly by insufficient spending, anything that will further reduce private-sector spending will only worsen the crisis. It is uncertain for how long this will be the case, but in view of the severity of the economic costs of the crisis (especially for the low-income groups working in ‘essential’ occupations) and the low interest rates, there is clearly no reason to cut back on public spending any time soon. That said, there is no good reason whatsoever to jump to the conclusion that ‘government debts are never a problem’ and ‘taxes don’t have to be raised to repay the debt’. For one, government debt constitutes a problem for nations that lack monetary sovereignty, such as the Eurozone member states Belgium, France, Greece, Italy, Portugal, and Spain (). In theory, their problems would be solved if the European Central Bank would be completely accommodative — which it is currently, but not in an uncontested manner, and which it will not likely remain. Governments in smaller open-economy economies including Australia, New Zealand, South Korea and the U.K. face (foreign-exchange) constraints, because financial investors may sell their monies in exchange for other currencies, reducing the international value of their currencies — and this will make it more expensive to pay for imports and service the foreign debt (Palley Citation2020). Especially for balance-of-payments-constrained economies, it may be sensible to reduce the public debt-to-GDP ratio by higher taxation, but only, of course, after the COVID-19 crisis is passé.
But even for a government of a monetary-sovereign state such as the U.S. borrowing is not without cost. The most often mentioned barrier to monetary financing of public spending in the U.S. is rising inflation. An economy with slack — there is unemployment and under-utilised production capacity — can absorb increased public spending at a stable rate of inflation. But eventually, a point will be reached where the goods and services purchased by the government cannot be immediately newly produced, as the slack is gone, and hence the government will have to compete with the private sector for economic resources. This will drive up wages, energy prices and prices of other intermediate and capital goods — and inflation will rise. In MMT thinking, the state must then step in and raise taxes at this point — to lower demand and stop inflation from rising.Footnote34 In conventional thinking, the Federal Reserve must do the heavy-lifting, raising the interest rate to stop inflation from accelerating — and the higher interest rate will, at least, partly crowd out the impact of the fiscal stimulus.Footnote35 In both cases, there is a limit on public debt from which follows a need to step up taxation (Henwood Citation2019).
I am afraid, however, that much of the above discussion about taxes is beside the point. Pumping in more money and raising public spending — financed by the central bank — will do nothing to mend the highly unequal and un-equalising processes of income generation in the U.S. and the U.K. As a result, a large proportion of the money injected into the circular flow of expenditure and income leaks into the financial circuit via the process of saving, where it is directed to bidding up asset prices (Palley Citation2020). Therefore, government spending (financed by borrowing from the central bank) has only a limited capacity for reactivating the real economy and creating new productive capacities, because — to use Arthur Okun’s metaphor (but with a twist) — it is like transferring water into a ‘leaky bucket’. The fiscal stimulus leaks away, via the pockets of the super-rich, into the financial system, where it will drive up asset prices, which (as we know) are a further reward for these functionless investors (Taylor Citation2020).
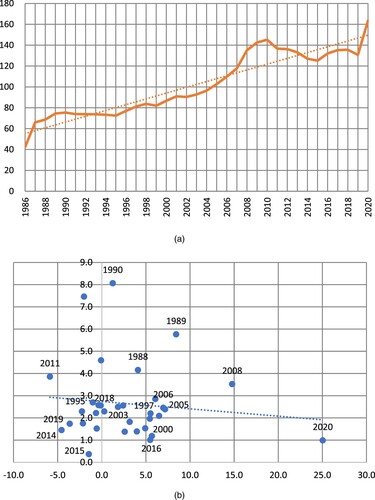
Evidence shows that this is what is happening. Consider which shows the ratio M3/GDP in the U.S. during the period 1970–2020 (in panel a) and the scatterplot of the annual percentage change in M3/GDP versus annual consumer price inflation (in panel b). U.S. consumer price inflation was high during the 1970s (13.1% on average per year), lower during the 1980s (7.2% per year), and much lower during the 1990s (3.4% on average per year) and during 2000–2008 (2.4% on average per annum). Over all these years, when decadal U.S. inflation came down by 10.7 percentage points, U.S. money supply remained relatively stable as a percentage of GDP, fluctuating between 55–60% of GDP. And when the M3/GDP ratio increased significantly during 2008–2020, following the Financial Crisis of 2008 and the SARS-Cov-2 emergency in 2020, average annual consumer price inflation in the U.S. fell to 1.4%. The leaky bucket is at work, as a large part of the money injected into the circular flow of expenditure and income leaks into the financial circuit via the process of saving. The picture is similar for the U.K. where the M3/GDP ratio rose from around 67% in 1987–88 to more than 135% in 2018 (panel a of ). British consumer price inflation declined over time, however. Hence, increased money supply (relative to GDP) does not correlate with higher inflation in the U.K. (see panel b of ).
Figure 11. M3/GDP (percentage) and inflation: U.S.A (1970–2020). Panel a: M3/GDP (1970–2020). Panel b: scatterplot of annual percentage change in the M3/GDP ratio and annual inflation (1970–2020).
Sources: Data on M3 and GDP are from OECD Statistics. Data on inflation (measured by annual changes in the Price Index of Personal Consumption Expenditures) are from the Federal Reserve. The estimated linear relationship is negative and statistically significant at 1%.
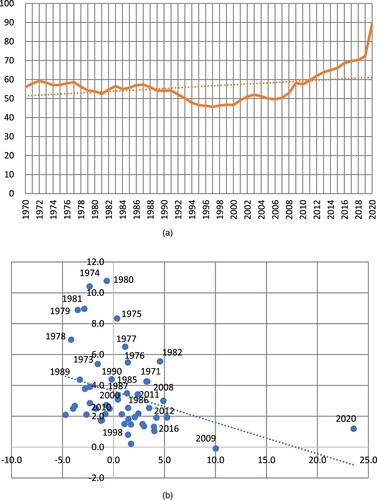
Figure 12. M3/GDP (percentage) and inflation: U.K. (1986–2020). Panel a: M3/GDP (1986–2020). Panel b: scatterplot of annual percentage change in the M3/GDP ratio and annual inflation (1986–2020).
Sources: Data on M3 and GDP are from OECD Statistics. Data on inflation (measured by annual changes in the Consumer Price Index) are from the Federal Reserve. The estimated linear relationship is not statistically significant.
Rising M3/GDP ratios do not, therefore, show up in higher consumer price inflation. MMT and conventional macro miss the point that higher consumer price inflation is unlikely to act as a signal, warning governments of ‘overheating’. Rather, the over-spending will show up in asset price inflation — and higher prices of land, real estate, and shares benefit the rentier class and worsen income distribution even further (Taylor Citation2020). This way, the effect of monetary financing will be to reinforce and further facilitate the excessive liquidity preference of the super-rich, locking the rest of the economy into stasis and growing inequality. The claims that debts do not need to be repaid and taxes do not need to be raised are thus misleading, because these obfuscate the inescapable need for progressive taxation as a foundation for a healthy and therefore fairer economic system.
In the MMT view, public spending can be financed by borrowing from the Federal Reserve; the income generated by the public spending will generate jobs and incomes and hence tax revenues will increase, with which the loans from the Federal Reserve can be repaid, if that is deemed necessary (for instance, because the economy reaches full employment and inflation is starting to increase). What is missed by MMT, however, is that this way of funding the ‘full employment’ public spending programme leaves the post-tax-and-transfer income inequality untouched, allows the excessive liquidity preference of the super-rich and big corporations to persist, and thereby enables further asset-price inflation which reinforces the already excessive income concentration in favour of the rentiers in an otherwise stagnating real economy (Storm Citation2018). The excessive liquidity preference of rentiers is, to repeat, a structural causal factor underlying the secular stagnation of the real economy.
Taxes are indispensable not just for reasons of microeconomic redistribution, but even more strongly to put a curb on the extreme liquidity preference of the functionless investors. This requires at the minimum (i) more progressive taxation to redistribute income and wealth from the rentier class to the rest of the economy (Saez and Zucman Citation2019); and (ii) a financial transactions tax (FTT) to discourage ‘short-termist’ financial market activities that are unproductive and rent seeking (such as certain high frequency trades and trading in OTC derivatives) and to redirect liquidity to productive investments in the real economy. Combined with higher real wages (Taylor Citation2020) and more countervailing power for workers (Stansbury and Summers Citation2020), this redistribution is needed to revive aggregate demand and to remove the stranglehold of the super-rich and the big corporations on monetary and fiscal policy-making.
illustrates the macroeconomic importance of taxation. It shows that the income-share of the top 1% is higher, the lower is the tax-to-GDP ratio in a country. The U.S. are a case in point: the share of taxes in U.S. GDP (at 24.5%) is far below the (unweighted) OECD average tax share of 36.1%, while the income-share of the richest 1% of Americans (at 18.7%) is much higher than the (unweighted) share of the 1% in the OECD as a whole (of 11.5%). The Scandinavian countries, Austria, Belgium, France, Italy and the Netherlands all have much higher tax-to-GDP ratios and below-average income shares for the top 1%.
Figure 13. Scatterplot of tax-to-GDP ratio (in 2019) versus the income share of the top 1%.
Sources: Data on the tax-to-GDP ratio in 2019 are from OECD Statistics; data on the income share of the top 1% are from the World Inequality Database. Notes: (1) the (unweighted) average tax-to-GDP ratio is 36.1% for the panel of 22 OECD countries; (2) the unweighted average income share of the top 1% is 11.5% for the panel of 22 OECD economies. (3) the estimated linear relationship is negative and statistically significant at 1%.
reinforces this conclusion: the Gini coefficient of (after-tax-and-transfer) income inequality is lower in countries in which the tax-to-GDP ratio is higher. The U.S. stand apart (again): (after-tax-and-transfer) income inequality is highest in the U.S., while the tax-to-GDP is the lowest in the groups of 22 OECD economies (if I exclude Ireland). We already saw earlier that higher inequality is associated with a higher COVID-19 mortality rate () and declining longevity ().
Figure 14. Scatterplot of tax-to-GDP ratio (in 2019) versus the Gini coefficient of (after-tax-and-transfer) income inequality.
Sources: Gini-coefficients are from OECD Data (https://data.oecd.org/inequality/income-inequality.htm); data on the income share of the top 1% are from the World Inequality Database. Notes: (1) the (unweighted) average tax-to-GDP ratio is 36.1% for the panel of 22 OECD countries; (2) the average (after-tax-and-transfer) Gini coefficient for the panel of 22 OECD economies is 30.9; (3) the estimated linear relationship is negative and statistically significant at 1%.
Taxation enables a form, however mild, of ‘socialization’ of investment, as part of the incomes and wealth of the rich is transformed into socially useful public investments (including in public health infrastructure). Taxing takes those resources out of private hands and puts them into public ones, with at least the potential for them to be spent on more socially useful purposes than exotic financial derivatives, bitcoins or vain missions to Mars.
Hence, taxes can and must be raised — and some taxes such as the wealth tax, taxes on dividends and capital gains, the FTT, the land-value tax, carbon taxes, and marginal income tax rates on the top incomes (including billionaires’ incomes), can be raised without stifling the recovery from the COVID-19 recession, provided the revenue is used for fiscal stimulus (Hope and Limberg Citation2020; Jung and Nanda Citation2021). It will be crucial to put regulation in place to prevent offshore income-hiding. If the money is wisely spent, it will reduce economic and public health vulnerabilities, while reviving economic growth and creating jobs. Even better, the higher taxes will help to purge the excessive liquidity preference of the rentier class, contributing to ‘the euthanasia of the cumulative oppressive of the capitalist to exploit the scarcity-value of capital’ (Keynes Citation1936, p. 376).
4. Conclusion: The Long Over-Due Revolution in Macroeconomics
Like infectious diseases of the past, SARS-CoV-2 is, mostly, a disease of poverty and inequality. A pervasive political indifference to inequality, combined with decades of cuts to the most basic social protections, has left large segments of our populations dramatically vulnerable to the arrival of this virus. As Richard Horton (Citation2020b), the editor of The Lancet, writes for Britain:
The pandemic is not the making of a single coronavirus, but the combination of three epidemics: the virus, the chronic conditions that make people more susceptible to it, and a situation of deepening poverty and inequality. A single pandemic is too simple a narrative to capture this reality. What we’re faced with in Britain is a ‘syndemic’ — a synthesis of epidemics.
Such was the ‘conventional wisdom’ in macroeconomics — and those who challenged the conventional wisdom were swiftly dismissed as not understanding its intricacies and internally consistent logic (Storm Citation2021). Once conventional wisdom has been made ‘more or less identical with sound scholarship, its position is virtually impregnable,’ as Galbraith (Citation1958, p. 36) pointed out. For decades, mainstream macroeconomics has thus acted as ‘the influential and invaluable ally of those whose exercise of power depends on an acquiescent public’ (Galbraith Citation1973), legitimising misguided macro policies and neutralising any suspicion that there might exist feasible alternatives. While some would argue — again — that the failure and failings of mainstream macro are ‘principally a failure of the collective imagination of many bright people [… .] to understand […] the system as a whole’,Footnote37 the more honest answer is that ‘people were doing what they were paid to do, and behaved according to their incentives, but in many cases, they were being paid to do the wrong things from society's perspective.’Footnote38 And as Upton Sinclair famously remarked, ‘It is difficult to get a man to understand something, when his salary depends upon his not understanding it!’
To solve this crisis of the corrupted collective imagination, macroeconomics must be reformed — by ditching its ideological blinders which prevent it from understanding that inequality, income distribution and demand matter for growth, in the short and in the long run; that there is no such thing as an inescapable equality-efficiency trade-off; that government spending on health and social protection is not a ‘cost’, but is critical to maintain social stability and to strengthen societal and individual resilience to deadly pathogens; that extreme inequality is economically wasteful, socially destructive and politically dangerous; that our current financial system is cannibalising our real economy; that instead of letting irrational and greedy functionless financial investors ‘discipline’ governments we must bring the financial system under democratic control and abolish socially wasteful financial speculation; that the extreme liquidity preference of functionless investors is our biggest social and economic problem and has to be quashed; that we must urgently and radically get ‘money’ out of our political systems, because it is a big problem; that government budgets don’t need to be balanced; and that redistributive taxation is critical, not just to invest in social overhead services that enhance labour productivity, lower the reproduction costs of labour, and thereby increase the rate of profit, but more importantly to re-allocate income and demand, away from speculative finance and toward investment in productive capabilities, social protection, education, public health and other socially useful activities.
‘The enemy of the conventional wisdom,’ wrote Galbraith père (Citation1958, p. 38), ‘is not ideas but the march of events … The fatal blow … comes when the conventional ideas fail signally to deal with some contingency to which obsolescence has made them palpably inapplicable.’ COVID-19 gives the fatal blow to the conventional wisdom of mainstream macroeconomists. A revolution in economic thinking is long overdue (Galbraith fils Citation2021).
Acknowledgement
Support from INET and constructive comments from Thomas Ferguson and Alex Izurieta are gratefully acknowledged. The author is very grateful to an anonymous referee for critical and pertinent comments.
Disclosure Statement
No potential conflict of interest was reported by the author(s).
Notes
1 In the U.S., private markets for debt revived after the Fed backstop; much of the recent debt explosion is private.
2 See Furman and Summers (Citation2020), who propose new guidelines for fiscal policy that are supporting economic growth while preventing real debt service from being projected to rise quickly or to rise above 2 percent of GDP in the coming decade.
3 The U.S. and the U.K. suffered 205 and 203 deaths per 100,000 persons in their respective populations (on 21-09-2021).
4 Japan’s public health response focused on the controlling of overdispersion, super-spreading and aerosol transmission already in February 2020, as researchers were trying to figure out why super-spreading happens and how it affects everything, including contact-tracing methods and testing regimes. As a result, Japan’s public health advice is to avoid the 3C’s: closed spaces with poor ventilation, crowded places and close-contact settings. ‘Hitoshi Oshitani, a member of the National COVID-19 Cluster Taskforce [… .] likens his country’s approach to looking at a forest and trying to find the clusters, not the trees. Meanwhile, he believes, the Western world was getting distracted by the trees, and got lost among them’ (quoted in Tufekci Citation2020). The Western world was a remarkably slow learner, as it needed until October 2020 to change the guidelines to reflect the airborne nature of the pathogen.
5 The data concern additional spending and foregone revenue and do not include contingent liabilities and other off-budget transactions or guarantees. In the current situation, however, with heightened uncertainty around the size and length of the economic impact of the COVID-19 emergency, the probability that risks may materialize are almost impossible to estimate with accuracy (IMF Citation2020).
6 For instance, there is a strong relationship between obesity (and overweight) and low socioeconomic status, and in general, countries with higher income inequality have higher levels of obesity & overweight. See in the Appendix.
7 Public relief spending includes spending on (temporary) employment subsidies such as the Kurzarbeit scheme to preserve jobs and workers’ incomes in Germany.
8 The exception to this general trend was higher public spending by the U.S., the U.K. and other countries to counter terrorist-spread pandemics. During 2010–2019, U.S. federal government agencies allocated a total of $13.2 billion to R&D countermeasures, managed by the Biomedical Advanced Research and Development Authority (BARDA) and Project BioShield, and to procurement of countermeasures by the Strategic National Stockpile (SNS). See Lazonick and Hopkins (Citation2020).
9 For every £100 of deficit reduction, £85 came through spending cuts, while £15 was through increased taxes — according to Johnson (Citation2013), Director of the Institute for Fiscal Studies.
10 The cost of social renting in England increased by 40% during 2008-16, while incomes stagnated, pushing many people (further) into poverty and worsening mental and physical health. 35% of English households in the private rental sector were living in poverty as a result of their housing costs in 2017–18 (Marmot Citation2020a, p. 109).
11 Inequalities in the social determinants of health between English regions have grown, partly caused by widening regional inequalities in wealth, income, employment and government funding. These inequalities now contribute to regional inequalities in mortality from COVID-19 (Marmot, Allen, and Goldblatt Citation2020b).
12 See Deuschl et al. (Citation2020). Britain has the worst healthy life expectancy of any other European country. The improvement in British healthy life expectancy (3.6 years) has been lower than the western-European average (5.8 years). And the situation for children is equally bad: the under-five mortality rate in the U.K. in 2019 was 4.1 deaths per 1,000 live births — one of the worst performances in western-Europe. Whatever metric one chooses, the U.K.’s health performs worse than comparable European nations (Horton Citation2020a).
13 The number of such deaths per 100,000 adults has risen from about 30–61 for middle-aged men (45–54 years) and from 15 to 26 for middle-aged women (45–54 years) during 1993–2017 (source: , p. 8; in Joyce and Xu Citation2019).
14 Ken Loach’s celebrated film ‘I, Daniel Blake’ is a powerful indictment of the cruelty of British austerity.
15 COVID-19 is a ‘disease of poverty’. Evidence shows that more deprived communities have significantly higher case rates and significantly more admissions to intensive care. A major reason for this is that people in low-wage jobs and in poor and over-crowded housing conditions cannot self-isolate.
16 This paragraph is based on Macfarlane (Citation2021).
17 Recent research by Gupta et al. (Citation2021) shows that private-equity (PE) ownership increases the short-term mortality of Medicare patients by 10%, implying 20,150 lives lost due to PE ownership over the 12-year period of investigation. This is accompanied by declines in other measures of patient well-being, such as lower mobility, while taxpayer spending per patient episode increases by 11%.
18 For instance, a Wall Street Journal investigation found that the Occupational Safety and Health Administration failed to thoroughly investigate worker conditions at an American Airlines subsidiary during the pandemic, despite multiple employee complaints and a COVID-19 outbreak that led to one death.
19 In theory, the efficiency-equity trade-off has been shown to exist within the Arrow-Debreu general equilibrium model of complete and perfectly competitive markets. Because the general equilibrium outcome is Pareto-efficient, no consumer could be made better off by any alternative allocation of given endowments allocations without making another consumer worse off. Any (redistributive) intervention in this unrealistic ‘first-best’ system will lead to Pareto-inferior outcomes — hence the trade-off. But as soon as one steps outside the first-best Arrow-Debreu universe and allows for incomplete markets, uncertainty, unemployment, informational problems, or market power, none of the first-best conclusions hold and there is also no presumption that ameliorating one of these problems (for instance, breaking up an oligopoly) will improve overall efficiency — as shown by Lipsey and Lancaster (Citation1956) in their theory of the second-best (Lipsey Citation2007). It is a mystery, why the trade-off is believed to exist in the real world, even when ignoring the Sonnenschein-Mantel-Debreu theorem.
20 In a recent New York Times article (‘Can America afford to become a major welfare state?’), Mankiw (Citation2021) is repeating his point. Mankiw’s answer to the question posed in the title of his essay is ‘No’.
21 In recent years, economists working in the IMF and the OECD finally began to understand that one cannot separate issues of economic growth and stability on the one hand and equality on the other. In a similar vein, Stansbury and Summers (Citation2020, p. 56) conclude that ‘the shift towards more corporate income, that occurs as [the wage share declines], operates to raise saving and reduce demand. [… .] So, decreases in labor power may operate to promote the reductions in demand and rising gap between private saving and investment that are defining features of secular stagnation.’ Knowledgeable macroeconomists such as Taylor (Citation2020) knew this all along; Taylor’s (Citation2020) recent model analysis demonstrates how rising income (and wealth) inequality has been holding back U.S. economic growth (see also Storm Citation2017).
22 The rich have a higher propensity to save than the poor. Data for the U.S. (1980-2008) by Saez and Zucman (Citation2016) show that the average savings rate of the bottom 90% of income earners hovers around 2%. The top 10% to top 1% of income earners save roughly 10% and the top 1% saves around 33% of its income. Greater inequality therefore increases the national savings rate, and lowers aggregate demand — because the (super-)rich do not reinvest their savings/wealth in the real economy.
23 Automation, AI and robotics are factors complicating the argument on this point, because many routine-based jobs are vulnerable to easy automation and distance performance. See Storm (Citation2017) for an analysis of growth in a dual economy.
24 This paragraph draws on Chappata (Citation2021).
25 During February 24, 2020 and February 24, 2021, the share prices of Facebook, Alphabet (Google) and Amazon rose by 34%, 51%, and 60%. The stock price of Zoom Video Communications grew by 260%, while the share price of Tesla increased by 350% over the same 12-month period. As a result, U.S. billionaire wealth has ballooned by over $1 trillion since the beginning of the pandemic in March 2020 (Collins Citation2020).
26 ‘Indeed, (according to Moody’s) in the UK less than 1% of the resources generated by new corporate bonds after ‘QE’ (quantitative easing) were used to create new productive capacities.’ (Palma Citation2020, p. 3).
27 For example, whereas the top-10 institutional investors collectively owned around 5% of the U.S. stock market in 1980, they now own more than 26.5% of U.S. stocks. See Franzoni (Citation2019).
28 Braun (Citation2020) calls this the ‘Great Re-Concentration’ of share-ownership in the U.S. and argues that this has far-reaching consequences for the U.S. macroeconomy including through anti-competitive effects of ‘common ownership’.
29 Research by Lazonick, Sakinç, and Hopkins (Citation2020) documents that the 465 companies in the S&P 500 Index in January 2019 that were publicly listed between 2009 and 2018 spent, over that decade, $4.3 trillion on buybacks (see Figure 9A), equal to 52% of net profits, and another $3.3 trillion on dividends, an additional 39% of net profits. Lazonick, Sakinç and Hopkins write: ‘Why have U.S. companies done these massive buybacks? With the majority of their compensation coming from stock options and stock awards, senior corporate executives have used open-market repurchases to manipulate their companies’ stock prices to their own benefit and that of others who are in the business of timing the buying and selling of publicly listed shares. Buybacks enrich these opportunistic share sellers — investment bankers and hedge-fund managers as well as senior corporate executives — at the expense of employees, as well as continuing shareholders.’
30 Data on personal savings and commercial bank deposits are from the FRED Database.
31 The same happens in the U.K. Bank of England surveys show that people on incomes below £35,000 spending more than they take home in income (they are dis-saving). While those making more than £35,000, and especially more than £55,000, are saving.
32 Eric Rosengren, president of the Federal Reserve Bank of Boston, told the Financial Times that the Fed lacked sufficient tools to ‘stop firms and households’ from taking on ‘excessive leverage’ and called for a ‘rethink’ on ‘financial stability’ issues in the U.S. (Politi Citation2020). Lael Brainard, a Fed governor, said in a speech in September 2020 that expectations of extended low interest rates were ‘conducive to increasing risk appetite, reach-for-yield behaviour and incentives for leverage’, thereby boosting ‘imbalances’ in the U.S. financial system (Politi Citation2020). Fed officials fear that the U.S. central bank could be forced to raise interest rates earlier than it would like, if mounting financial sector risks are not kept under control.
33 John Maynard Keynes (Citation1936, p. 376) famously called for ‘the euthanasia of the rentier, and, consequently, the euthanasia of the cumulative oppressive power of the capitalist to exploit the scarcity-value of capital’, adding that an ‘intrinsic reason for such scarcity, in the sense of a genuine sacrifice which could only be called forth by the offer of a reward in the shape of interest, would not exist, in the long run … ’
34 MMT ignores the fact that such fine tuning of fiscal policy is impossible due to internal (decision) and external (implementation) lags. MMT also seems to ignore the political economy of fiscal policy, especially the risk of the ratcheting up of deficits by politicians averse to higher taxes (Palley Citation2020).
35 In this scenario, the government has to pay a higher rate of interest on its growing debt. In a slowing economy, this could lead to a debt-trap-like situation, and to avoid out-of-control (or unsustainable) public finances, the government may be forced to raise taxes to lower its debt.
36 For example, British Prime Minister Alexander Boris de Pfeffel Johnson, born into privilege himself, famously stated (in 2013) that ‘some measure of inequality is essential for the spirit of envy and keeping up with the Joneses that is, like greed, a valuable spur to economic activity’ (quoted in Horton Citation2020b).
37 Tim Besley and Peter Hennesy (Citation2009), Letter to Her Majesty the Queen who had asked why nobody saw the crisis coming.
38 This is the answer given by Professor Luis Garicano, to whom Queen Elizabeth directed her question when she visited the LSE (Stewart Citation2009).
References
- Abedi, V., O. Olulana, V. Avula, D. Chaudhary, A. Khan, S. Shahjouei, J. Li, and R. Zand. 2021. ‘Racial, Economic, and Health Inequality and COVID-19 Infection in the United States.’ Journal of Racial & Ethnic Health Disparities 8 (3): 732–742.
- Adrian, T., and F. Natalucci. 2021. ‘Financial Perils in Check for Now, Eyes Turn to Risk of Market Correction.’ IMF Blog, January 27. https://blogs.imf.org/2021/01/27/financial-perils-in-check-for-now-eyes-turn-to-risk-of-market-correction/.
- Alveda, P., T. Ferguson, and J. C. Mallery. 2020. ‘To Save the Economy, Save People First.’ INET Blog November 18. New York: Institute for New Economic Thinking. https://www.ineteconomics.org/perspectives/blog/to-save-the-economy-save-people-first.
- Appelbaum, E., and R. Batt. 2020. ‘Private Equity Buyouts in Healthcare: Who Wins, Who Loses?’ INET Working Paper No. 118. New York: Institute for New Economic Thinking.
- Ben-David, I., D. F. Franzoni, R. Moussawi, and J. Sedunov. 2020. ‘The Granular Nature of Large Institutional Investors.’ NBER Working Paper 22247. Cambridge, MA: National Bureau of Economic Research.
- Besley, T., and P. Hennesy. 2009. ‘Letter to Her Majesty The Queen.' British Academy, July 22. London: British Academy. https://www.ma.imperial.ac.uk/~bin06/M3A22/queen-lse.pdf.
- Blundell, R., M. Costa Dias, R. Joyce, and X. Xu. 2020. ‘COVID-19 and Inequality.’ Fiscal Studies 41 (2): 291–319.
- Bourquin, P., R. Joyce, and A. Norris Keiler. 2020. Living Standards, Poverty and Inequality in the UK: 2020. London: The Institute for Fiscal Studies. https://www.ifs.org.uk/uploads/R170-Living-standards-poverty-and-inequality-in-the-UK-2019-2020%20.pdf.
- Braun, B. 2020. ‘Asset Manager Capitalism as a Corporate Governance Regime. Forthcoming.’ In American Political Economy: Institutions, Interests, and Inequalities, edited by J. S. Hacker, A. Hertel-Fernandez, P. Pierson, and K. Thelen. New York: Cambridge University Press.
- Case, A., and A. Deaton. 2020. Deaths of Despair and the Future of Capitalism. Princeton: Princeton University Press.
- Chappata, B. 2021. ‘Covid Housing Boom Is Even Bigger Than Imagined.’ Bloomberg Opinion, February 21. https://www.bloomberg.com/opinion/articles/2021-02-17/covid-housing-boom-is-even-bigger-than-imagined.
- Child Poverty Action Group. 2020. ‘Child Poverty: Facts and Figures.’ https://cpag.org.uk/child-poverty/child-poverty-facts-and-figures#footnoteref1_bdleu6p.
- Collins, C. 2020. ‘U.S. Billionaire Wealth Surges Past $1 Trillion Since Beginning of Pandemic — Total Grows to $4 Trillion.’ Blog Institute for Policy Studies. https://ips-dc.org/u-s-billionaire-wealth-surges-past-1-trillion-since-beginning-of-pandemic/?utm_campaign=ipsnews-120420&emci=d1f78969-5536-eb11-9fb4-00155d43b2cd&emdi=12d4c45d-5f36-eb11-9fb4-00155d43b2cd&ceid=3874843.
- Deuschl, G., E. Beghi, F. Fazekas, T. Varga, K. A. Christoforidi, E. Sipido, C. L. Bassetti, T. Vos, and V. L. Feigin. 2020. ‘The Burden of Neurological Diseases in Europe: An Analysis for the Global Burden of Disease Study 2017.’ The Lancet Public Health 5 (10): E551–E567. https://www.thelancet.com/journals/lanpub/article/PIIS2468-2667(20)30190-0/fulltext.
- Ferguson, T., P. Jorgenson, and J. Chen. 2019. ‘How Money Drives US Congressional Elections: Linear Models of Money and Outcomes.’ Structural change and economic dynamics, in press.
- Ferguson, T., P. Jorgenson, and J. Chen. 2021. ‘Big Money Drove the Congressional Elections – Again.’ INET Blog, February 11. New York: Institute for New Economic Thinking. https://www.ineteconomics.org/perspectives/blog/big-money-drove-the-congressional-elections-again.
- Franzoni, F. 2019. The Effects of Concentration in the Asset Management Industry on Stock Prices.’ VoxEU.org, June 3. https://voxeu.org/article/concentration-asset-management-industry-and-stock-prices.
- Furman, J., and L. Summers. 2020. ‘A Reconsideration of Fiscal Policy in the Era of Low Interest Rates.’ Brookings Institution. https://www.brookings.edu/wp-content/uploads/2020/11/furman-summers-fiscal-reconsideration-discussion-draft.pdf.
- Gabor, D. 2020. ‘Critical Macro-Finance: a Theoretical Lens.’ Finance and Society 6 (1): 45–55.
- Gabor, D. 2021. ‘The Wall Street Consensus.’ Development and Change 52 (3): 429–459.
- Galbraith, J. K. 1958. The New Industrial State.
- Galbraith, J. K. 1973. ‘Power and the Useful Economist.’ American Economic Review 63 (1): 1–11.
- Galbraith, J. K. 2021. ‘The Long Overdue Revolution in Economic Thinking.’ INET Podcast, March 1. https://www.ineteconomics.org/perspectives/podcasts/long-overdue-revolution.
- Giles, C. 2021a. ‘OECD Warns Governments to Rethink Constraints on Public Spending.’ The Financial Times, January 4, 2021.
- Giles, C. 2021b. ‘Rethink Public Finance Rules and Live with Much Higher Debt, IMF says.’ The Financial Times, January 28, 2021.
- Grice, A. 2015. ‘Food Banks: One Million Britons will Soon be Using them, According to Trussell Trust.’ The Independent, 18 April. https://www.independent.co.uk/news/uk/home-news/one-million-britons-using-food-banks-according-trussell-trust-10186142.html.
- Gupta, A., S. T. Howell, C. Yannelis, and A. Gupta. 2021. ‘Does Private Equity Investment in Healthcare Benefit Patients? Evidence from Nursing Homes.’ NBER Working Paper 28474. Cambridge, MA: National Bureau of Economic Research.
- Henwood, D. 2019. ‘Modern Monetary Theory Isn’t Helping.’ Jacobin, 21 February. Available at: https://www.jacobinmag.com/2019/02/modern-monetary-theory-isnt-helping.
- Hochlaf, D., H. Quilter-Pinner, and T. Kibasi. 2019. Ending the Blame Game. The Case for a New Approach to Public Health and Prevention. London: The Institute for Public Policy Research. https://www.ippr.org/files/2019-06/public-health-and-prevention-june19.pdf.
- Hope, D., and J. Limberg. 2020. ‘The Economic Consequences of Major Tax Cuts for the Rich.’ LSE International Inequalities Institute Working Paper 55. London School of Economics. http://eprints.lse.ac.uk/107919/1/Hope_economic_consequences_of_major_tax_cuts_published.pdf.
- Horton, R. 2020a. ‘Covid-19 has Exposed the Reality of Britain: Poverty, Insecurity and Inequality.’ The Guardian, 8 September. https://www.theguardian.com/commentisfree/2020/sep/08/covid-19-britain-poverty-insecurity-inequality-fairer-society.
- Horton, R. 2020b. ‘Alarming New Data Shows the UK was the ‘Sick Man’ of Europe Even before Covid.’ The Guardian, 18 October. https://www.theguardian.com/commentisfree/2020/oct/18/alarming-data-britain-sick-man-europe-before-covid.
- IMF. 2020. Fiscal Monitor: Policies for the Recovery. October. Washington, DC: IMF.
- IMF. 2021. Fiscal Monitor Update: January 2021. Washington, DC: IMF. https://www.imf.org/en/Publications/FM/Issues/2021/01/20/fiscal-monitor-update-january-2021.
- Islam, N., B. Lacey, S. Shabnam, A. M. Erzurumluoglu, H. Dambha-Miller, G. Chowell, I. Kawachi, and M. Marmot. 2021. ‘Social Inequality and the Syndemic of Chronic Disease and COVID-19: County- Level Analysis in the US.’ Journal of Epidemiology & Community Health 75: 496–500. https://jech.bmj.com/content/jech/75/6/496.full.pdf.
- Johnson, P. 2013. ‘Opening Remarks.’ Institute for Fiscal Studies. London. https://www.ifs.org.uk/budgets/sr2013/paul_johnson.pdf.
- Joyce, R., and X. Xu. 2019. Inequalities in the 21st Century: Introducing the Deaton Review. London: The Institute for Fiscal Studies. https://www.ifs.org.uk/inequality/wp-content/uploads/2019/05/The-IFS-Deaton-Review-launch_final.pdf.
- Jung, C., and S. Nanda. 2021. Tax and Recovery: Beyond the Binary. Why Raising Some Taxes This Year, Alongside a Bold Stimulus, is in Line with a Strong Recovery. London: Institute for Public Policy Research. https://www.ippr.org/research/publications/tax-and-recovery.
- Kane, E. 2020. Masters of Illusion: Bank and Regulatory Accounting for Losses in Distressed Banks. INET Working Paper 136. New York: Institute for New Economic Thinking.
- Keynes, J. M. 1936. The General Theory of Employment, Interest and Money. London: Macmillan.
- Lazonick, W., and M. Hopkins. 2020. ‘The $5.3 Trillion Question Behind America’s COVID-19 Failure.’ INET Blog. New York: Institute for New Economic Thinking.
- Lazonick, W., M. E. Sakinç, and M. Hopkins. 2020. ‘Why Stock Buybacks Are Dangerous for the Economy.’ Harvard Business Review, January 7. https://hbr.org/2020/01/why-stock-buybacks-are-dangerous-for-the-economy.
- Liao, T. F., and F. De Maio. 2021. ‘Association of Social and Economic Inequality with Coronavirus Disease 2019 Incidence and Mortality Across US Counties.’ JAMA Network Open. January 20. https://jamanetwork.com/journals/jamanetworkopen/ fullarticle/2775303.
- Lipsey, R. G. 2007. ‘Reflections on the General Theory of Second Best at its Golden Jubilee.’ International Tax and Public Finance 14: 349–364.
- Lipsey, R. G., and K. Lancaster. 1956. ‘The General Theory of the Second Best.’ The Review of Economic Studies 24 (1): 11–32.
- Macfarlane, L. 2021. ‘Rishi Sunak said He’d Protect the Vulnerable. So why is he making them pay? Open Democracy, March 4. https://www.opendemocracy.net/en/oureconomy/ rishi-sunak-said-hed-protect-the-vulnerable-so-why-is-he-making-them-pay/.
- Mankiw, N. G. 2015. Principles of Economics (7th Edition). Stanford, CT: Cengage Learning.
- Mankiw, N. G. 2021. ‘Can America Afford to become a Major Welfare State?’ The New York Times, September 15.
- Marmot, M. 2020a. Health Equity in England: The Marmot Review Ten Years On. Institute of Health Equity. https://www.health.org.uk/publications/reports/the-marmot-review-10-years-on.
- Marmot, M., J. Allen, and P. Goldblatt. 2020b. Build Back Fairer: The COVID-19 Marmot Review. The Pandemic, Socioeconomic and Health Inequalities in England. Institute of Health Equity. http://www.instituteofhealthequity.org/resources-reports/build-back-fairer-the-COVID-19-marmot-review/build-back-fairer-the-COVID-19-marmot-review-executive-summary.pdf.
- O’Connor, J. 1973. The Fiscal Crisis of the State. New Brunswick, NJ: Transaction Publisher.
- Palley, T. 2020. ‘What’s Wrong with Modern Monetary Theory: Macro and Political Economic Restraints on Deficit-Financed Fiscal Policy.’ Review of Keynesian Economics 8 (4): 472–493.
- Palma, J. G. 2020. ‘Finance as Perpetual Orgy: How the “New Alchemists” Twisted Kindleberger’s Cycle of “Manias, Panics and Crashes” into “Manias, Panics, and Renewed Manias”.’ Cambridge Working Paper in Economics 2094. University of Cambridge: Faculty of Economics.
- Politi, J. 2020. ‘Federal Reserve Debates Tougher Regulation to Prevent Asset Bubbles.’ The Financial Times, October 17.
- Pratley, N. 2021. ‘Veteran Investor is Right to Question Stock Market Exuberance.’ The Guardian, January 6. https://www.theguardian.com/business/nils-pratley-on-finance/2021/jan/06/veteran-investor-stock-market-jeremy-grantham-epic-bubble-wall-street.
- Saez, I., and G. Zucman. 2016. ‘Wealth Inequality in the United States Since 1913: Evidence from Capitalized Income tax Data.’ Quarterly Journal of Economics 131 (2): 519–578.
- Saez, I., and G. Zucman. 2019. ‘How wouLd a Progressive Wealth Tax Work? Evidence from the Economics Literature.’ Mimeo. https://eml.berkeley.edu/~saez/saez-zucman-wealthtaxobjections.pdf.
- Stansbury, A., and L. H. Summers. 2020. ‘The Declining Worker Power Hypothesis: An Explanation for the Recent Evolution of the American Economy.’ NBER Working Paper 27193. Cambridge, MA: National Bureau of Economic Research.
- Stewart, H. 2009. ‘This is How We Let the Credit Crunch Happen, Ma’am … ’. The Guardian, July 26.
- Storm, S. 2017. ‘The new Normal: Demand, Secular Stagnation, and the Vanishing Middle Class.’ International Journal of Political Economy 46 (4): 169–210.
- Storm, S. 2018. ‘Financialization and Economic Development: A Debate on the Social Efficiency of Modern Finance.’ Development and Change 49 (2): 302–329.
- Storm, S. 2021. ‘Cordon of Conformity: why DSGE Models are not the Future of Macroeconomics.’ International Journal of Political Economy 50 (2): 77–98.
- Tan, A. X., J. A. Hinman, H. S. Abdel Magid, L. M. Nelson, and M. C. Odden. 2021. ‘Association Between Income Inequality and County-Level COVID-19 Cases and Deaths in the US.’ JAMA Network Open 4 (5): e218799. https://jamanetwork.com/journals/jamanetworkopen/fullarticle/2779417.
- Taylor, L. (with Ö. Ömer) 2020. Macroeconomic Inequality from Reagan to Trump. Market Power, Wage Repression, Asset Price Inflation, and Industrial Decline. Cambridge: Cambridge University Press.
- Trussel Trust. 2020. ‘End of Year Stats.’ https://www.trusselltrust.org/news-and-blog/latest-stats/end-year-stats/.
- Tufekci, Z. 2020. ‘This Overlooked Variable Is the Key to the Pandemic. It’s not R.’ The Atlantic, September 30. https://www.theatlantic.com/health/archive/2020/09/k-overlooked-variable-driving-pandemic/616548/.
- Woolhandler, S., D. U. Himmelstein, S. Ahmed, Z. Bailey, M. T. Bassett, M. Bird, J. Bor, et al. 2021. ‘Public Policy and Health in the Trump era.’ The Lancet 397 (10275): 705–753.
Appendices
Table A1. Data set and sources.
Explanatory notes & sources:
1: Cumulative confirmed COVID-19 deaths per 100,000 population; source: Johns Hopkins University & Medicine, Coronavirus Resource Centre (https://coronavirus.jhu.edu/data/mortality); data up to February 23, 2021.
2: Percentage change in real GDP during 2019-2020; source: AMECO Database.
3: Additional public spending on COVID-19 relief (as percentage of GDP, until January 2021); source: IMF (Citation2020) October 2020 Fiscal Monitor Database of Fiscal Measures in response to COVID-19.
4: Additional public spending (in euros) on COVID-19 relief per person; sources: see (3); data on GDP and population are from AMECO Database.
5: Change in public debt (percentage points of GDP) during 2019-2020; source: AMECO Database.
6: Gini-coefficients (in 2019 or closest year to 2019); source: OECD Statistics (https://data.oecd.org/inequality/income-inequality.htm).
7: The income-share of the top 1% in 2019; source: World Inequality Database.
8: Percentage change in average life expectancy at birth (total population) during 2014-2018; source: World Bank’s World Development Indicators (https://data.worldbank.org/ indicator/SP.DYN.LE00.IN?name_desc = false)
9: Cumulative confirmed COVID-19 deaths per 100,000 population; source: Johns Hopkins University & Medicine, Coronavirus Resource Centre (https://coronavirus.jhu.edu/data/mortality); data up to September 21, 2021.
Cumulative confirmed COVID-19 deaths per 100,000 population on February 23 and September 21, 2021
The mortality data used in the empirical analysis are cumulative corona deaths (per 100,000 population) on February 23, 2021. Average cumulative COVID-19 mortality in the 22 OECD countries increased from 86.41 deaths (per 100,000) on that date to 109.38 (per 100,000) on September 21, 2021. The relative mortality positions of the 22 OECD countries did not significantly change (except for Greece), as shown in , which plots country-wise corona deaths (per 100,000) in February 2021 against deaths (per 100,000) in September 2021. The correlation is highly significant and the slope coefficient is 1.24, which indicates that cumulative COVID-19 mortality did increase by around 24% during these 7 months. Based on , one can conclude that the results of the empirical analysis will remain unchanged, in qualitative terms, when using more recent data on cumulative COVID-19 mortality.
Figure A1. Cumulative confirmed COVID-19 deaths per 100,000 population: February 23 (horizontal axis) versus September 21 (vertical axis), 2021.Sources: see . The estimated linear relationship is positive and statistically significant at 0.1%. The slope coefficient is 1.24.
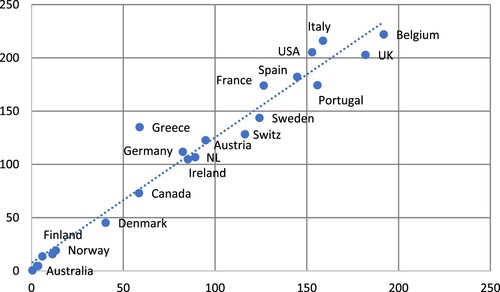
Cumulative excess deaths
There are concerns that reported COVID-19 deaths are underestimates of the true impact of the coronavirus on mortality. The Financial Times has gathered and analysed data on excess mortality — the numbers of deaths over and above the historical average. compares cumulative confirmed COVID-19 deaths per 100,000 (until February 23, 2021) and cumulative excess deaths per 100,000 (at different dates, all well before 23-2-2021). The comparison is problematic, because the data for cumulative confirmed COVID-19 deaths are from February 23, 2021, while the data for cumulative excess deaths are less recent — sometimes by two or three months. But if we consider Portugal, for which the time-gap between confirmed COVID-19 deaths and excess deaths is only nine days, we see that cumulative excess deaths are 40% higher than cumulative confirmed corona-deaths. Likewise, for the Netherlands, cumulative excess deaths are 26% higher than cumulative confirmed COVID-19 deaths.
For the U.S., the difference is negative; but this is due to mismeasurement. Cumulative excess deaths in the U.S. on January 16, 2021 were 467,897 persons, while cumulative confirmed COVID-19 deaths on February 23, 2021 (five weeks later) were 500,244 persons. More than 100,000 people died of COVID-19 in the U.S. in the 31 days of the month of January 2021 according to Johns Hopkins University data. Assuming that cumulative confirmed COVID-19 deaths in the U.S. were 100,000 deaths lower on January 16, 2021 than on February 23, 2021 (or 400,244 deaths), I find that cumulative excess deaths in the U.S. were around 17% higher than cumulative confirmed COVID-19 deaths in mid-January 2021.
For Belgium, cumulative excess deaths (20,169) on January 31, 2021, are lower than cumulative COVID-19 deaths (21,923) on February 23, 2021. Cumulative COVID-19 deaths on January would have been around 20,900 on January 31, 2021, which means excess deaths were around 3½% lower than confirmed corona-deaths. As explained in the main text, Belgian registration of COVID-19 fatalities is probably more comprehensive than that in any of the other 21 OECD countries in the panel.
However, as shown in , cumulative confirmed COVID-19 deaths per 100,000 are very closely and significantly correlated (at less than 1%) with cumulative excess deaths per 100,000.
Table A2. Cumulative confirmed COVID-19 deaths per 100,000 population (until February 23, 2021) and cumulative excess deaths per 100,000 population.
Figure A2. Cumulative confirmed COVID-19 deaths per 100,000 population versus cumulative excess deaths per 100,000 population. Sources: see . The estimated linear relationship is positive and statistically significant at 1%.
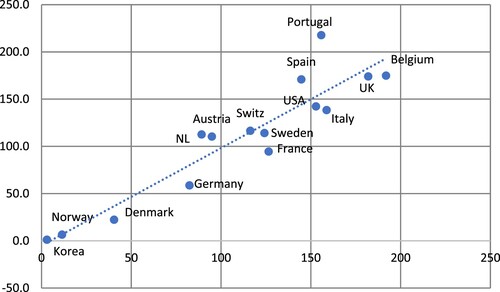
According to the World Obesity Federation (2021), countries with high levels of overweight people, such as the UK and the US, have the highest death rates from COVID-19. There is a strong relationship between obesity (and overweight) and low socioeconomic status, and in general, countries with higher income inequality have higher levels of obesity & overweight. This is shown in which plots the (after-tax-and-transfer) Gini coefficient against the proportion of men suffering from overweight and obesity (in the male population of a country).
Figure A3. After-tax-and-transfer Gini coefficients versus the proportion of men suffering from overweight and obesity. Sources: see . Data on the proportion of men suffering from overweight and obesity are from Global Obesity Observatory https://data.worldobesity.org/. Note: The estimated linear relationship is positive and statistically significant at 2.5% (when I exclude Japan from the regression).
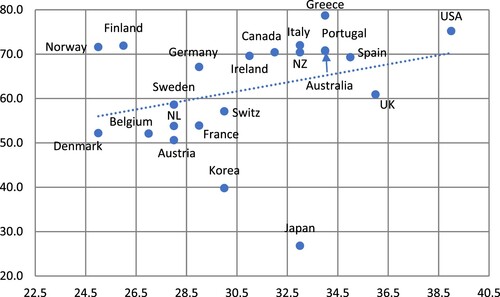
Inequality and overweight & obesity