?Mathematical formulae have been encoded as MathML and are displayed in this HTML version using MathJax in order to improve their display. Uncheck the box to turn MathJax off. This feature requires Javascript. Click on a formula to zoom.
ABSTRACT
The hundredth anniversary of Paolo Sylos Labini's birth seems an excellent opportunity to celebrate his contribution, particularly in light of the European post-COVID-19 extraordinary measures. These revived debates around the relationship between state and market, structural inequalities within Italy, and austerity (Papadimitriu et al. 2020; Palma 2020; Variato et al. 2020; Canelli et al. 2021). Inspired by a reflection on Sylos Labini's assessment of the Italian increasing debt/low-investment/low-growth decline, our rationale is the need to re-focus away from debt towards investment and growth. We compare this alternative focus to the theories underpinning austerity, including the Ricardian equivalence, the crowding-out argument, and the bond vigilantes hypothesis. Our work relies on wide-ranging data analysis and concentrates on three econometric models: a vector error correction model to analyse the relationship between public debt and GDP in the long-run; a vector auto-regression model, which analyses the relationship between GDP and the components of debt, interest rates spread, and exchange rate in the short-run; and an additional vector auto-regression model to examine the primary balance components, including fiscal spending and revenues. We find that Sylos Labini's warnings and his view of the relation between economic development and civil development are no less relevant today.
1. Introduction
Besides the theoretical contributions of Roncaglia (Citation1991, Citation1994) aimed at reconciling classical approaches involving Sylos Labini, this journal has previously published an article entirely dedicated to the Italian economist where Corsi (Citation2007) celebrated his work in the classical tradition and his interdisciplinary methodological principles, deemed to be essential to formulate effective policy responses to contemporary problems.
The present study stems from a series of events and considerations. First is the one-hundredth anniversary of Sylos Labini's birth in 1920. Second is the relevance of his legacy, particularly in light of the recent shift away from fiscal consolidation and the current European re-address of its fiscal rules. Only until recently, austerity was considered a post-COVID-19 priority by the former Italian government (Gualtieri Citation2020), while the current prime minister has described the EU's so-called Stability and Growth Pact as ‘obsolete’ (Migliaccio and Rotondi Citation2021). Nevertheless, a different pro-austerity bond vigilantes argument has been recently restarted (Gulyas and Skolimowski Citation2021; Wigglesworth et al. Citation2021). Rooted in Reinhart and Rogoff (Citation2010), this maintains that if budget deficit and debt-to-GDP ratio increase, surpassing a critical threshold, investors will doubt the country's ability to meet its debt obligations, and, as a result, will react by reducing their exposure. This pushes up the interest rate on government bonds. Third, Sylos Labini's critique of austerity was part of a broader accumulation theory developed in the classical tradition. His legacy is pivotal not only in re-emphasising the inadequacy of fiscal consolidation, which would exacerbate the crisis and jeopardise debt sustainability, but also in shifting the exclusive focus away from the debate around debt and growth towards a vision grounded on the interaction between economic and civil development. Finally, Sylos Labini's archive of publication is an invaluable source of information and documentation of his prolific intellectual activity which also includes various opportunities to reflect on the contribution of the classics (Associazione Paolo Sylos Labini Citation2021).
Underpinned by what Sylos Labini (Citation2003[Citation2009]) presented in 1948 at the Accademia Nazionale dei Lincei and then elaborated on by Pasinetti (Citation1998), the empirical part of our paper relies on his analysis of debt: we first consider the evolution of the sustainability areas of the public debt in relation to the primary and secondary deficit in a dynamic context, addressing specific pro-austerity arguments regarding the relationships between output and government debt. Then, we test whether output, fiscal deficit (including its breakdown into revenues and spending), spread, real interest rates, and exchange rates are interlinked and whether the relationships between these variables have changed since Italy joined the eurozone in 1999.
We find seven main outcomes. (1) In terms of debt sustainability, following Sylos Labini (Citation2003[Citation2009]) and Pasinetti (Citation1998), Italy seems to experience difficulties in various periods. (2) Growth affects public borrowing negatively, while public borrowing affects growth positively. (3) These relationships have become much weaker since joining the eurozone: public and private borrowings have traditionally moved symmetrically, but less so recently. In 2008–2015, the increase in public borrowing was insufficient to compensate for the reduction in private net borrowing, with an overall negative contribution to aggregate demand that exacerbated the crisis. Starting with the European Central Bank's intervention in 2015, foreign borrowing aided the recovery. (4) During the last three decades and the generalised balanced deficit objective pursued since 1991, only once, after the 2007 crisis, did the Italian economy move along a substantial countercyclical mechanism, where a deterioration of the primary balance was followed by an increase in output. The primary deficit is also affected mostly by growth pre-euro, but is not affected by any variables post-euro. (5) We find evidence of bond vigilantes, that is, the increase in the primary deficit leads to an increase in spread, but mostly pre-euro. However, the real interest rate and the spread have an impact on growth mostly post-euro. (6) By breaking down the components of the primary balance, we identify that, while both primary revenues and spending have a similar impact on growth pre-euro, fiscal spending has a larger impact on growth post-euro. (7) Finally, we also suggest that there has been a low-investment/low-growth vicious circle.
After a discussion of Sylos Labini's theory of accumulation as applied in his assessment of the Italian economy, we approach our work in three ways. First, we use a descriptive analysis of the variables at play. Second, we implement an econometric analysis through three models: a vector error correction (VEC) model to analyse the relationship between government debt and GDP in the long-run; a multi-dimensional vector auto-regression (VAR) model to analyse the relationship between output, the components of debt (primary balance and interest rate), spread, and the exchange rate in the short-run; and an additional VAR model to break down the primary balance into its revenues and spending components. Third, we clarify the dynamics between fiscal deficit and growth by using standard phase-plane diagrams.
2. Austerity Versus Recovery: A Lesson or Three We Did Not Learn
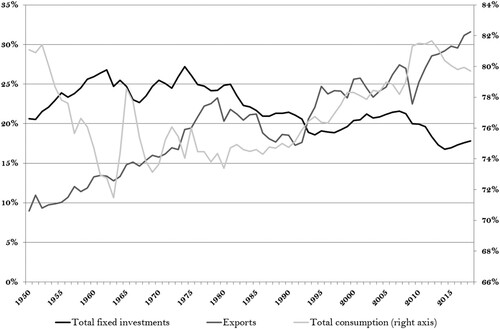
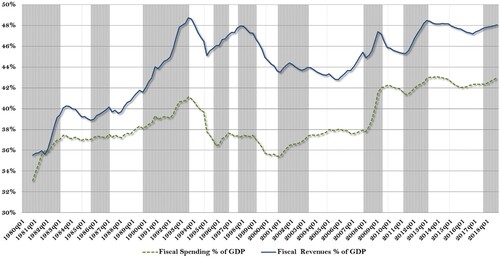
When the COVID-19 pandemic hit, Italy was suffering a long-term decline in investment and growth. shows the components of aggregate demand since 1950, with the exchange rate serving as a countercyclical tool until the 1990s, which allowed Italy to pursue a balanced budget policy without sacrificing too much in terms of aggregate demand. Nevertheless, as warned by Sylos Labini (Citation2003[Citation2009]), investment had been declining consistently over the last few decades, and at a faster pace more recently.
Figure 1. Total fixed investment, net exports, and consumption as a percentage of GDP (1950–2018). Source: IMF (Citation2019), ISTAT (Citation2019).
With this recent history as background, besides the top up of the existing 2014–20 REACT EU adopted at the end of 2020 and concentrating on 2021–22, the imminent recovery plan, namely the EU's long-term budget, coupled with NextGenerationEU, the temporary instrument designed to boost the recovery, will be the largest stimulus package ever financed through the EU budget.Footnote1 In Italy, the discussion around this plan, the so-called National Recovery and Resilience Plan (NRRP), and how it will be implemented as an opportunity to restructure the economy and boost investment within the country's long-term crisis, has caused political turmoil and a change of government cabinet.Footnote2 The recent political debate has shifted from a focus on public debt and on how to access sources of finance that could avoid its excessive build-up, with the previous government's priority to renew austerity (Gualtieri Citation2020), to an emphasis on ‘growth as the way out of the problem of high public debt’ (Prime Minister M. Draghi, quoted in Migliaccio and Rotondi Citation2021).
A number of the themes of this debate around the recovery plan provide an opportunity to revisit the analysis of Sylos Labini, who contributed to an assessment of the structural imbalances of the Italian economy after the accelerated growth rates experienced during its previous large recovery plan after the Second World War.
Sylos Labini's first major contribution is his diagnosis that the Italian economy suffers from a long-term decline that requires structural intervention and capital investment as opposed to income expenditure. His second contribution involves his reflection on the relation between economic and civil development and its relevance for the implementation of the NRRP. His third important contribution is his postulation that inequality as a drive for sluggish demand also triggers crises. Both of these contributions are aspects of his theory of accumulation. His fourth key contribution is his study of debt and austerity. These will be discussed in this section and represent the overarching theoretical framework of this article.
Sylos Labini's theory of accumulation is in open contrast with neoclassical theory in terms of the role of the state, his developmental view, and his method of enquiry, which was driven by historical contextualisation. It maintains that the state and the market are not two mutually exclusive agents: the state is seen as a possible promotor of a specific type of planning in cooperation with private agents aimed at overcoming structural deficiencies. Accordingly, because economic policy efforts must emphasise long-term development, his original analysis focused on Italy's previous experience of a recovery based on post-war fast growth, which was characterised by both bottlenecks and shortages on the supply side of the economy and required specific government-led sectoral measures with inevitable consequences in terms of employment (Fuà and Sylos Labini Citation1963; Sylos Labini Citation1962, Citation1995).
Sylos Labini saw the more recent decline of the Italian economy, and its low growth rates, vis-à-vis those of other industrialised countries during the last decades, as more than just symptoms of sporadic crises: he thought the country's decline was more structural. Using the inability of neoclassical economics to explain development, according to his classical economics perspective and within a general theory of development, he believed technological change to be pivotal in shaping production and that the understanding of this evolution ought to be historically contextualised (Sylos Labini Citation1984b, Citation2004, Citation2006).
Innovation, variations in market structure and income distribution drive economic development and decline in the system of thought that Sylos Labini uses to analyse the evolution of capitalism (Sylos Labini Citation1984b). In his function of productivity, positive factors are related to innovations with direct and indirect references to Schumpeter (Sylos Labini Citation1984b): first, the size of the market which stimulates the division of labour, and, with it innovations (as per Smith), within and between firms, leading to concentration and diversification respectively. Second, the increasing ratio of the labour cost per unit of product and the price level which pushes innovative re-organization of production to use labour more efficiently (the so-called re-organization effect). Third, the increasing labour cost vis-à-vis the cost of capital: (the so-called Ricardo effect). Unlike the neoclassical approach, Sylos Labini considers the degree of competition as pivotal in determining the magnitude of the Ricardo and re-organisation effects: higher levels of competition correspond to lower chances for the entrepreneurs to pass the cost increases on the prices. As a result, they will have more incentives to increase labour productivity innovating either by re-organisation effect or Ricardo effect. Finally, while past investments have a positive effect, his productivity function is negatively affected by current investments: this is justified by the time necessary to conform organisational and productive processes to the new machineries for instance (Corsi and Guarini Citation2007; Guarini Citation2007).Footnote3
Accordingly, an endogenous technological development is interconnected with the increase in income and labour productivity where investment plays a crucial role. His theory of accumulation relies on demand changes exogenous to the firm. These might support effective demand so that productivity increases do not cause unemployment. Income distribution feeds back in the accumulation process and might endanger the evolution of effective demand when either wage increases are lower than productivity increases and there is an excessive profit accumulation, or, on the contrary, low profit accumulation, as a result of wage increases higher than increases in productivity, represents a disincentive to invest.
Just like for Keynes, then, in general, persistent unemployment is the result of an insufficient effective demand and requires a ‘push, such as public expenditure and foreign demand’ (Sylos Labini Citation1993, p. 251). Nevertheless, in contrast to when Keynes was writing, for Sylos Labini in Italy in the last decades, ‘the problem is not to re-activate aggregate demand to previous levels; the fundamental problem is to increase the productive capacity, not only and not so much through an expansion of existing firms, but mainly through new firms’ (Sylos Labini Citation1995, p. 76). His reference here is to the new industrial revolution and evolution of information technology, which requires research and development and sufficient levels of education and re-qualification to enable Italy to compete internationally and avoid the trap of technological unemployment. There is an obvious comparison with the requirements of the recovery funds for the investment in both digital and green economy (European Commission Citation2021).
In open contrast with a vision of ‘easy and indiscriminate spending’ (Sylos Labini Citation1984a, p. 404), which is often passed as Keynesian, Sylos Labini was in favour of a schooling and research and development system that could support production activities as integrated aspects of the economy (Sylos Labini Citation1989). Accordingly, the start of the Italian decline, then, in his view, could be dated to the beginning of the 1960s when wages started increasing faster than productivity, endangering profit and capital accumulation and triggering a long-term recessionary tendency, which was then accompanied by a reduction in investment (Sylos Labini Citation1972[Citation1977], p. 165). This is not to say that Sylos Labini would have supported a lower salary increase: on the contrary, he was aware that the labour conditions in the factories triggered conflicts with trade unions and a re-organisation of production away from large firms towards smaller firms where unionisation was less intense and irregular labour market conditions were/are the norm. Moreover, he was aware that labour market liberalisation coupled with globalisation (which brought lower wages and more relaxed labour safety regulations) increased inequality in the distribution of income, which was a crucial contribution to the crisis (Sylos Labini Citation1972[Citation1977]).
Instead, he argued that the amount of public expenditure had always been insufficient since, he argued, the crisis had a structural character, and, as a result, it had to be addressed with a long-term strategy of larger capital expenditure and investment in infrastructure. This is relevant today because of the many concerns about the inadequacy of the recovery plan in terms of the magnitude necessary to boost the recovery (Palma Citation2020; Papadimitriou, Zezza, and Zezza Citation2020; Variato, Maranzano, and Romano Citation2020; Canelli et al. Citation2021). The OECD-forecasted growth rates are insufficient for the GDP to rebound to 2019 levels until 2025. If our calculations are correct, the recovery plan should amount to 11.18 per cent of the 2019 GDP. Variato, Maranzano, and Romano (Citation2020), for example, have voiced their concern that structural interventions, as opposed to ad hoc temporary measures, require the institutional infrastructure of public enterprises as a strategic development agent (in reducing import in key strategic sectors) in the implementation of a complex general vision.
This leads to the second major contribution of Sylos Labini about the relation between economic and civil development that is immediately linked to an initial evaluation of the NRRP. For Sylos Labini, there is a circular relation between economic and civil development: economic development entails a continuous restructuring of the economy, while civil development has a complex definition involving a number of parameters (Corsi and Guarini Citation2010).Footnote4 This relation is bidirectional and it might be discontinuous (Sylos Labini Citation1989, Citation1993). The channels through which development affects growth involve institutions, including the market, which, unlike often believed is not a vacuum of rules (lassaiz faire), quite the opposite, it is a historically determined institution. Education is also fundamental. On the other hand, growth influences development through entrepreneurship, employment which reduces marginalisation, and research and development which influence the quality of jobs so essential to civil development. However, there are limits to how economic development can contribute to civil development after primary needs are satisfied: for example further growth might brings environmental issues. As technological innovation spurs growth, so it can tackle environmental issues, as long as it is support by public intervention at national and international level (Sylos Labini Citation1984b).
This view is echoed in the current debate about the NRRP which lack of a throughout analysis of the country economic structure that would provide a framework to integrate its various parts and would highlight the sectors in which Italy is behind other European countries, research and development in primis (Maranzano, Noera, and Romano Citation2021). Lucchese and Pianta (Citation2021) also criticise the plan for its lack of a strategy that could integrate its fragmented parts in order to develop specific expertise and high quality jobs and an improvement of the entire productive system that could satisfy the demand activated by the new resources. These concerns are echoed by the recent annual relation of the Central Bank of Italy warning about a ‘vicious cycle of low wages and limited job opportunities’ (Visco Citation2021, p. 10). German to this is the risk that the expansionary policy will impact the trade balance, because of import of goods and services, both high tech and linked to the ecologic transition, as highlighted by one of the simulations of the RNNP. Two further concerns about the fragmented character of the plan are related to its governance and lack of clarity about how various central and local institutions will interact, and to the uncertainty about the allocations of funds to the regions whose (economic and civil) development is lagging behind, which Sylos Labini was so concerned about.Footnote5
With respect to Sylos Labini's third key contribution, the imbalances that accompanied the post-war fast growth rates caused an uneven income distribution across both social classes and geographic Italian areas. Thus, his income distribution theory is pivotal to his accumulation scheme. This is not determined by the neoclassical relative scarcity of factors of production, but by the classical economic and socio-political features that influence the effective demand. In this system of thought, then, the lack of macroeconomic re-equilibrating devices might be causing persistent unemployment (Fuà and Sylos Labini Citation1963; Sylos Labini Citation1962, Citation1995). The inequalities within Italy have remained relevant in the last decades, and various analysts have voiced concerns that these will not be overcome with the recovery plan (Fleming et al. Citation2020; Pastore Citation2020; Ghiglione and Romei Citation2021).
shows the unequal income distribution across various Italian regions, with a richer and industrialised Northern part as opposed to a mainly rural Southern part whose development is lagging behind. For Sylos Labini, unless this was tackled, the effects on demand would persist (Fuà and Sylos Labini Citation1963).
Table 1. GDP and GDP per capita 2017 in Italy (current prices, million euros).
Sylos Labini's fourth major contribution is that a narrow focus on debt as opposed to a growth vision seems to ignore the fact that the current crisis is not one of liquidity or of credit provision: in the first quarter of 2021, there was consistently strong demand for Italian bonds. On 11 February 2021, Italy recorded the highest demand since 2019: it sold 4 billion euros of its seven-year bond at a yield of 0.18 per cent, and investors offered to buy 1.47 times the amount of securities that were sold; it sold 3 billion euros of its three-year bond at a yield of −0.33 per cent, and investors offered to buy 1.66 times the amount of securities sold; it sold 2 billion euros of its 20-year bond at a yield of 1.80 per cent, and investors offered to buy 1.27 times the amount of securities sold. On 1 March 2021, Italy sold 2 billion euros of its 15-year bond at a yield of 1.26 per cent, and investors offered to buy 1.47 times the amount of securities sold. On 13 April 2021, Italy sold 4 billion euros of its 3-year bond at a yield of −0.17 per cent, and investors offered to buy 1.38 times the amount of securities sold (Bloomberg Citation2021).
Inspired by these considerations, and with the prospect of the recovery plan, we now turn to the theory underpinning our empirical investigation, tackling various arguments that have supported austerity measures in the past. We address each of these arguments theoretically in the next sub-section and introduce how we will address them empirically in Section Four.
2.1. Debts and Sustainability According to Sylos Labini
Following Pasinetti (Citation1998) and Sylos Labini (Citation2003[Citation2009]), we follow their critique to the idea that a certain debt-to-GDP ratio, as it is incorporated in the Euro-Plus Pact, is too static and arbitrary. Instead, debt sustainability should be addressed by a complex and highly dynamic relationship between debt and growth and their interaction with other variables.
The sustainability à la Domar (Citation1944), which compares the interest rate on government debt and the growth rate, adopted heterodox analyses after the 2007–2008 crisis (e.g., Taylor et al. Citation2012), was criticised by Sylos Labini (Citation2003[Citation2009]) for several reasons. First, sustainability should be analysed at both macro and micro level, and not only in terms of solvency, but also in relation to investment. In other words, if the increase in debt is aimed at increasing production, then it generates revenues. In the case of public debt, an increase in revenues does not lead to a tax burden. However, an increase in debt aimed at financing previous deficit or interest payments is problematic in terms of sustainability. This argument leads to our first analysis in Section Four on the relationship between growth and debt. We adopt the theoretical mechanism identified by Sylos Labini (Citation2003[Citation2009]) over the period considered and find that while growth leads to debt reduction, the reduction of debt does not lead to growth in the period under consideration.
Second, contrary to the Harrod–Domar oversimplified difference between the rate of growth and the interest rate on debt, both Sylos Labini (Citation2003[Citation2009]) and Pasinetti (Citation1998) believed that sustainability is defined by areas (as opposed to levels), delimited by the different possible combinations of the ratio of primary and secondary deficit to GDP, debt-to-GDP ratio, interest rates, and rates of GDP growth. As a result, in excluding a series of possible solutions given by the dynamic interactions between the variables involved, the Stability and Growth Pact's selection of a certain level of debt/deficit to GDP is arbitrary. We show that the difference between the interest rate and the growth rate needs to be considered not only in terms of the Keynesian liquidity trap but also, as emphasised by Sylos Labini (Citation2003[Citation2009]), in terms of real economy whereby interest rates and growth rates would have to be aligned even when growth is negative. Following on from this, Pasinetti (Citation1998) and Sylos Labini (Citation2003[Citation2009]) defined an area of sustainability formed by (a) the ratio of primary deficit to GDP, which identifies the capacity of debt servicing, and (b) the ratio of debt to GDP multiplied by the difference between the interest and growth rates.
In our empirical approach, we follow this approach by considering the evolution over time of the two relationships, instead of those considered by Pasinetti (Citation1998), which were aimed at reviewing the Stability and Growth Pact across countries at one specific time. The policy implications of this approach are clear: the condition of sustainability requires that the deficit stays within the area of sustainability when debt is not increasing. The condition related to the primary deficit is necessary when, within an indebted economy, the interest rate is larger than the growth rate, but the condition is superfluous when the growth rate is higher than the interest rate. In the Italian case, the analysis of primary deficit is especially crucial because of the bond vigilantes hypothesis, according to which, financial markets interpret an increase in the deficit and/or an increase in the ratio of debt to GDP as a risk factor to be rewarded by an additional market premium. This mechanism implies a nonlinearity of the difference between the interest rate and the growth rate: our analysis also tests this hypothesis.Footnote6
Third, sustainability is generally linked to public debt as an indicator of the financial strength of a country, and it generally ignores private debt (Quadrio-Curzio Citation2011). However, besides their contribution to aggregate demand, Sylos Labini (Citation2003[Citation2009]) suggests that public finances are hit in terms of liquidity provision if private debt becomes excessive. Therefore, the sustainability of public debt must be considered in conjunction with households’ and firms’ private debt. We consider the net borrowing flows by sector as per Godley and Cripps (Citation1993): a positive level of net borrowing (spending in investment, consumption, interest, and taxes minus income) for one sector indicates its contribution to aggregate demand, for any given level of current account, unless foreign borrowing increases. Thus, public and private borrowings should move symmetrically. This type of analysis has also been adopted by Taylor et al. (Citation2012) for the United States. Our analysis in Section 4.1 shows that during the 2007–2008 crisis, public debt did not compensate for the decrease in private debt, contributing negatively to aggregate demand until 2013, when, because of the European Central Bank's intervention, external debt compensated for the decline in internal private debt.
3. Data, Methodology, and Econometric Specification
3.1. Data and Methodology
We use quarterly data from 1980 to 2018 gathered from the Bank of Italy (Citation2016), the International Monetary Fund (IMF) (Citation2019), and the Italian National Institute of Statistics (ISTAT Citation2019). All variables, except the real interest rate (INT),Footnote7 the bilateral exchange rate between the Italian lira and the US dollar (ITLUSD),Footnote8 and the spread (SPREAD),Footnote9 are expressed in 2010 prices. Shaded areas in the graphs represent recessions, defined by the OECD recession indicators from the peak through the trough.
The analysis is based on descriptive observations and the econometric estimation of three models: VAR and VEC models have become standard practice since Blanchard and Perotti’s (Citation2002) study of fiscal shocks in the United States. These models allow for an analysis of short-term relationships (VAR models) and co-integrating long-run relationships (VEC model) where the variables are endogenous. The originality of our study is in applying this methodology to Italian data and to investigating the relationship between fiscal variables following a heterodox approach (Barbosa-Filho et al. Citation2008; Taylor et al. Citation2012).
We first look at the relationship between net gross debt and growth in a long-run context over the last three decades: we detect the evolution of the sustainability areas for the public debt for both the primary and secondary deficit following the Sylos Labini–Pasinetti relations. In the first model, Model 1 (the VEC(2), where the ‘2’ indicates two lags), following Campbell, Lo, and MacKinlay (Citation1996), all variables (GDP, DEBT, SPREAD, ITLUSD) are used in their logarithmic form, except the real interest rate, which can take both positive and negative values. The number of lags for each model is determined by the standard selection criteria, namely the Akaike, Schwarz, and Hannan–Quinn information criteria (Grasa Citation1989) (see Appendix). We tested for the presence of unit roots for all variables by using the augmented Dickey–Fuller test and the Phillips–Perron test. There is evidence of serial correlation for all of the variables, indicating non-stationarity in levels and stationarity in first differences. The VEC model uses the first differences of the logarithm of GDP and debt. The other variables in their log forms are included in the model as exogenous. The Johansen test confirms that the two variables, GDP and gross debt, are co-integrated (see Appendix).
In summary, following the methodology of Taylor et al. (Citation2012) and Barbosa-Filho et al. (Citation2008), Model 1 provides the long-run relationship between the quarterly growth of real public debt [D(LOG(DEBT))] and quarterly real GDP growth [D(LOG(GDP))]. We use interest rates, spread, and exchange rate as exogenous variables. We estimate this relationship by controlling for recessions and test whether there is Granger-causality between them (see Appendix).
The second model, Model 2, analyses the relationship between deficit and output. We ran a VAR(2) model to assess the short-run relationship between the components of the deficit (primary balance and interest rate) and the spread and exchange rate (GDP, PRIMARY_BALANCE, INT, SPREAD, ITLUSD). We use these variables without any transformations following the methodology suggested by Sims, Stock and Watson (Citation1990).
The third model, Model 3 (VAR(2)), includes the breaking down of the components of the primary balance into revenues and spending (GDP, PRIMARY_REVENUES, PRIMARY_SPENDING, INT, SPREAD, ITLUSD).
For both Model 2 and Model 3, we analyse the variance decomposition, which indicates the amount of information each variable contributes to the other variables, to see how much of the error variance of each of the variables can be explained by exogenous shocks to the other variables. For both of these models, we report the impulse response functions in the Appendix.
In addition to the econometric models above, following Taylor et al. (Citation2012), we look at the relationship between growth and the primary deficit by using a phase-plane analysis of the dynamics between the deficit-to-GDP ratio and real GDP growth.
A further consideration relates to the choice of using gross debt instead of net debt, since a country could be selling off its public assets over time (Arestis and Sawyer Citation2014). We use gross debt for a number of reasons. The first are practical: the differences between the changes in net and gross debt are relatively modest for Italy (OECD Statistics Directorate Citation2016), the holders of financial assets might not be the same agents owing debt, and data on gross debt are more available and comparable across countries. Second, gross assets are likely to be illiquid, and there are legal restrictions on selling them in Italy.
3.2. Model Specification
In this section, we implement the various phases of our empirical research summarised in : these refer to the different hypotheses on the relationships between the macroeconomic variables that affect debt. The vertical arrows define increments and decrements, while the horizontal arrows show the causality directions as described by the economic mechanism in the literature.
Table 2. Nexuses between variables (output, fiscal balance, government debt, interest rate, spread, and exchange rate).
The first row describes the first part of our analysis, which focuses on the Sylos Labini–Pasinetti sustainability areas. As discussed in the theoretical part of this article, sustainability is here viewed as the combination of the variables at play, rather than the level of debt to GDP. This approach reveals a dynamic between growth on the one side and debt (in the long-run) and deficit (in the short-run) on the other side. We define the dynamic relationship not only in terms of its evolution over time but also in terms of the relationship between debt sustainability and growth. This is determined by what the debt is going to finance: whether, for example, it is destined to productive investment or to pay for interest on current stock of debt. In the second row, we see that the fiscal deficit can lead to an increase (the generic Keynesian view) or reduction in growth (EU Stability and Growth Pact).
Equations (1) and (2) indicate the debt sustainability areas according to Pasinetti (Citation1998):
(1)
(1) where D is public debt at the end of the year,
is the yearly rate of growth in public debt, and g is the yearly GDP growth rate.
Therefore, the primary balance sustainability areas could be defined as
(2)
(2) where
is the public annual primary surplus, R > 0 are annual public revenues, G > 0 is public annual expenditure net of interest, S defined as −ΔD is the annual public unbalance (surplus or deficit), and i is the annual nominal rate of interest.
An important note is to clarify that, in this article, we refer to the Sylos Labini-Pasinetti sustainability areas since Sylos Labini (Citation2003[Citation2009]) mentions the Pasinetti relation to evaluate public debt sustainability. However, on the one hand, in criticising the EU Stability and Growth Pact, Pasinetti (Citation1998) provided a comparative dynamic analysis; on the other hand, Sylos Labini (Citation2003[Citation2009]) concentrated on the evolution of this dynamic within each country.
A primary surplus compatible with the sustainability area depends on the combination of the various variables: for any given growth rate, the higher the ratio of debt to GDP, the higher the ratio of primary balance to GDP would be needed to remain in the sustainability area. This is one of the main findings of the Sylos Labini–Pasinetti relations: the sustainability area could be maintained even with a permanent primary deficit, under the condition that the GDP growth offsets, or more than offsets, the growth in public debt. The initial level of the ratio of debt to GDP is irrelevant for its sustainability, even when we also consider the extreme case of an interest rate higher than the GDP growth rate. However, this is the only case that requires a balanced primary budget. The interest rate can remain above the GDP growth rate and can increase as a result of a surge in the debt-to-GDP ratio. In this case, the borderline of the sustainability area defined by i to g will not be linear, but it would kink when the interest rate increases rapidly. This was the case in Italy during the 1992 crisis, and during the 2007–2008 crisis when there was an increased fragility of public finances. The mechanism underlying this dynamic is based on the behaviour of financial markets (bond vigilantes), which interpret an increase in the debt-to-GDP ratio or deficit-to-GDP ratio as a signal of increasing risk of government bonds and, as a result, demand higher yields.
We then look at those relations defined as ‘fiscal effect’ in : for the long-run, the variables are debt and GDP growth, analysed in Section 4.1 using Model 1. We test for co-integration and causality between changes in debt and growth, and we look at net private and public borrowings. In Section 4.2, we analyse the short-term relationship between primary deficit and GDP growth. In the first part, we investigate how deficit and growth interact as per the fiscal effect in the short term, and, in the second part, how growth and deficit interact with other variables such as spread, interest rates, and the exchange rate. In the third part of Section 4.2, we include the components of the fiscal deficit, revenues, and spending, as per the literature on the composition of the fiscal package. The breakdown between revenues and spending and their effects on growth addresses the unusual case of deficit stabilisation with a debt increase associated with a positive fiscal balance, namely the circumstances in Brazil and Italy in recent years.
The dynamics of the investment–saving and liquidity-preference–money-supply (IS–LM) model (shown in and then analysed in Model 2) allow us to study the relationship between interest rates and GDP growth and to introduce the bond vigilantes hypothesis with Model 3. We conclude our econometric analysis with the case of expansionary devaluation currently fashionable among euro-sceptics, using Model 2.
4. Empirical Analysis
4.1. The Relationship Between Growth and Borrowing
In this section, we analyse the evolution of sustainability according to Sylos Labini–Pasinetti areas in the context of long-term growth decline and debt accumulation: we explain how growth has affected debt negatively during the period under consideration but not vice versa. Finally, we incorporate private debt into the analysis, since it might cause issues of liquidity provision and solvency that not only could affect public finances, but could also impact aggregate demand (Sylos Labini Citation2003[Citation2009]).
shows quarterly data in Italy on GDP growth, government debt, interest payments, and primary balance as a share of GDP, and the real interest rate from 1980 to 2018. The increase in gross debt in the 1980s halted in 1997 and remained relatively stable, with a declining trend until 2007, and started growing again during the Great Recession, from 102 per cent of GDP in the last quarter of 2007 to 138 per cent of GDP by the end of 2018. The first surge was accompanied by an increase in the real interest rate, which contributed to the increase in interest payments. Since joining the euro, interest payments in Italy declined significantly following a decline in both nominal and real interest rates, until 2009 when it started rising again.
Figure 2. Real interest rate, GDP growth, primary balance as a percentage of GDP, interest payments as a percentage of GDP, and gross debt as a percentage of GDP (1980–2018) in Italy. Source: IMF (Citation2019), ISTAT (Citation2019).
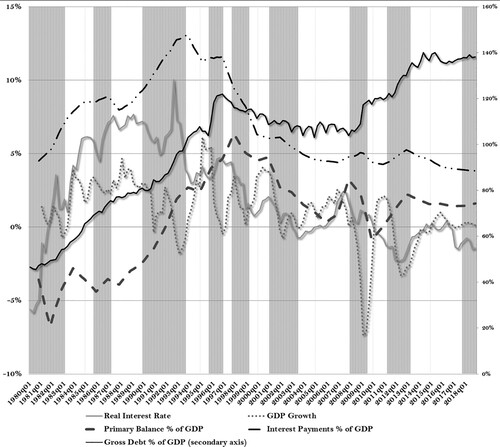
The real interest rate generally remained above the GDP growth rate in the pre-euro period, while an increase in GDP growth from 1999 to 2006 allowed a reduction in gross debt from 115 to 106 per cent of GDP. On average, the difference between these two rates was around −2.6 per cent before joining the euro, with a peak of about 9 per cent in the third quarter of 1992 and in the first quarter of 2009. Since the Great Recession, despite relatively low nominal interest rates, the real interest rate remained above GDP growth by about 0.2 per cent.
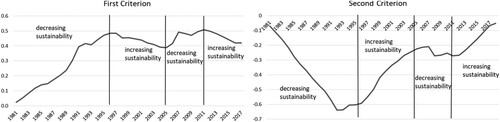
In , we observe the evolution of the sustainability of debt according to the two criteria developed by Sylos Labini, who, unlike a cross country comparison of Pasinetti (Citation1998), focused on the evolution of the variables over time.
Figure 3. Evolution of the sustainability of Italian public debt following Sylos Labini (first criterion on the left graph, second criterion on the right graph) (1982–2018 — cumulative values). Source: IMF (Citation2019), ISTAT (Citation2019).
His first criterion is defined by equation (2) such as:
(3)
(3) The difference between brackets is what Sylos Labini (Citation2003[Citation2009]) identifies as the ‘Pasinetti relation’. Nevertheless, because he thought that all the variables involved might change dramatically both in the short as well as in the long run, so that individual years might be misleading, he decided to focus on the sum of the annual differences between SP/Y and (i_–g) D/Y. If
is systematically lower than
then, the relation is decreasing indicating issues of sustainability. However, if debt and GDP grow at the same rate, then it is sufficient to consider (i-g) to evaluate debt sustainability.
His second criterion is defined as:
(4)
(4) As expected, the two graphs are specular: when the curve related to the first criterion is ascending, then sustainability decreases. Until the introduction of the euro, sustainability decreased because of the significant increase of D/Y (). The second criterion shows that after the introduction of the euro, sustainability generally improved despite the increase of D/Y after 2010. This is due to the reduction in the interest rate (i) rather than an increase in growth (g).
In , by implementing our first econometric analysis using Model 1, we test for co-integration and causality between GDP and debt. After controlling for the impact of the real interest rate, spread, and exchange rate, the impulse response functions in show a negative response of debt to GDP and a positive response of GDP to debt. The negative relationship between GDP and debt in Italy is only apparently in line with the finding of the cross-country study of Reinhart and Rogoff (Citation2010) which is the theoretical backbone of the bond vigilantes hypothesis, recently resumed as a pro-austerity argument (Gulyas and Skolimowski Citation2021; Wigglesworth et al. Citation2021). Unlike Reinhart and Rogoff (Citation2010), who studied a panel of 44 countries spanning about 200 years, we focus on time series and have not tested the non-linearity hypothesis, concentrating on the causality of the relation between debt and growth. However, the high debt-to-GDP ratio seems to be the result and not the cause of low growth rates in the short-run: in fact, changes in the Italian debt levels are Granger-caused by changes in Italy's GDP and not vice versa. This result is not confirmed in the long-run, however.
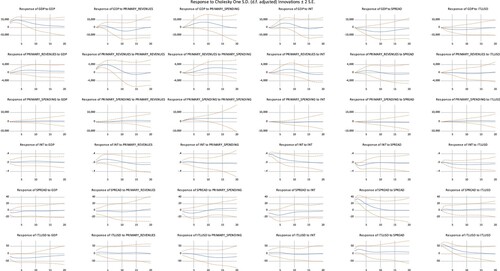
Figure 4. Impulse response functions to innovations of one standard deviation for Model 1.
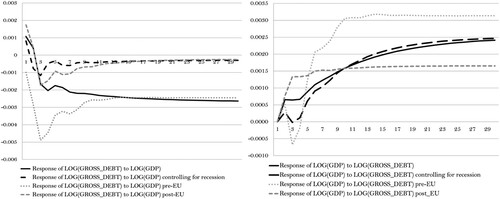
Figure 5. Government, private-sector, and foreign net borrowing as a percentage of GDP (1991–2018) in Italy. Source: ISTAT (Citation2019).
We run the model, splitting the sample into two parts: pre-euro (1980–98) and post-euro (1999–2018). For the pre-euro period, the response to innovations appears to be stronger than for the whole sample. Changes in debt are Granger-caused by changes in GDP in both the short-run and the long-run. For the post-euro period, in contrast, the response to innovations appears to be weaker, and there is no Granger-causality in either direction. As a consequence of stagnating growth and modest debt decrease up until the Great Recession, variables were less dynamic and less responsive.
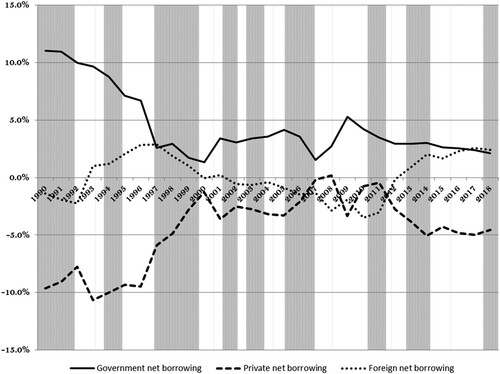
Finally, we consider the relationship between private and public borrowings: on the one hand, in terms of sustainability, excessive private borrowing might weigh on public finances when issues of liquidity provision arise (Sylos Labini Citation2003[Citation2009]). On the other hand, following Barbosa-Filho et al. (Citation2008) and Taylor et al. (Citation2012) in similar studies concentrating on the US economy, we address the net borrowing flows as per Godley and Cripps (Citation1993): for any given level of current account balance, private-sector net borrowing necessarily mirrors public-sector net borrowing, unless foreign debt is growing. A positive level of net borrowing (spending in investment, consumption, interest, and taxes minus income) in one sector indicates its contribution to aggregate demand. We investigate these patterns for the Italian economy and find that, as shows, traditionally, except for the 1992 crisis, public and private net borrowings behaved symmetrically until 2008. In 2009, the increase in public-sector net borrowing (2.6 per cent) did not fully compensate for the reduction in private-sector net borrowing (−3.5 per cent). This contributed negatively to aggregate demand, exacerbating the crisis. Since 2013, after the 2012 pledge by Mario Draghi, the European Central Bank President at the time, to do ‘whatever it takes’ to prevent the euro from failing, foreign borrowing increased.
Our empirical observation of the relationship between public and private debt leads to an additional investigation inspired by another lesson of Sylos Labini: if the role of public debt is to encourage financial activities as a way to transfer revenues and expenses over time, then a reduction in the public debt leads to an increase in private debt. A high debt-to-GDP ratio reveals a disequilibrium between public and private financing activities (Pasinetti Citation1998).
4.2. The Relationship Between Growth, Deficit, Interest Rate, Spread, and Exchange Rate
4.2.1. Fiscal Deficit and Growth
Having analysed the relationship between debt and growth, we now focus on the relationship between fiscal deficit and growth. A standard analysis of this relationship relies on the Ricardian equivalence (Barro Citation2009), which posits the irrelevance of governments’ fiscal package financing. Accordingly, only a permanent change in the level of spending matters: lower taxes and a government deficit today are associated with higher taxes in the future. Consumers fully anticipate this, saving the entire amount of tax relief to meet future tax hikes. Therefore, a decrease in public savings is completely offset by an equivalent increase in private savings, leading to a decrease in current consumption, given the expectations of higher taxes, and hence, of a decrease in future output, since private consumption is a larger component than public spending. By the same token, a decrease in government spending that reduces the deficit would boost consumption immediately, giving a theoretical underpinning for expansionary austerity.
We undertake this analysis through a phase-plane diagram () and then, through our second econometric analysis, by using a multi-dimensional VAR model (Model 2). Next, we add the breakdown of the components of the primary fiscal balance, changes in revenues and spending, thereby using our VAR Model 3. Models 2 and 3 also allow us to focus on the bond vigilantes hypothesis, and using this, we focus again on the breakdown of the deficit into revenues and spending.
Figure 6. Countercyclical fiscal policy in Italy: debt-to-GDP ratio and primary deficit as a percentage of GDP (1981–2018). Source: ISTAT (Citation2019).
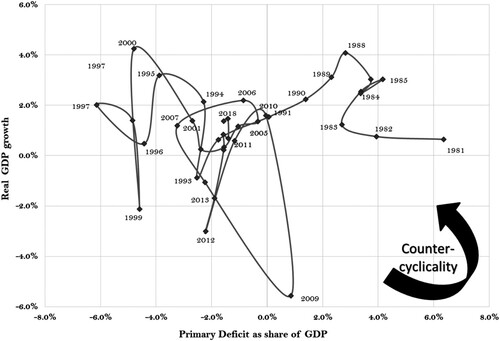
shows a phase-plane diagram depicting the relationship between the primary deficit as a share of GDP and real GDP growth rates since the 1980s. A countercyclical movement describes a decrease in deficit followed by an increase in growth. A contractionary or non-expansionary austerity can be observed when there is movement from the top right to the bottom left of the graph.
Italy has maintained a primary fiscal surplus since 1991, except in 2009. Countercyclical movements can be seen in only two episodes: during the second half of the 1980s and between 2007 and 2011. However, unlike in the more recent period, the pre-euro cyclical movements were associated with significant devaluations during periods of recession, such as 1981, 1983, 1992–93, and 1996 (IMF Citation2019). For the post-euro period, data show the role of automatic stabilisers in the decrease in fiscal balance: the balance between revenues and spending of the system of automatic stabilisers goes from a mere −0.1 per cent of GDP in 2008 to −0.6 per cent of GDP in 2009 and −0.7 per cent of GDP in 2010 (Massera, Pirastu, and Ventro Citation2012), while Italy experienced the largest fiscal deficit of the period in Q4 of 2009, 0.85 per cent of GDP.
We now extend our analysis of the relationship between deficit and output for the two sub-periods: the results are presented in and .
Figure 7. Variance decomposition using Cholesky factors of Model 2 (1980–98).
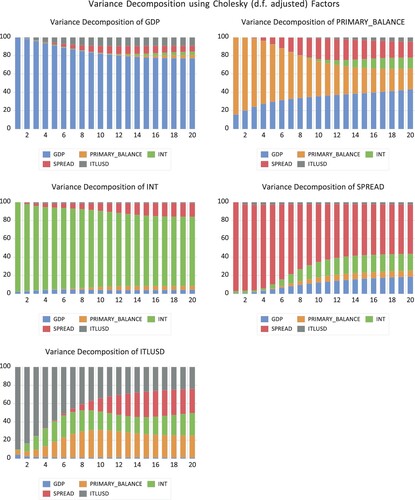
Figure 8. Variance decomposition using Cholesky factors of Model 2 (1980–98).
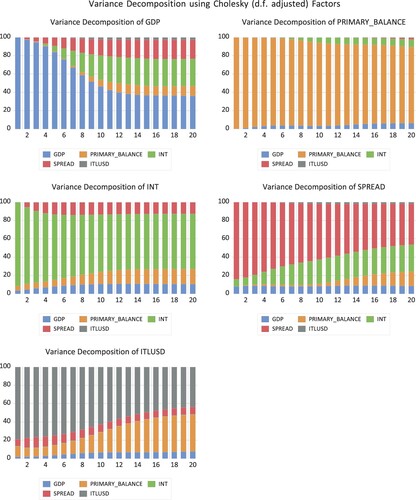
During the pre-euro period, growth was only marginally affected by the exchange rate (negative relationship) and the spread. However, more recently, the exchange rate has not had an impact, while the interest rate (positive relationship) and spread (negative relationship) have had an increasing and then steady impact after 10 quarters, but less so on the primary balance.
Pre-euro, the primary balance was increasingly affected by growth over time (positive relationship). After 10 quarters, the spread also had an impact (positive relationship). After the introduction of the euro, the primary balance was not influenced significantly by any variable. In both periods, the spread was affected by the level of interest rates (negative relationship), more so post-euro. Growth has had a moderate effect (negative relationship), but this was higher in the pre-euro period. The primary balance shows some influence only after 10 quarters, and with a higher impact since the 2000s (negative relationship). Pre-euro, the exchange rate seems to have been affected by interest rates (positive relationship), then with a lag of 2 years by the primary deficit (positive relationship), and by the spread after 2.5 years (positive relationship). In the more recent period, the exchange rate has been mostly affected only by the primary balance, which becomes increasingly important after 6 quarters (positive relationship), very marginally by growth and spread. As expected, the interest rates are positively related to the primary deficit and growth for both periods and are also affected positively by the spread, but more significantly pre-euro.
The confidence intervals of the impulse response function of Model 2 (see Appendix) provide robust results for the responses of the primary revenues to GDP and of the spread to GDP; they reduce to only eight quarters for the responses of the GDP to the exchange rate and the spread; lastly, results are less robust for the response of the spread to GDP and the exchange rate to GDP.
4.2.2. Components of the Fiscal Deficit
A second stream of mainstream studies relies on the crowding-out effect and the expansionary effects of fiscal policy on aggregate demand in the short-run. In the long-run, however, fiscal expansion is believed to reduce national savings and growth: here, the economy is assumed to behave in a Keynesian way in the short-run only in the presence of idle productive capacity; thus, if the government reduces taxes, resorting to debt financing and leaving its spending levels unchanged, the private sector's disposable income and spending increase. Since prices and wages are assumed to be sticky, a higher level of aggregate demand raises national income by using the idle productive capacity. Nevertheless, the composition of the fiscal expansion should also matter, since increases in government spending are considered to be more effective than tax reductions, particularly if the former can increase the productivity of labour and/or capital. In the long-run, however, market rigidities are considered less binding, and an increase in public debt is believed to reduce investment through a decrease in national savings. A shrinking investment, in turn, affects the capital stock and reduces growth. Pioneered by a controversial work by Alesina and Ardagna (Citation2010), a stream of empirical works on the effect of the composition of the fiscal package on economic growth supports the idea that fiscal contractions might have expansionary effects.
breaks down the primary budget into its components — spending and revenues — as per the composition of the fiscal package in . The figure shows that since 1980, fiscal revenues increased steadily at a rate greater than the increase in spending, leading to an improvement in the budget balance until 1994; after this, revenues declined while spending remained constant until 2008. After an increase in spending because of the 2008–2009 financial crisis, both revenues and spending grew, maintaining a roughly constant balanced budget.
Figure 9 .#Primary revenues and spending of the Italian government as a share of GDP (1980–2018). Source: ISTAT (Citation2019).
We considered the effects of changes in spending and revenues on growth separately: the results of Model 3, a multi-dimensional VAR, are shown in and for the two periods.
Figure 10. Variance decomposition using Cholesky factors of Model 3 (1980–98).
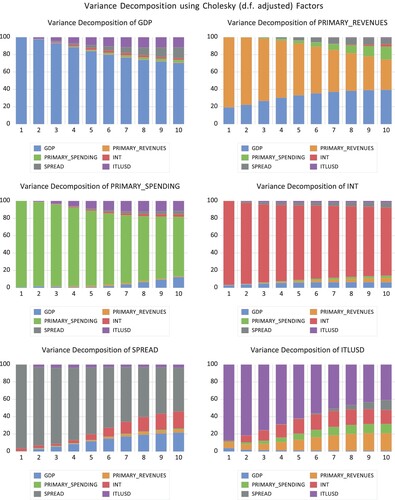
Figure 11. Variance decomposition using Cholesky factors of Model 3 (1999–2018).
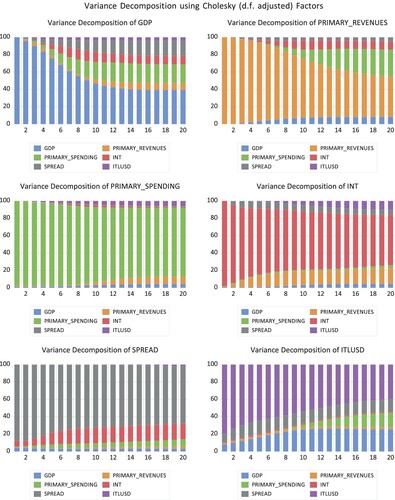
During the pre-euro period, both revenues and spending had a similar impact on growth. However, since the 2000s, fiscal spending has had a larger impact on growth.
Pre-euro, primary revenues were linked to growth. Post-euro, however, revenues were positively linked to primary spending after 10 quarters, underlining a feedback mechanism. We notice that the exchange rate was more affected by revenues pre-euro, while it is more affected by spending post-euro. The spread is influenced more by primary spending post-euro, with no difference pre-euro.
The confidence intervals of the impulse response function of Model 3 (see Appendix) provide robust results for the responses of the primary revenues and expenses to GDP; they reduce to only eight quarters for the responses of the exchange rate to primary revenues and expenses; lastly, results are less robust for the response of the spread to changes in the primary breakdown.
5. Conclusions
On the eve of the COVID-19 recovery, this article has proposed an analysis inspired by the lessons of Sylos Labini (Citation2003[Citation2009]), and resumed by Pasinetti (Citation1998), of debt as a fundamental variable of the Italian economy. The relationships between public debt and growth, private debt, deficit, and interest rates are analysed here with a multivariate analysis pre- and post-euro to investigate the Italian stagnation and the inadequacy of an economic response based on post-recovery austerity.
During the last three decades, to maintain a balanced budget, only once, after the 2007–2008 crisis, did the Italian economy experience a relevant countercyclical movement with an increase in output following an increase in the fiscal deficit. Our results show that the primary deficit is affected by growth pre-euro, and by no variables after the introduction of the euro. Bond vigilantes have an impact: the increase in the primary deficit has led to a spread increase, but mostly pre-euro. However, the real interest rate and the spread have had an impact on growth mainly since the 2000s. By breaking down the primary balance, we find that both revenues and spending had a similar impact on growth pre-euro, whereas primary spending has had a higher impact on growth since the start of the 21st century.
By conceptualising the role of public debt in financing economic activities as a way to transfer revenues and spending over time, a reduction in public debt therefore has to be compensated for by an increase in private debt to ensure a null effect on aggregate demand, given no change in the external position. Consequently, a high debt-to-GDP ratio reveals a disequilibrium between public and private sectors in terms of financing. One of the main lessons from Sylos Labini is that, if this is the reason behind austerity, then rather than austerity, alternative measures supporting the development of private finance would have been a more effective and less damaging solution in terms of growth. Additionally, private and public borrowings have always moved symmetrically, but less so recently: in 2008–2015, the increase in public borrowing did not follow the decline in private borrowing, contributing negatively to aggregate demand. After Draghi's intervention in the euro, since 2015, it was external borrowing that aided Italy's recovery, but which did not contribute to internal growth. Even if resorting to external sources is the chosen channel for financing, this could be compensated for with growth-supporting measures, in particular, according to Sylos Labini, the creation of new enterprises.
The crucial contributions of Sylos Labini, even more relevant today with post-COVID-19 reconstruction, is his warning against the vicious cycle of low investment and low growth. As discussed in Section Two, his view about economic development and the relation between this and civil development and his theory of accumulation sketched in his function of productivity are echoed in the current debate about the PNRR: the concerns regard the lack of an appropriate sectoral analysis, the fragmentation of the plan, the insufficient investments in research that would condemn Italy to a vicious cycle of low wages and limited job opportunities while the expansionary policy could impact the trade balance because of the need to import goods related to high-tech and the ecologic transition.
As a result, not only there is the concern that fiscal and monetary stimulus measures might be used to finance a policy of ‘beggar thy neighbour’, but also, if limited to mere liquidity provision, might exacerbate inequality that, in line with the central theme of Sylos Labini, acts as a trigger not only for weakening demand, but also for an increase in financial speculations.
Acknowledgement
The empirical part of this article is published in Moneta e Credito, Dec. 2020, Vol. 73 Issue 292, p355–384. 30pp. We gratefully acknowledge helpful comments by two anonymous referees. All remaining mistakes are the authors’.
Disclosure Statement
No potential conflict of interest was reported by the author(s).
Notes
1 European Next-Generation EU, the post covid-19 European recovery plan which is the temporary instrument designed to boost the recovery with a total €1.8 trillion (2018 prices).
2 The NRRP is the official policy document presented to the European Commission to access up to 25 per cent of the European available funds (since Italy has been the country worst affected by the current crisis).
3 There is a substantial difference between these investments (which are expansive and imply a dimensional effect) and the Ricardo effect which is related to efficiency, and saving in terms of labour cost.
4 These include education, unemployment rate, inequality in the distribution of income, the infant mortality rate, life expectancy, but also criteria that are more difficult to measure including freedom of press and civil rights.
5 For a detailed description of the RNNP see Maranzano, Noera, and Romano (Citation2021).
6 Reinhart and Rogoff (Citation2010) achieved considerable media resonance in Europe (Schauble Citation2010) and the United States (Gigot Citation2009): the argument maintains that if the budget deficit and debt-to-GDP ratio increase, surpassing a critical threshold, investors will doubt the country's ability to meet its debt obligations and will react by reducing their exposure, pushing up the interest rate on government bonds, endangering debt sustainability, and halting growth. Within a heterodox tradition of debt sustainability (for a review, see, for example, Roubini Citation2001; D’Ippoliti and Roncaglia Citation2011), Sylos Labini was very critical of mainstream economics at the time of the debate on joining the euro and after the 2007–2008 crisis.
7 This is the Central Bank refinancing base rate. Data are from the Bank of Italy and the European Central Bank, deflated by the consumer price index.
8 For the calculation of the bilateral lira–USD exchange rate, we used the lira–euro conversion rate after January 1999. The results were very similar and available upon request if we adopted the Real Effective Exchange Rate (REER). However, the REER presented higher volatility during the collapse of the European Exchange Rate Mechanism in 1992/3.
9 The spread here is taken as the difference of the 10-year government bonds between Italy and Germany.
References
- Alesina, A. F., and S. Ardagna. 2010. ‘Large Changes in Fiscal Policy: Taxes versus Spending.’ Tax Policy and the Economy 24: 35–68.
- Arestis, P., and M. Sawyer. 2014. ‘On the Sustainability of Budget Deficit and Public Debts with Reference to the UK.’ In Fiscal and Debt Policies for the Future, edited by P. Arestis, and M. Sawyer, 38–75. London: Palgrave Macmillan.
- Associazione Paolo Sylos Labini. 2021. https://www.syloslabini.info/online/12282-2/.
- Bank of Italy. 2016. Historical Time Series of Italian National Accounts 1861–2011. https://www.bancaditalia.it/pubblicazioni/quaderni-storia/2011-0018/index.html?com.dotmarketing.htmlpage.language=1.
- Blanchard, O. J., and R. Perotti. 2002. ‘An Empirical Characterization of the Dynamic Effects of Changes in Government Spending and Taxes on Output.’ Quarterly Journal of Economics 117 (4): 1329–1368.
- Bloomberg, L. P. 2021. Italian bond auctions data.
- Barbosa-Filho, N., C. Rada, L. Taylor, and L. Zamparelli. 2008. ‘Cycles and Trends in U.S. Net Borrowing Flows.’ Journal of Post Keynesian Economics 30 (4): 623–648.
- Barro, R. J. 2009. ‘Government Spending Is No Free Lunch.’ The Wall Street Journal, 22 January, New York. http://online.wsj.com/article/SB123258618204604599.html.
- Campbell, J. Y., A. W. Lo, and A. C. MacKinlay. 1996. The Econometrics of Financial Markets. Princeton: Princeton University Press.
- Canelli, R., G. Fontana, R. Realfonzo, and M. Veronese Passarella. 2021. ‘Are EU Policies Effective to Tackle the Covid-19 Crisis? The Case of Italy.’ Review of Political Economy. doi:10.1080/09538259.2021.1876477.
- Corsi, M. 2007. ‘Thinking of Sylos Labini (or Sylos Labini’s Thinking).’ Review of Political Economy 19 (4): 555–562. doi:10.1080/09538250701622451.
- Corsi, M., and G. Guarini. 2007. ‘La fonction de productivité de Sylos Labini: Aspects théoriques et empiriques.’ Revue D’ Economie Industrielle. doi:10.4000/rei.1603.
- Corsi, M., and G. Guarini. 2010. ‘Sviluppo economico e sviluppo civile secondo l’approccio di Paolo Sylos Labini.’ il Ponte, January.
- D’Ippoliti, C., and A. Roncaglia. 2011. ‘Unacrisi nella crisi.’ Moneta e Credito 64 (255): 189–227.
- Domar, E. D. 1944. ‘The “Burden of Debt” and the National Income.’ American Economic Review 34 (4): 798–827.
- European Commission. 2021. ‘Recovery Plan for Europe.’ https://ec.europa.eu/info/strategy/recovery-plan-europe_en.
- Fleming, S., M. Johnson, D. Dombey, and I. Mount. 2020. ‘EU Rescue Package: Borrowing to Prevent a North-South Split.’ Financial Times, July 24, London. https://www.ft.com/content/1fd5785b-5f6f-4175-bae4-214b43a55804.
- Fuà, G., and P. Sylos Labini. 1963. Idee per la programmazione economica. Bari: Laterza.
- Ghiglione, D., and V. Romei. 2021. ‘Italian Returnees Seize on Pandemic to Stop Mezzogiorno Brain Drain.’ Financial Times, April 5, London. https://www.ft.com/content/2c8f6ff9-ee12-4f0c-a7b2-fe2ac4469c11.
- Godley, W., and F. Cripps. 1993. Macroeconomics. New York: Oxford University Press.
- Gigot, P. 2009. ‘The Bond Vigilantes: The Disciplinarians of U.S. Policy Makers Return.’ The Wall Street Journal, May 29, New York. http://online.wsj.com/article/SB124347148949660783.html.
- Grasa, A. 1989. Econometric Model Selection: A New Approach. Dordrecht: Kluwer Academic Publishers.
- Gualtieri, R. 2020. ‘Audizione sulle individuazione delle priorità nell’utlizzo del Recovery Fund.’ September 15, Ministero dell’Economia e Finanza, Roma.
- Guarini, G. 2007. ‘La funzione di produttività di Sylos Labini tra mercato e territorio: un’analisi econometrica per le regioni italiane.’ Moneta e Credito 60 (238): 173–198.
- Gulyas, V., and P. Skolimowski. 2021. ‘Bond Vigilantes Swarm European Economies Where Inflation Is Hot.’ May 15, Bloomberg. https://www.bloomberg.com/news/articles/2021-05-16/bond-vigilantes-swarm-european-economies-where-inflation-is-hot.
- IMF. 2019. International Financial Statistics. Washington, DC: International Monetary Fund.
- ISTAT. 2019. Serie Storiche Table 12.16: Main Aggregates by Institutional Sector, Italian National Institute of Statistics. seriestoriche.istat.it/fileadmin/documenti/Table_12.16_ESA95.xls.
- Lucchese, M., and M. Pianta. 2021. ‘Il Piano Nazionale di Ripresa e Resilienza in una prospettiva di politica industriale.’ Moneta e Credito 74 (295): 177–190.
- Maranzano, P., M. Noera, and R. Romano. 2021. ‘The European Industrial Challenge and the Italian NRRP.’ PSL Quarterly Review 74 (298): 207–218.
- Massera, M., A. Pirastu, and L. Ventro. 2012. ‘Il sistema di protezione al lavoro in Italia come la crisi ha cambiato l’intervento di tutela, analisi della uil dal 2006 al 2011.’ UIL. http://www.uil.it/documents/STUDIO_COMPLETO_AMMORTIZZATORI.pdf.
- Migliaccio, A., and F. Rotondi. 2021. ‘Draghi’s Full-Throttle Italy Budget Shows No Return to EU Limits.’ Bloomberg. September 29. https://www.bloomberg.com/news/articles/2021-09-29/draghi-s-full-throttle-italy-budget-shows-no-return-to-eu-limits#:~:text=Italian%20Prime%20Minister%20Mario%20Draghi,ceiling%20for%20the%20foreseeable%20future.
- OECD Statistics Directorate. 2016. ‘Statistical Insights: Government Assets Matter Too, Not Just Debt.’ Accessed 14 May 2018. http://oecdinsights.org/2016/01/28/statistical-insights-government-assets-matter-too-not-just-debt/.
- Palma, D. 2020. ‘Aspetti di lungo periodo della crisi economica Italiana attraverso le lenti di Paolo Sylos Labini (Long-Term Aspects of the Italian Economic Crisis Through the Lenses of Paolo Sylos Labini).’ Moneta e Credito 73 (292): 355–384.
- Papadimitriou, D. B., F. Zezza, and G. Zezza. 2020. ‘When Will Italy Recover?.’ Economics Strategic Analysis Archive, Annandale-on-Hudson, NY: Levy Economics Institute, October.
- Pasinetti, L. 1998. ‘The Myth (or Folly) of the 3% Deficit/GDP Maastricht “Parameter”.’ Cambridge Journal of Economics 22: 103–116.
- Pastore, F. 2020. ‘Italy between a Disaster and a New Development Strategy.’ IZA Policy Paper 167. Institute of Labor Economics (IZA).
- Quadrio-Curzio, A. 2011. ‘Economie in crisi: eurolandia dalla resistenza alla ricostruzione.’ Moneta e Credito 64 (254): 105–114.
- Reinhart, C. M., and K. S. Rogoff. 2010. ‘Growth in a Time of Debt.’ American Economic Review 100 (2): 573–578.
- Roncaglia, A. 1991. ‘The Sraffian Schools.’ Review of Political Economy 3 (2): 187–219. doi:10.1080/09538259100000042.
- Roncaglia, A. 1994. ‘Josef Steindl’s Relations to Italian Economics.’ Review of Political Economy 6 (4): 450–458. doi:10.1080/09538259400000023.
- Roubini, N. 2001. ‘Debt Sustainability: How to Assess Whether a Country Is Insolvent.’ Stern Business School, New York. http://people.stern.nyu.edu/nroubini/papers/debtsustainability.pdf.
- Schauble, W. 2010. ‘Maligned Germany Is Right to Cut Spending.’ Financial Times. June 24. http://www.ft.com/cms/s/0/216daeba-7f0c-11df-84a3-00144feabdc0.html.
- Sims, C.A., J.H. Stock, and M.W. Watson 1990. ‘Inference in Linear Time Series Models with Some Unit Roots.’ Econometrica 58 (1): 113–144.
- Sylos Labini, P. 1962. ‘Interrogatorio del professor Sylos Labini.’ Moneta e Credito. 68 (270): 219–269.
- Sylos Labini, P. 1972[1977]. Sindacati, inflazione e produttività, nuova edizione riveduta e ampliata. Roma-Bari: Laterza.
- Sylos Labini, P. 1984a. The Forces of Economic Growth and Decline. Cambridge, MA: MIT Press.
- Sylos Labini, P. 1984b. ‘L’impresa pubblica nella politica di redistribuzione e sviluppo.’ Economia Pubblica 7-8: 403–407.
- Sylos Labini, P. 1989. Nuove tecnologie e disoccupazione. Roma-Bari: Laterza.
- Sylos Labini, P. 1993. Progresso tecnico e sviluppo ciclico. Roma-Bari: Laterza.
- Sylos Labini, P. 1995. La crisi italiana. Roma-Bari: Laterza.
- Sylos Labini, P. 2003[2009]. ‘Le prospettive dell’economia mondiale.’ Moneta e Credito 62 (245–248): 61–89.
- Sylos Labini, P. 2004. Torniamo ai classici. Roma-Bari: Laterza.
- Sylos Labini, P. 2006. Ahi serva Italia. Un appello ai miei concittadini. Roma-Bari: Laterza.
- Taylor, L., C. R. Proano, L. de Carvalho, and N. Barbosa. 2012. ‘Fiscal Deficits, Economic Growth and Government Debt in the USA.’ Cambridge Journal of Economics 36: 189–204.
- Variato, A. M., P. Maranzano, and R. Romano. 2020. ‘Rotta Next Generation: tra narrazioni ed evidenza empirica, le sfide del possibile orizzonte della politica economica italiana.’ Moneta e Credito 37 (291). doi:10.13133/2037-3651_73.291_2.
- Visco, I. 2021. Annual Report on 2020. The Governor’s Conclusing Remarks, May 31, Rome. https://www.bancaditalia.it/pubblicazioni/interventi-governatore/integov2021/en-cf_2020.pdf?language_id=1.
- Wigglesworth, R., J. Rennison, E. Plattand, and C. Smith. 2021. ‘Return of the Bond Vigilantes: Will Inflation Fears Spoil the Post-Pandemic Party?’ Financial Times, February 26, London. https://www.ft.com/content/542d6127-11e7-47ff-86cb-dd7bd974cda3.
Appendix
Table A. Johansen Test Model 1.
Table B. VAR Granger causality/block exogeneity Wald tests Model 1.
Table C. Vector error correction estimates Model 1.
Table D. Selection criteria Model 2.
Figure A. Model 2 Impulse responses to innovations of one standard deviation (1980–98).
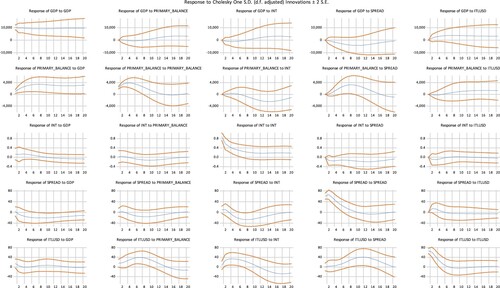
Figure B. Model 2 Impulse responses to innovations of one standard deviation (1999–2018).
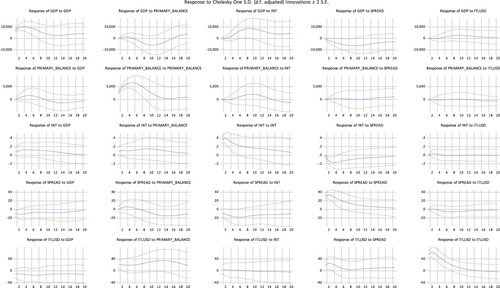
Table E. Selection criteria Model 3.
Figure C. Model 3 Impulse responses to innovations of one standard deviation (1980–98).
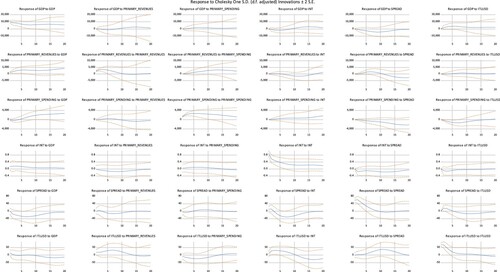
Figure D. Model 3 Impulse responses to innovations of one standard deviation (1999–2018).