ABSTRACT
We present evidence on the Black–White Racial Wealth Gap in South Africa and compare it to the well-known patterns of the same gap in the United States. We find that the patterns in the overall racial wealth gap are similar between the two countries. In South Africa, the typical Black household owns 5 per cent of the wealth held by the typical White household. In the US, the typical Black household owns 6 per cent of the wealth held by the typical White household. In both countries, a racial wealth gap exists at different levels of education and income. The fact that the racial wealth gap in the US is similar to that of a country that recently emerged from apartheid is a sobering indictment. Conversely, the US presents a grim outlook of the future course of the racial wealth gap in South Africa, especially in the absence of economic redress. The similarities in the evidence between the two countries points to the potential utility of using the Identity Group Stratification framework for understanding racial wealth dynamics in South Africa, an approach that is absent in the literature.
1. Introduction and Motivation
There is a long tradition in the economics profession studying the racial wealth gap in the United States. The fact that a racial wealth gap exists in the US is not under contention. What has been debated are the reasons for the existence and persistence of such a gap. Mainstream economics attributes the gap to ‘deficit behavior’ on the part of Blacks or to irrationality on the part of discriminating Whites (Chelwa, Hamilton, and Stewart Citation2022). A second set of economists have marshaled empirical evidence undermining these explanations. For example, Hamilton et al. (Citation2015) have shown that wealth disparities by race increase with educational attainment thus contradicting the orthodox explanation that human capital deficiencies explain the racial wealth gap in the US. A striking statistic is that White households, where the head is a high school drop-out, have higher net worth than Black households where the head has a college degree (Hamilton et al. Citation2015). In addition, the existence of discrimination against Black workers in markets considered ‘competitive’ is evidence against the irrationality arguments advanced by mainstream economics (Agesa and Hamilton Citation2004).
A framework underpinning the arguments of economists undermining the mainstream approach has been referred to as Stratification Economics, or more precisely Identity-Group Stratification Economics (Chelwa, Hamilton, and Stewart Citation2022; Chelwa, Hamilton, and Green Citation2023). The framework considers intergroup inequalities as the result of a process by which privileged groups maintain relative status. That is, inter-group inequalities are the result of competitive behavior on the part of members of individual groups ‘to attain and maintain relative positions in a social hierarchy’ (Darity, Hamilton, and Stewart Citation2015, 3). In this interpretation, the link between race and economic outcomes is unlikely to disappear in the absence of public interventions (Chelwa, Hamilton, and Stewart Citation2022; Chelwa, Hamilton, and Green Citation2023).
On the other hand, and given the well-documented history of state-sanctioned violence and discrimination during the apartheid era, the literature on the racial wealth gap in South Africa is surprisingly small. What is without dispute is that South Africa has one of the highest levels of income inequality in the world as measured by, for example, the well-known Gini coefficient (Wittenberg Citation2017). The racial dimensions of especially wealth inequality in the country are less well-known. Even though inequality is an active area of research by South African and outside researchers, much of that research has focused on wage and income differences. Additionally, the work on wage and income inequality has often treated race in rather cursory terms and not as one of the defining features of South African society given its history. Further, much of the analysis, and the implications drawn from this research, share similarities with the mainstream approach to racial disparities in the US discussed above. That is, it considers disparities as mainly arising from ‘deficit behavior’ on the part of the subaltern group.
A new research center, the Southern Center for Inequality Studies (SCIS) located at the University of the Witwatersrand in Johannesburg, has emphasized the need to anchor the debate on inequality in South Africa on wealth given its role in determining well-being. Unlike income, wealth has the capacity to generate dividends, rent and other forms of income itself. Wealth is less volatile than income. Wealth enables families and individuals to make investments in homes, education, businesses and overall well-being. In addition, wealth provides resilience over a lifetime—it provides the economic security to take risks and shield against financial losses. We often think of wealth as an outcome, but its true essence is functional (Hamilton Citation2020). Wealthier families are better positioned to finance elite education, access capital to start a business, reside in higher amenity neighborhoods, exert political influence; purchase better counsel if confronted with an expensive legal system, leave a bequest, and withstand financial hardship resulting from any number of emergencies, including as poignantly demonstrated with the Covid pandemic (Hamilton et al. Citation2021).
The research conducted by the Southern Center for Inequality Studies (SCIS), laudable as it is, does not present a disaggregated picture of racial wealth inequality in South Africa. For example, Chatterjee, Czajka, and Gethin (Citation2020) have assembled impressive data on wealth inequality in South Africa to date. They find that despite formal apartheid ending in the early 1990s, unparalleled levels of wealth concentration have persisted: the top 10 per cent own 86 per cent of aggregate wealth, with the top 0.01 per cent of the distribution (or only 3,500 individuals) owning 15 per cent of household net worth, which is more than what the bottom 90 per cent own collectively. However, Chaterjee et al.’s (Citation2020) analysis does not present any breakdown of wealth inequality by race.
Recent work by economist Anna Orthofer has added to the literature on wealth inequality in South Africa in important ways. Using a combination of survey data and tax records, Orthofer’s work confirms earlier work on South Africa’s high levels of wealth inequality. For example, Orthofer finds that the top 1 per cent owns between 60 and 90 per cent of all wealth while the top 10 per cent owns 90–95 per cent of all wealth (Orthofer Citation2017). More importantly, and relevant for our purposes, Orthofer investigates the racial dimensions of wealth inequality in South Africa. Using density plots, Orthofer finds that the degree of racial wealth inequality between Black and White people in South Africa remains high which she attributes to ‘the legacy of the system of apartheid which denied Black citizens the access to most forms of capital until 1994’ (Orthofer Citation2017, 96). Further, Orthofer shows that the greatest degree of within group inequality is found within the Black population group in South Africa. As important as Orthofer’s work is, and given that she relies on density plots, she does not present estimates of the racial wealth gap. In other words, she does not present the extent of the gap between Black wealth, estimated at the median, and White wealth, also estimated at the median. Doing so is important if we are to obtain an understanding of the degree of the disparity in well-being between the typical Black household and the typical White household in South Africa. This is a shortcoming that the present paper aims to correct. There has been a relatively longer intellectual tradition in sociology dealing with the racial dimensions of inequality in South Africa. Notable contributors have been Jeremy Seekings and Nicoli Nattrass of the University of Cape Town. Seekings and Nattrass (Citation2008) summarized this body of work in their important study Class, Race, and Inequality in South Africa (2005). The authors make the argument that whereas inequality was racial in its manifestations in the apartheid years, in the post-apartheid period inequality has taken on a more class dimension. It is worth noting that Seekings and Nattrass (Citation2008) arrived at this conclusion using the limited data that was available at the time of their writing.
In contrast, in this paper we add to the literature and take it for granted that wealth inequality in South Africa takes on a racial dimension precisely because of the country’s well documented history of state-sanctioned discrimination and dispossession (Pellicer and Ranchhod Citation2023). As we have argued elsewhere, beyond class, a defining characteristic of most societies is identity group stratification, of which race is extremely relevant (Chelwa, Hamilton, and Green Citation2023). Therefore, we report data on measures of the Black–White racial wealth gap in South Africa using the 2017 National Income Dynamics Survey (NIDS). In addition to presenting data on the racial wealth gap, we disaggregate the gap by educational and income status. That is, we bring data to bear on the hypothesis, often advanced by mainstream economics, that education (often utilized to proxy human capital) and, in turn, income (e.g., class) can explain the racial wealth gap.
Our findings on the Racial wealth gap are compared with those from the US using the 2018 edition of the Survey of Income and Program Participation (SIPP). The comparison is conducted on the basis that South Africa and the US have at various stages experienced state-sanctioned discrimination, extraction and extrapolation against subaltern groups. Further, and given the efficacy of the identity group stratification framework for understanding racial wealth inequality in the US, the comparison serves as a basis for judging the framework’s utility for understanding racial wealth dynamics in South Africa.
The rest of the paper proceeds as follows. Section Two provides a brief conceptual discussion of Identity Group Stratification as a framework for understanding group-based disparities. Section Three presents the data used in the paper and Section Four presents the results. Section Five discusses and concludes the paper.
2. Identity Group Stratification as a Conceptual Framework
In many parts of the world, inequalities around identity groups abound. One of the world’s most defining disparities is inequality related to gender. Several measures of gender inequality have shown that significant disparities exist in important social and economic outcomes between men and women (Stoet and Geary Citation2019). In India, many scholars have documented the existence of inequalities related to the system of scheduled castes with groups designated as lower castes having lower social and economic outcomes when compared with privileged castes (Ghosh Citation2023). In the US, which has a relatively longer tradition of collecting detailed social and economic data on outcomes related to social identities, researchers have documented large disparities in, but not limited to, the economics sphere. A most profound and poignant disparity in the US is the racial wealth gap tracing its origins to the time that Black people were chattel property owned by a White slave plantation class (Chelwa, Hamilton, and Green Citation2023; Hamilton and Logan Citation2019). As of 2019, the latest year for which we have nationally representative data, the typical Black household had 12 cents for every dollar of wealth held by the typical White household (Bhutta et al. Citation2020). Other wealth surveys, looking at much more localized data have found racial wealth gaps that are bigger than the national median (Chelwa, Hamilton, and Green Citation2023).
A market in the US where disparities have been closely studied is the labor market where researchers have shown the existence of racial disparities with respect to wages and unemployment (Chelwa, Hamilton, and Green Citation2023). More importantly, this research on the US has demonstrated that racial disparities with respect to labor market outcomes widen with higher educational attainment and this pattern is especially pronounced during recessions (Hamilton Citation2020; Hamilton et al. Citation2015; Hamilton et al. Citation2021).
The existence of the disparities discussed above are difficult to reconcile with the standard neoclassical economic framework, which attributes disparities to the presence of differences in human capital attainment (Hamilton et al. Citation2015). Neoclassical economics further argues that if economic disparities exist in the absence of differences in human capital, then ‘the market’ should, through arbitrage, discipline such bigoted behavior (Agesa and Hamilton Citation2004; Darity and Mason Citation1998). However, the existence of a plethora of empirical evidence at odds with the predictions of neoclassical economics has spawned a different intellectual tradition emphasizing the role that identity group stratification plays in generating and sustaining racial disparities (Chelwa, Hamilton, and Stewart Citation2022; Chelwa, Hamilton, and Green Citation2023). In this approach, group-based disparities exist and are sustained because identity itself carries material and non-material returns (Hamilton Citation2020; (Chelwa, Hamilton, and Stewart Citation2022; Chelwa, Hamilton, and Green Citation2023). In other words, there are non-trivial returns to being a member of the in-group or dominant group (White in the US context) vis-à-vis the out group/subaltern group (Black in the US context) and these returns incentivize the weaponization of society’s political, economic and social structures in the maintenance of such hierarchy.
The identity group stratification approach to understanding inequality shares some ground with Thomas Piketty’s important contributions to the understanding of the emergence and sustenance of inequality. In his magisterial Capital in the 21st Century, Piketty introduces the inequality r > g as a tool for understanding how wealth inequality can grow over time (Piketty Citation2014). In this set-up, r stands for the rate of return to wealth while g is the average growth rate of the economy (or the average rate of growth in incomes). In this framework, initial wealth inequality is sustained and grows over time because the rate of return to wealth is greater than the rate of return to incomes, a characteristic feature of capitalist economies (Pressman Citation2015). In other words, however they may try, those who start out with no wealth are unlikely to catch up to those who start out with some wealth (via inheritance), barring policy interventions on the part of the authorities.Footnote1 Further, Piketty (Citation2014) does argue that persistent wealth inequality itself is likely to influence institutions (fiscal, democratic, etc.) in the direction of ensuring the greatest difference between r and g. That is, ensuring that wealth inequality persists and grows.
Much like Piketty (Citation2014), Stratification economics considers initial wealth inequality important for explaining future inequality. However, stratification economics stresses that initial wealth inequality itself is often a product of intentional and systematic dispossession of the subaltern group by the privileged group as the examples of slavery in the US or apartheid in South Africa illustrate. Second, stratification economics agrees with Piketty that initial wealth inequality can be sustained through the shaping of societal institutions away from equality. However, stratification economics stresses that this ‘institutional capture’ becomes even more important in contexts where, for example, inequality follows a racialized pattern.
Researchers working in the tradition of identity group stratification have proposed inclusive economic rights as a policy framework that can neuter the link between identity and outcomes. Inclusive Economic Rights are anchored on the idea of the public provision of a baseline of goods and services that enable people to live lives that are fully determined with authentic agency (Chelwa, Hamilton, and Stewart Citation2022).
3. Data
The main datasets used to estimate and compare the Black–White racial wealth gaps in South Africa and the US are the National Income Dynamics Study (NIDS) and the Survey of Income and Program Participation (SIPP), respectively.Footnote2 The NIDS is South Africa’s first nationally representative household panel survey whose main aim is to track the well-being of South Africans over time (Brophy et al. Citation2018). The survey provides information on the dynamics of labor market participation; dynamics of household incomes, expenditures and asset endowments; as well as social, educational and intergenerational dynamics among many other aspects of wellbeing. The first wave of the NIDS panel started in 2008 with a sample of over 28,000 individuals in 7,300 households (Brophy et al. Citation2018). The NIDS samples household members and those they live with, and these are tracked and interviewed roughly every two years. To date, five (5) waves of the NIDS have been conducted.
Wealth data in the NIDS is only available in Wave 2, Wave 4 and Wave 5 which were conducted in 2010, 2014-2015, and 2017 respectively. Our variable of interest, wealth (also referred to as net worth), is defined as the value of household assets minus liabilities (OECD Citation2013; Piketty and Saez Citation2014), and following the established literature on measurement and analysis of wealth, the household is the preferred unit of analysis (Gansonré et al. Citation2023; OECD Citation2013; Saez and Zucman Citation2020) Given the high levels of attrition especially among the wealthier households in the NIDS (Branson Citation2019), questions have been raised about the validity and representativeness of the wealth data in the NIDS, especially in the subsequent waves of the panel. Much work has therefore been done to understand the shortcomings and limitations of using the NIDS wealth data to study wealth inequality in South Africa. In a study focused on the quality of the wealth data in the NIDS Wave 2 dataset, the first wave to include a module on wealth, Daniels, Finn, and Musundwa (Citation2014) found that the cross-sectional weighted data were fit for use in terms of the univariate distributions of net worth, assets and liabilities. However, the study found that the population totals were likely underestimated due to the presence of missing wealth data in Phase 2 of Wave 2 that was not taken into account in the weights (Daniels, Finn, and Musundwa Citation2014). Based on the distributional validity of the NIDS Wave 2 data, various studies (such as Orthofer Citation2016; Mbewe and Woolard Citation2016; and von Fintel and Orthorfer Citation2020) have investigated various aspects of the distribution of wealth in South Africa.
The second round of wealth data (NIDS Wave 4) however showed that the survey severely under-estimated aggregate wealth when compared with national accounts estimates from the South African Reserve Bank (SARB) (Daniels and Augustine Citation2016). The huge discrepancy in wealth estimates between the survey and the national accounts was attributed to disproportionately high attrition among high-income households in the sample since the panel began, and this prompted an urgent call by authors to refresh the NIDS sample with an over-sampling of high-income households (Daniels and Augustine Citation2016). A topped-up sample was added to the core NIDS Wave 5 data to ensure better representation of the wealthy in the NIDS (Branson Citation2019). In their assessment of the NIDS Wave 5 wealth data, Daniels and Khan (Citation2019) show that the addition of higher net worth households results in higher mean total assets and debt values, implying that the wealth data is more reliable internally. Daniels and Khan (Citation2019) also demonstrate that the distribution of the household wealth in the survey is much closer to the distribution of the macroeconomic household balance sheet estimates of assets and liabilities provided by SARB, which implies that the topped-up sample also improved the external reliability of the wealth data. They conclude that the NIDS Wave 5 wealth module is fit for the purpose of estimating household wealth.
Given the above, this paper uses the NIDS Wave 5 data, the most recent and representative survey data of household wealth in South Africa. Various studies such as Chatterjee, Czajka, and Gethin (Citation2020), and Nanziri and Olckers (Citation2019) have used the wealth data in the NIDS Wave 5.
The NIDS contains detailed questions on household financial wealth, business equity, real estate equity, value of vehicles, total value of pension/retirement annuities, including the value of livestock. In addition, the survey contains a derived variable that measures household net worth. The variable is constructed as the difference between the total value of household assets and liabilities and has been adopted as the measure of household wealth in this paper (Daniels and Augustine Citation2016; Daniels and Khan Citation2019; Daniels, Finn, and Musundwa Citation2012).
For comparative purposes, the wealth data for the US comes from the 2018 SIPP survey (U.S. Census Bureau Citation2020). The data consists of sets of nationally representative panels since 1983 that provide comprehensive information about income and (public policy) program participation of individuals and households in the US. The survey collects data and measures changes in variables such as economic well-being, family dynamics, education, assets, health insurance, childcare, and food security. The 2018 SIPP follows the same set of individuals every four years. The data used in this paper is Wave 1 of the 2018 SIPP, whose data collection reference period is 2017 (just like the NIDS Wave 5 survey in South Africa). The SIPP contains data collected from individuals living in about 26,000 households with over samples of low-income Americans to ensure adequate coverage of program participation.
The SIPP dataset has a rich set of household wealth variables that reflect the profile of wealth in the United States. The main asset categories in the SIPP include retirement accounts such as the individual retirement account (IRA) and Keogh accounts; interest earning assets such as government securities and money market funds; income-generating assets such as stocks and rental property; and other assets such as motor vehicles and life insurance policies. The categories for liabilities include debts secured by assets such as mortgages, vehicles and business loans and unsecured debts such as credit card, student loans and medical bills. To ensure accurate and consistent measures of household wealth or net worth, the SIPP imputes (or recodes) estimates of household wealth.
4. Results
This section presents the distributions of household wealth by race in South Africa and the United States. The analysis uses the NIDS Wave 5 and SIPP 2018 datasets discussed in Section Three. The analysis focuses only on the comparisons between Black and White households in both countries.Footnote3 All the descriptive statistics are weighted and follow the wealth literature by reporting median wealth at the level of the household (means are reported in the Appendix). Further, wealth and income are reported in the results section in rands (for South African data) and dollars (for US data) given that our primary interest is on the magnitude of the racial wealth gap in both countries, or the magnitudes of the relative differences.
4.1. Overall Racial Wealth Gap in South Africa and the US
shows the distribution of median wealth between Black and White households in South Africa and the US. According to the left panel of , median wealth for White households in South Africa was R1,364,900 in 2017 while for Black households it was R70,000. This means that median Black household wealth in South Africa was 5.1 per cent of median White household wealth in 2017. This statistic implies that for every R1 in wealth held by the typical White household in South Africa, the typical Black household held 5 South African cents in wealth.
Figure 1. Median household wealth in South Africa and the United States. Source: NIDS Wave 5 (SALDRU Citation2018) and 2018 SIPP (U.S. Census Bureau Citation2018).
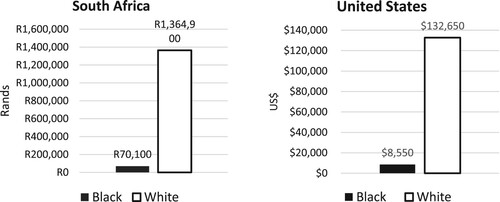
In the US, median White household wealth was $132,650 in 2017 while median Black household wealth was $8,550 (right panel in ). This means that median Black household wealth in the US was about 6.4 per cent of the median White household wealth in 2017. This implies that for every $1 of wealth held by the typical White household in the US, the typical Black household had only a little over 6 cents in wealth in 2017.Footnote4
As highlighted earlier, factors such as education and household income have been advanced in some of the literature as reasons behind the Black–White wealth gap in South Africa and the US. Below, we describe patterns in median household wealth by household educational attainment and household income.
4.2. Racial Wealth Gaps by Educational Attainment
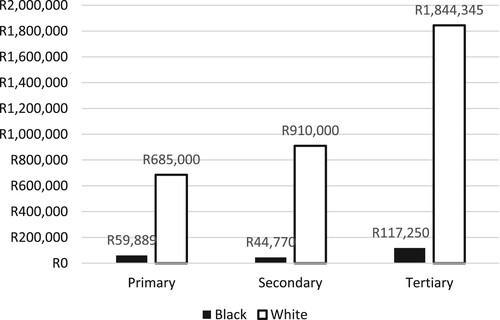
shows the distribution of median household wealth by education and race in South Africa. Household education attainment is measured using the household head’s highest level of education. Overall, a racial wealth gaps exists across the distribution of education attainment. For example, the median wealth of Black households with primary schooling is about 9 per cent of the median wealth of White households with primary schooling. For secondary and tertiary educated households, the wealth of Black households is only about 5 to 6 per cent of the wealth of the White households (respectively). This means that, ironically, the racial wealth gap increases with educational attainment in South Africa. Another striking fact from is that the median wealth of White households with up to primary schooling is greater than the median wealth of Black households with tertiary educational attainment (college graduates). Greater educational attainment for Black South Africans is valuable, but not enough to close the massive racial wealth gap in South Africa.
Figure 2. Median household wealth by education in South Africa. Source: NIDS Wave 5 (SALDRU Citation2018).
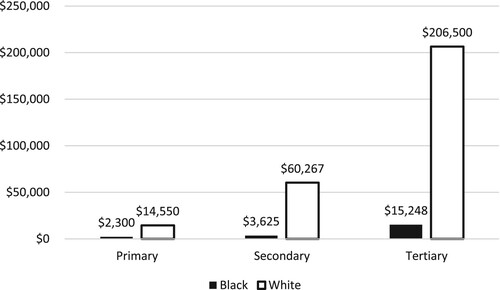
shows similar statistics for the US with respect to educational attainment. Like South Africa, educational attainment is measured on the basis of the highest level of education of the household head. shows that like South Africa, the US exhibits a racial wealth gap at every level of educational attainment. The median wealth of Black households with up to primary schooling in the US is about 16 per cent of the median wealth of similarly educated White households. For secondary (high school) and tertiary schooling (college or more), this measure of the racial wealth gap is 6 and 7 per cent respectively. This means that the racial wealth gap is greater for households with secondary schooling when compared with households with primary schooling. Further, shows that the median wealth of White households with primary schooling is bigger than the median wealth of Black households with secondary schooling. Moreover, the median wealth of White households with a secondary education is greater than that of Black households where the head completed tertiary education. In absolute terms, the magnitude of the Black–White wealth gap widens with every level of education.
Figure 3. Median household wealth by education in the United States. Source: 2018 SIPP (U.S. Census Bureau Citation2018).
4.3. Racial Wealth Gaps by Income Groups
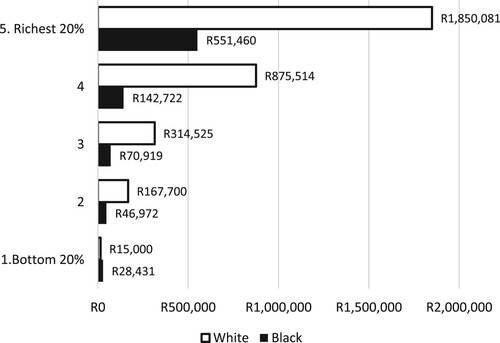
Lastly, we confront the possibility that income, a predominant work-based indicator of class, is key to explaining the racial wealth gap in both South Africa and the US. shows the distribution of the racial wealth gap by household income quintiles in South Africa. In general, White households have greater median wealth compared to Black households across the income distribution as shown in . A typical Black household in the top income group in South Africa has just below 30 per cent of the wealth of a typical White household.
Figure 4. Median wealth by income quintiles in South Africa. Source: NIDS Wave 5 (SALDRU Citation2018).
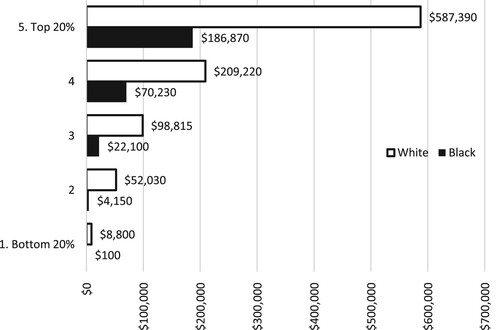
Turning to the United States, our findings on the distribution of the wealth gap by income groups is similar to that in South Africa. shows that the relative racial wealth gap is prevalent across the entire income distribution, with the typical Black household in the top household group in the United States having just below 32 per cent of the wealth of a typical White household.
Figure 5. Median wealth by income quintiles in the United States. Source: 2018 SIPP (U.S. Census Bureau Citation2018).
4.4. Racial Wealth Gaps by Age Cohorts
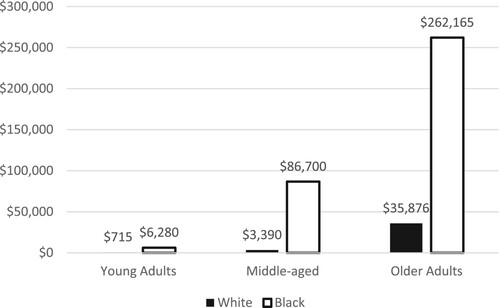
A potential criticism of some of the analysis presented above is that there are likely to be considerable age-cohort effects particularly in the case of South Africa given that the country only recently emerged from apartheid. In other words, racial wealth disparities are likely to fare better among younger cohorts when compared with older cohorts given that younger Black people now have access to opportunities that were denied to their parents due to apartheid. below confronts this possibility in the case of South Africa. The figure presents median wealth by race in three age cohorts: young adults (household head younger than 30), middle-aged (household head older than 30 but younger than 50) and Older Adults (household head older than 50).
Figure 6. Median Wealth by age-cohort and race in South Africa. Source: NIDS Wave 5 (SALDRU Citation2018).
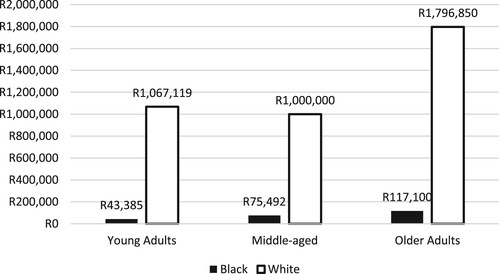
As can be seen in , there exists a racial wealth gap across age cohorts in South Africa, with the youngest cohort exhibiting the biggest wealth gap. Median wealth in young Black households is 4 per cent of young White households. For middle-aged and older households, median Black household wealth is respectively 8 and 7 per cent that of White households. In other words, younger Black households are not faring any better.
For completeness, presents median wealth by race and age cohort for the US (with age cohorts as defined above). The figure shows that, like South Africa, there exists a racial wealth gap across age cohorts in the US. The information contained in and is consistent with Piketty’s formulation where inherited wealth plays a bigger role in explaining wealth inequality dynamics across time. Gittleman and Wolff (Citation2004) showed the importance of inheritance in explaining racial wealth dynamics in the US. Figures A1 to A6 in the Appendix present results that take household size into account. The results in the Appendix show that the conclusions of our analysis are not driven by household size.
Figure 7. Median Wealth by age-cohort and race in the United States. Source: 2018 SIPP (U.S. Census Bureau Citation2018).

5. Discussion and Conclusion
This paper provides some measures of the magnitude of the racial wealth gap in South Africa. Our analysis reveals that the typical Black household had wealth holdings that were 5 per cent of the wealth held by the typical White household. In addition, our results show that the racial wealth gap increases with educational attainment in South Africa. That is, the racial wealth gap for households with tertiary education is considerably greater than the gap for those with lower levels of schooling. In addition, we provide evidence that the racial wealth gap increases by income in South Africa. Contrary to the claims of mainstream economics, the racial wealth gap is at its greatest for households in the top 20 per cent of income earners and smallest for households in the bottom 20 per cent. In other words, income differences alone do not explain the racial wealth gap in South Africa.
Interestingly, the racial wealth gap in South Africa is similar to the racial wealth gap in US. In the case of the US, our analysis reports that the typical Black household has wealth holdings that are 6 per cent that of the typical White household. Further, like the case in South Africa, the racial wealth gap cannot be explained by differences in educational attainment and household income. Additionally, the fact that the racial wealth gap exists across age cohorts speaks to the prominence of inherited wealth in explaining racial wealth dynamics as implied by Piketty (Citation2014) and as shown by Gittleman and Wolff (Citation2004) in the specific case of the US.
The results presented in this paper have interesting implications. First, the fact that South Africa and the US have similar profiles in terms of the racial wealth gap points to the persistence of such gaps in the absence of large-scale public interventions. The Black population in the US have been ‘free (i.e., emancipated from chattel slavery)’ for a much longer time, centuries, than their compatriots in South Africa, decades. And yet patterns of Black–White inequality look similar between the two countries. In other words, the racial wealth gap in the US is dastardly similar to that of a country that recently emerged out of apartheid. This is a sobering indictment on the part of the US. Conversely, there is international patterned evidence to suggest that the future of the racial wealth gap in South Africa is the US. That is to say, South Africa’s future racial wealth gap will not look any more different than it is today in the absence of large scale economic/capital-based/or reparations public interventions that can neuter the link between identity and outcomes (Chelwa, Hamilton, and Stewart Citation2022; Chelwa, Hamilton, and Green Citation2023; Hamilton and Zewde Citation2020).
Finally, the similar results for South Africa and the US point to the usefulness of the identity group stratification framework (discussed in Section Two) in understanding racial wealth dynamics in South Africa, something that has not been done in the literature. For example, the framework, in addition to the evidence presented in this paper, points to the limitations of emphasizing the role of education in alleviating the racial wealth disparities in South Africa.
Acknowledgements
We would like to use this opportunity to acknowledge and thank the reviewers and the editor of this journal who reviewed this article and aided in its publication. We would also like to thank participants to the Werner-Gren Foundation's Price of Wealth Symposium held in Pavia, Italy in August 2022 for insightful comments that improved the manuscript.
Disclosure Statement
No potential conflict of interest was reported by the author(s).
Notes
1 Pressman (Citation2015) presents a series of mathematical examples to illustrate this point.
2 The NIDS is conducted by the Southern Africa Labor and Development Research Unit (SALDRU) based at the University of Cape Town while the SIPP is an ongoing panel conducted by the United States Census Bureau (U.S. Census Bureau).
3 In South Africa, ‘Black’ as an identity can encompass all people of color. In this paper we take it to mean those officially designated as ‘Africans’ in South Africa to allow for ease of comparison with the US.
4 The racial wealth gaps persist even when wealth is expressed in per capita rather than at the household level. We present all the results presented in the main text in per capital terms in the Appendix.
References
- Agesa, J., and D. Hamilton. 2004. ‘Competition and Wage Discrimination: The Effects of Interindustry Concentration and Import Penetration*.’ Social Science Quarterly 85 (1): 121–135.
- Bhutta, N., A. C. Chang, L. J. Dettling, and J. W. Hsu. 2020. Disparities in Wealth by Race and Ethnicity in the 2019 Survey of Consumer Finances. Washington, DC: FEDS Notes.
- Branson, N. 2019. ‘Adding a Top-Up Sample to the National Income Dynamics Study in South Africa.’ NIDS Technical Paper 8.
- Brophy, T., N. Branson, R. C. Daniels, M. Leibbrandt, C. Mlatsheni, and I. Woolard. 2018. ‘National Income Dynamics Study Panel User Manual.’ Technical Note Release.
- Chatterjee, A., L. Czajka, and A. Gethin. 2020. ‘Estimating the Distribution of Household Wealth in South Africa.’ UNU-WIDER Working Paper No. 2020/45.
- Chelwa, G., D. Hamilton, and J. Stewart. 2022. ‘Stratification Economics: Core Constructs and Policy Implications.’ Journal of Economic Literature 60 (2): 377–399.
- Chelwa, G., D. Hamilton, and A. Green. 2023. ‘Identity Group Stratification, Political Economy & Inclusive Economic Rights.’ Dædalus 152 (1): 154–167.
- Daniels, R., A. Finn, and S. Musundwa. 2012. ‘Wealth in the National Income Dynamics Study Wave 2.’ SALDRU Working Paper Number 83.
- Daniels, R., A. Finn, and S. Musundwa. 2014. ‘Wealth Data Quality in the National Income Dynamics Study Wave 2.’ Development Southern Africa 31 (1): 31–50.
- Daniels, R., and T. Augustine. 2016. ‘The Measurement and Distribution of Household Wealth in South Africa Using the National Income Dynamics Study (NIDS) Wave 4.’ SALDRU Working Paper Number 183.
- Daniels, R., and S. Khan. 2019. ‘Household Balance Sheets in South Africa.’ SALDRU Working Paper Number 248 Version 1.
- Darity, W. A., and P. L. Mason. 1998. ‘Evidence on Discrimination in Employment: Codes of Color, Codes of Gender.’ Journal of Economic Perspectives 12 (2): 63–90.
- Darity, W. A., D. Hamilton, and J. B. Stewart. 2015. ‘A Tour de Force in Understanding Intergroup Inequality: An Introduction to Stratification Economics.’ The Review of Black Political Economy 42 (1–2): 1–6.
- Gansonré, S., R. M. Al-Hassan, I. M. Ouédraogo, G. T. Kwadzo, and E. E. Onumah. 2023. ‘Sustainability and Wealth of Rural Households: Measurement and Inequality Analysis.’ Review of Income and Wealth 69 (1): 150–169.
- Ghosh, J. 2023. ‘Relational Inequality and Economic Outcomes: A Consideration of the Indian Experience.' Review of Political Economy, DOI: 10.1080/09538259.2023.2242210
- Gittleman, M., and E. N. Wolff. 2004. ‘Racial Differences in Patterns of Wealth Accumulation.’ The Journal of Human Resources 39 (1): 193–227.
- Hamilton, D. 2020. ‘The Moral Burden on Economists: Darrick Hamilton’s 2017 NEA Presidential Address.’ The Review of Black Political Economy 47 (4): 331–342.
- Hamilton, D., O. Biu, C. Famighetti, A. Green, K. Strickland, and D. Wilcox. 2021. Building an Equitable Recovery: The Role of Race, Labor Markets, and Education. Columbus, OH: Kirwan Institute for the Study of Race and Ethnicity, Ohio State University.
- Hamilton, D., D. William, A. E. Price, V. Sridharan, and R. Tippett. 2015. Umbrellas Don’t Make it Rain: Why Studying and Working Hard Isn’t Enough for Black Americans. Oakland, CA: Insight Center for Community Economic Development.
- Hamilton, D., and N. Zewde. 2020. ‘Truth and Redistribution: How to fix the racial wealth gap, end plutocracy, and build Black Power'. YES! https://www.yesmagazine.org/issue/black-lives/2020/08/26/racial-wealth-gap-black-power.
- Hamilton, D., and T. Logan. 2019. ‘Here’s Why Black Families Have Struggled for Decades to Gain Wealth. Market Watch.’ https://www.marketwatch.com/story/heres-why-black-families-have-struggled-for-decades-to-gain-wealth-2019-02-28.
- Mbewe, S., and I. Woolard. 2016. ‘Cross-Sectional Features of Wealth Inequality in South Africa: Evidence from The National Income Dynamics Study.’ SALDRU Working Paper Number 185/ NIDS Discussion Paper 2016/12.
- Nanziri, L. W., and M. Olckers. 2019. ‘Financial Literacy in South Africa.’ SALDRU Working Paper Number 242 Version 1.
- OECD. 2013. OECD Guidelines for Micro Statistics on Household Wealth. Paris: OECD Publishing.
- Orthofer, A. 2016. ‘Wealth Inequality in South Africa: Evidence from Survey and Tax Data.’ Research Project on Employment, Income Distribution & Inclusive Growth Working Paper 15.
- Orthofer, A. 2017. ‘Saving and Wealth in the Context of Extreme Inequality.’ PhD thesis, Stellenbosch University.
- Pellicer, M., and V. Ranchhod. 2023. ‘Understanding the Effects of Racial Classification in Apartheid South Africa.’ Journal of Development Economics 160: 102998.
- Piketty, T. 2014. Capital in the Twenty-First Century. Cambridge, MA: Harvard University Press.
- Piketty, T., and E. Saez. 2014. ‘Inequality in the Long Run.’ Science 344 (6186): 838–843.
- Pressman, S. 2015. Understanding Piketty’s Capital in the 21st Century. London and New York: Routledge.
- Saez, E., and G. Zucman. 2020. ‘The Rise of Income and Wealth Inequality in America: Evidence from Distributional Macroeconomic Accounts.’ Journal of Economic Perspectives 34 (4): 3–26.
- Seekings, J., and N. Nattrass. 2008. Class, Race, and Inequality in South Africa. New Haven, CT: Yale University Press.
- Southern Africa Labour and Development Research Unit. 2018. National Income Dynamics Study 2017, Wave 5 [Dataset] (Version 1.0.0).
- Stoet, G., and D. C. Geary. 2019. ‘A Simplified Approach to Measuring National Gender Inequality.’ PLoS One 14 (1): e0205349.
- United States Census Bureau. 2018. ‘Survey of Income and Program Participation (SIPP)’ (Dataset). Washington, DC: United States Census Bureau.
- United States Census Bureau. 2020. Survey of Income and Program Participation: 2018 Panel Users’ Guide. Washington, DC: United States Census Bureau.
- von Fintel, D., and A. Orthofer. 2020. ‘Wealth inequality and financial inclusion: Evidence from South African Tax and Survey Records.’ Economic Modelling 91: 568–578.
- Wittenberg, M. 2017. ‘Wages and Wage Inequality in South Africa 1994–2011: Part 2 – Inequality Measurement and Trends.’ South African Journal of Economics 85 (2): 298–318.
Appendix
Figure A1. Median household wealth in South Africa and the US (in per capita terms).
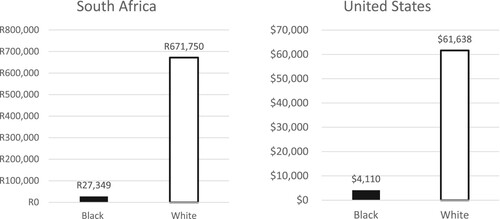
Figure A2. Median household wealth by education in South Africa (in per capita terms).
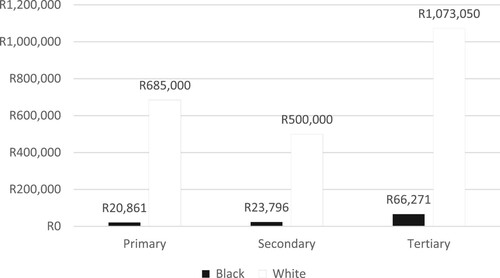
Figure A3. Median household wealth by education in the US (in per capita terms).
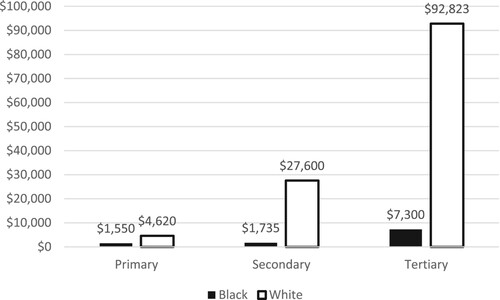
Figure A4. Median household wealth by income quintiles in South Africa (in per capita terms).
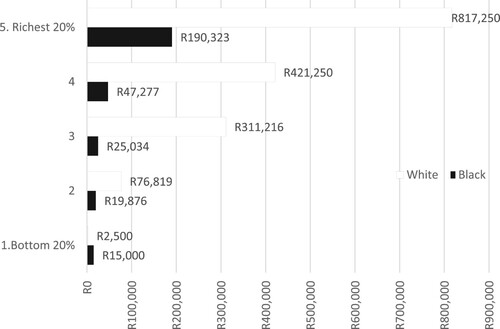
Figure A5. Median household wealth by income quintiles in the US (in per capita terms).
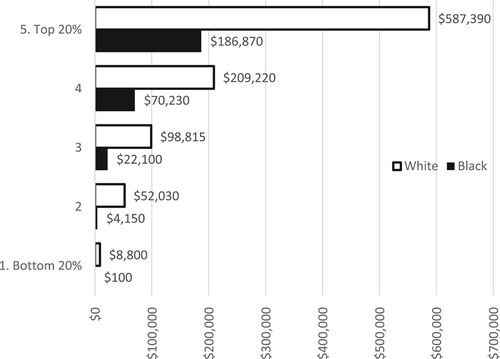
Figure A6. Median household wealth by age-cohorts in South Africa (in per capita terms).
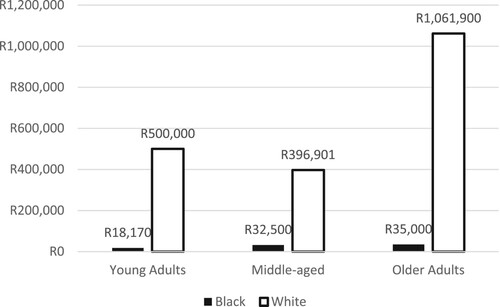
Figure A7. Median household wealth by age-cohorts in the US (in per capita terms).