
 ?Mathematical formulae have been encoded as MathML and are displayed in this HTML version using MathJax in order to improve their display. Uncheck the box to turn MathJax off. This feature requires Javascript. Click on a formula to zoom.
Abstract
Stocks price prediction is a current hot spot with great promise and challenges. Recently, there have been many stock price prediction methods. However, the prediction accuracy of these methods is still far from satisfactory. In this paper, we propose a stock price prediction method that incorporates multiple data sources and the investor sentiment, which can be called S_I_LSTM. Firstly, we crawl multiple data sources on the Internet and preprocess them respectively. These data involve stock historical data, technical indicators, and non-traditional data sources, such as stock posts and financial news. Then, we use the sentiment analysis method based on convolutional neural network for the non-traditional data, which can calculate the investors' sentiment index. Finally, we combine sentiment index, technical indicators and stock historical transaction data as the feature set of stock price prediction and adopt the long short-term memory network for predicting the China Shanghai A-share market. The experiments show that the predicted stock closing price is closer to the true closing price than the single data source, and the mean absolute error can achieve 2.386835, which is better than traditional methods. We verified the effectiveness on the real data sets of five listed companies.
1. Introduction
With the continuous development of deep learning (Liang et al., Citation2020) and blockchain (Liang et al., Citation2020; Liang et al., Citation2021), stock prediction is also a research hotspot in the financial field. The prediction of stock price or trends has always been a long and arduous task due to its characteristics. Early theories on stock market prediction were divided into an efficient market hypothesis (EMH) and random walk theory. The EMH stated that historical information cannot provide any help for predicting stock prices in next day (Fama, Citation1964). According to the random walk theory, future stock price prediction was independent of past prices and the stock price changes were random (Malkiel, Citation1973). Additionally, the EMH theory also believed that the current stock prices are not related to previous prices and would be influenced by financial news. Thus, when an emergency occurs, the prediction results are still far from satisfactory (Li et al., Citation2017). Later, stock investors and academic researchers found that they could forecast the movement of stocks based on some stock historical data of the listed company. For example, Box and Jenkins introduced the Autoregressive integrated moving average (ARIMA) model in 1970, and many scholars used it as a benchmark method for time series data forecasting (Brockwell & Davis, Citation2015). Ariyo et al. (Citation2014, march 26-28) proposed a stock price prediction method based on the ARIMA model, and the experimental results demonstrated better results in short-term prediction. Idrees et al. (Citation2019) analysed the time series data of the Indian stock market and built a statistical model, which achieved efficient stock prediction. Conventional prediction methods are suitable for capturing regular and structured data. When the stock price data is greatly affected by the financial text on the Internet, the prediction accuracy will be significantly reduced. With the rapid development of big data and artificial intelligence, text mining and deep learning have also become research hotspots and focus, which have been also applied to stock prediction. Li et al. (Citation2018, january 29-february 2), Shah et al. (Citation2018, december 10-13), and Yun et al. (Citation2019, september 11-13) explored the impact of emergencies from financial news on stock trends and proved that non-quantitative data has a significant impact on the financial market as well as quantitative data. Moreover, Li et al. (Citation2018, january 29-february 2), Oliveira et al. (Citation2016), Sun et al. (Citation2017, august 10-11), and Wang (Citation2017) also explored the impact of the opinions from social media, and how the investor sentiments affect stock movements. Lin and Hsu (Citation2014) proposed an emerging multi-agent architecture, grounded on cooperative learning, to solve the class-imbalanced classification problem and the results from this study indicate that the presented model performs satisfactorily in risk management. Wang et al. (Citation2020) proposed a mixed utility model to empirically test the relationship among accounting conservatism, corporate governance, comprehensive index, and stock price collapse risk.
In the existing methods, we found that some approaches predicted stock price only based on stock historical data, which seldom introduced unstructured text data in the financial field. Although some methods considered the role of non-traditional data, they only investigated financial news or social media information (Checkley et al., Citation2017; Li et al., Citation2018, january 29-february 2; Oliveira et al., Citation2016; Sun et al., Citation2017, august 10-11; Wang, Citation2017; Zhou et al., Citation2020). To overcome these limitations, our goal is to predict the prices of five stocks in China's Shanghai A-share market with multiple data sources and calculate the error of the predicted prices. We first combine historical stock data, technical indicators, stock forum posts and financial news. Then, we investigate text sentiment analysis based on convolutional neural network (CNN) to calculate the investor's sentiment tendency. Finally, we explored the advantages of long short-term memory (LSTM) to process time series data for predicting stock price. The experimental results show that the proposed method can fit multi-source data well and achieve low error. Our contributions include three aspects:
An S_I_LSTM framework is designed by incorporating multiple data sources and investors’ sentiment.
Sentiment analysis method based on CNN is proposed to calculate the investors’ sentiment index.
LSTM network with attention mechanism is proposed to predict stock price.
The rest of this paper is organised as follows. Section 2 reviews the related work. Section 3 presents the proposed scheme. Section 4 discusses the experiments and results, followed by conclusion in Section 5.
2. Related work
In this section, we will introduce sentiment analysis and give a brief description of CNN and LSTM neural network, which are used in the proposed method.
2.1. Sentiment analysis for stock prediction
The conventional method of time series analysis believes that the fluctuation of stocks is unpredictable. However, behavioural finance theories show that the investors’ irrational investment behaviour will affect the rise and fall of stock prices (Ritter, Citation2003). In particular, with the continuous popularity of social networks, the investors often express their views on social platforms, which will affect the mood of other investors and guide other investors’ decision-making. Existing research showed that there was a correlation between stock price movements and investor sentiment (Statman, Citation2011). In addition, some scholars have also found that forum information on social networks (Wang, Citation2017) and financial news related to the company (Vargas et al., Citation2017, june 26-28) can also influence stock prices. Thus, the analysis of sentiment tendency of financial text data is valuable in the stock prediction. For example, Porshnev et al. (Citation2013) analysed stock market indicators which integrate lexicon-based Twitter sentiment analysis method and historical data. The experiments showed that the machine learning method can predict the DJIA and S&P500 indicators well. Later, Li et al. (Citation2014) created a new sentiment dictionary to analyse sentiment expressed in financial news, and then, explored the impact of financial news on stock price returns. Sohangir et al. (Citation2018) combined the sentiment analysis of financial Stocktwits into different deep learning-based stock prediction methods, and the experiments showed that CNN is the best model to analyse the stock price. Jiawei and Murata (Citation2019, march 13-15) analysed the sentiment of financial news and verified that market sentiment is a very important factor in stock trends forecasting. Then, Mohan et al. (Citation2019) explored how to obtain high-quality training data sets from financial news to improve prediction accuracy. At the same time, Xu and Keselj (Citation2019, december 9-12) also constructed the tweets dataset for stock market prediction. Their experiment verified the time sensitivity of financial tweet sentiment.
2.2. Convolutional neural network
The CNN model was proposed by Krizhevsky et al. (Citation2017) and was widely used in image recognition (Srivastava & Biswas, Citation2020; Ying et al., Citation2021). The structure of CNN mainly includes input layer, convolution layer, pooling layer, fully connected layer and output layer. The CNN mainly selects the classified feature set through the convolution kernel in the convolution layer. Kim (Citation2014) firstly applied CNN into text classification and achieved good results. Selvin et al. (Citation2017, september 13-16) used three different deep learning architectures, namely LSTM, RNN and CNN for the price prediction and compared their performances, and the experiments showed CNN-sliding window model perform better and had less percentage error. After that, Lee and Soo (Citation2017, december 1-3) proposed a recurrent convolutional neural network (RCN) that combined the advantages of convolutions sequence modelling, word embedding for stock price analysis and information extraction from financial news. Chen and He (Citation2018) analysed Chinese stock market based on CNN. Sayavong et al. (Citation2019, august 10-11) investigated different layers in CNN, and applied it into stock prediction in financial field.
2.3. LSTM neural network
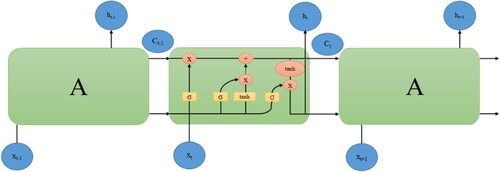
Historical stock transaction data has a strong time correlation, and general deep learning methods do not consider contextual information when processing time series data. LSTM neural network was proposed by Hochreiter and Schmidhuber in 1997 (Hochreiter & Schmidhuber, Citation1997), which is a variant of recurrent neural network (RNN) and can consider the long and short-term dependence well. The LSTM model includes three gate networks, “input gate”, “forget gate” and “output gate”, which perform better than RNN (Sundermeyer et al., Citation2012, september 1). The input gate can decide to put new information in the cell state. The forget gate can determine what to discard from the cell state and what information to retain for solving the problem of gradient disappearance. Finally, the output gate means that can express how much information should be exhibited. Figure shows the LSTM network architecture which can model sequence data well and can combine the information retained by the previous state to process the current task. Due to the efficiency of LSTM in processing time series data, there have a lot of works that adopted the LSTM network for stock market prediction. For example, Li et al. (Citation2017) adopted the LSTM neural network and incorporated investors sentiment tendency for CSI300 index prediction. Vargas et al. (Citation2017, june 26-28) analysed complex patterns and interactions by focusing on the architectures which combined the CNN and LSTM neural network. Subsequently, Vargas et al. (Citation2018, july 8-13) also explored the influence of adding technical indicators by combing CNN and LSTM method. Liu et al. (Citation2018) presented a joint feature extraction method based on knowledge graph embedding. Achkar et al. (Citation2018) considered two different techniques BPA-MLP and LSTM-RNN to predict stock market ratios and achieved high accuracy. Minh et al. (Citation2018) explored short-term stock trends prediction based on two-stream gated recurrent unit network, which is similar to LSTM, but the network has fewer parameters and runs faster. Wu et al. (Citation2018) proposed a novel cross-modal attention-based hybrid recurrent neural network (CH-RNN) to predict stock market. The experiment demonstrated the effectiveness of the CH-RNN. Jiawei and Murata (Citation2019, march 13-15) proposed a stock prediction method based on LSTM network, and the experiment showed that recurrent neuron network with LSTM can handle financial time series data better than traditional time series prediction methods. Eapen et al. (Citation2019) proposed a novel deep learning model that combined multiple pipelines of CNN and bi-directional LSTM units, and the experiments showed that it could improve prediction performance by 9% upon single pipeline deep learning model. Wei (Citation2019, october 17-19) adopted LSTM for predicting the stock price and optimised this network by MBGD algorithm. Xu and Keselj (Citation2019, december 9-12) predicted stock market movements using attention-based LSTM and compared with conventional LSTM for performance.
Figure 1. LSTM network architecture.
3. Methodology
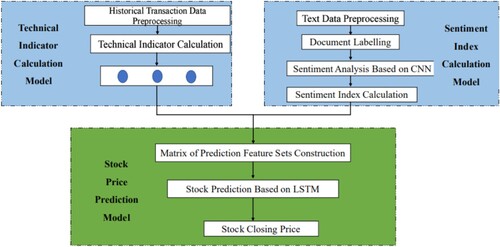
As shown in Figure , we propose a framework using Att-LSTM model for stock price prediction based on sentiment analysis and multiple data sources (S_I_LSTM). Following is the detailed description of the three key models: (1) technical indicator calculation model, (2) sentiment index calculation model, (3) stock prediction model.
Figure 2. The proposed S_I_LSTM framework for stock price prediction.
3.1. Technical indicators calculation model
In this section, we will introduce how to calculate the technical indicators, and mainly include historical transaction data preprocessing and technical indicators calculation. A brief introduction about both is given below.
3.1.1. Historical transaction data preprocessing
Before calculating the technical indicators, we need to preprocess the traditional data sources, including clearing and filtering out some meaningless data to improve the quality of data. We choose five stocks of listed companies from EastMoney.com and crawl the historical trading data of five stocks from it. These transaction data include trading day, stock code, stock name, opening price, closing price, highest price, lowest price, adjusted closing price and trading volume. It is critical to remove unnecessary information and leave trading date, opening price, highest price, lowest price, closing price and trading volume.
3.1.2. Technical indicators calculation
The technical analysis method mainly analyses the stock price fluctuation of the company according to the historical stock trading data and charts, and the technical indicators are often used in the technical analysis method. In this chapter, three technical indexes are selected, which are stochastic oscillator index (%K), William index (%R) and relative strength index (RSI). The stochastic oscillator index (%K) reflects the correlation between the price range and the closing price in a given period of time. The William indicator (%R) is mainly used to measure whether the market is oversold or overbought. The RSI is very suitable for short-term volatility of stock prices. These three technical indicators measure the timing of overbought and oversold to a certain extent, and can also affect the decision-making of investors. Usually, investors will buy stocks when the market is oversold and sell stocks when the market is overbought, so these technical indicators can also affect the fluctuation of stock prices. These three technical indicators are calculated based on the historical trading data of stocks. Their calculation is shown in the formulas (1), (2), (3) and (4). The TA-lib algorithm, a common library for quantitative trading in Python, is used to calculate the three technical indicators:
(1)
(1)
(2)
(2)
(3)
(3)
(4)
(4) where C is the close price, the Ht and Lt respectively denote the highest price and the lowest price for the last t days, RS is the ratio of the average value of the sum of the closing price increase and the average value of the closing price decrease in x days, and the value of x is set by 7 in our experiments.
3.2. Sentiment index calculation model
In Section 3.1, we introduced specific stock analysis methods and used three indicators based on technical analysis. In this paper, fundamental analysis method is also used, and this method can be judged based on the internal and external factors of the company, such as politics, news, economy, interest rate, exchange rate, and the listed company's operation status, etc. With the increasing popularity of social media platforms, in line with previous studies results, financial news (Mohan et al., Citation2019; Yadav et al., Citation2019) and social network information (Porshnev et al., Citation2013; Sun et al., Citation2017, august 10-11; Zhao et al., Citation2016) can also influence investors’ decisions and stock price. Thus, we also incorporate fundamental analysis method to investigate the potential impact of financial news and social platform data on stock prices. The detailed analysis steps involve text data preprocessing, document labelling, text sentiment analysis based on CNN and sentiment index calculation. The detailed introduction of each step is as follows.
3.2.1. Text data preprocessing
Stock price prediction is an extremely complex task because there are many situations that will affect it. Therefore, we need to capture these preconditions as much as possible, then we can understand the stock characteristics from many aspects to achieve better prediction results. In the unstructured financial text data, this paper selects financial news and stock forum posts related to five listed companies and uses web crawler technology to collect enough data sets. According to literature (Vargas et al., Citation2017, june 26-28), we can know that the news headline can obtain more information than the news text. Therefore, we also take news headlines as the research object. Text data preprocessing is a key step in sentiment analysis and high-quality data sources can be obtained after that. Most objects in natural language processing are sentences, so sentences need to be divided into single words. The punctuations are also removed because they have no practical meaning in sentences. In English text, spaces between words are used as separators, but for Chinese, only sentences and paragraphs have obvious separators, and there is no space between words. We use Jieba word segmentation algorithm to segment unstructured data in the financial field. Jieba is a powerful word segmentation library implemented in Python language. We use the precise model of this method to segment every news title and stock forum post in the financial text data set. Then the stopwords dictionary of Harbin Institute of technology is used to filter out the words that have no actual effect in sentences and acquire the word set after the segmentation.
3.2.2. Document labelling
The purpose of sentiment analysis is to mine the opinions expressed by investors in speech or text, and it can be divided into three research levels: word level, sentence level, and chapter level. Sentiment classification based on chapter level can analyse an overall sentiment tendency or polarity. Before using deep learning for sentiment analysis, we need to label each news and forum post information to collect training data sets. Document labelling is to classify financial text into positive and negative based on historical transaction data. The literature (Minh et al., Citation2018) mentioned that there are two ways to label news articles based on historical data: open-to-close (daytime return), close-to-open (overnight return). According to the literature (Wang et al., Citation2009), the daytime return contributes more to the total return than the overnight return. Thus, we also adopt the technology based on open-to-close price. The open-to-close price return is calculated as follows:
(5)
(5)
(6)
(6) where Oa+t is the opening price of day a after day t, which is a period. For example, if day a is October 1th, 2019 and time period t is 2, then Oa+t is the opening price on 3 October 2019. Ca is the closing price of the stock on day a. If Rat is greater or equal to 0, then the news and forum posts on that day are classified as positive, whereas if Rat is less than 0 then the news article and forum posts are labelled as negative.
3.2.3. Sentiment analysis based on CNN
The sentiment index is to calculate the overall sentiment tendency of the public in everyday and is calculated based on the classification results of non-traditional data. However, before calculating, we still need to explore whether the classification of each news or forum post in the document labelling in the previous step is correct or not. Since the structure of the CNN model for text classification is different from that used for image classification, we merge the word vector which is initialised based on Word2vec into the input layer of the CNN model. Word2vec is also a continuous word embedding learning model and has two training models: CBOW (continuous bag-of-words) and skip-gram models (Mikolov et al., Citation2013). The obvious difference between the two is to predict the current word or the context. In our paper, skip-gram can pre-train the high-dimensional text representation of each word in the sentence based on the initial stock corpus. Then the word vector will be used as the input for CNN. The CNN model structure used for sentiment analysis of financial texts mainly involves embedding layer, three convolutional layers, max pooling layer, full connected layer, “softmax” layer and output layer. Figure shows the structure of CNN model. For example, “Sales increased due to growing market rates” is a sentence. Feature vectors trained based on Word2vec are used to initialise the embedding layer. The word vectors obtained by word2vec are reconstructed into an n×k sentences vector matrix at the embedding layer. The fixed length of the sentence is set as n, sentences with length less than n are padded with 0. The k is the word vector dimension. Each word has a word vectors with a fixed dimension. Following is the convolution operator to extract text features and we use a convolutional layer with a convolution kernel to extract word vector features. In the training process, we also used the dropout method, which was proposed by Hinton et al. (Citation2012) to prevent the model from over-fitting. The pooling layer has the same function as the convolutional layer, except that the pooling layer selects the maximum value of the area as a feature. And the classification layer consists of the fully connected layer and “softmax” classifier. In this way, every day's news and forum posts are classified based on CNN and can verify the classification correctness of the individual. Table shows the inner structure of text CNN for sentiment analysis.
Figure 3. Structure of CNN used in this paper.
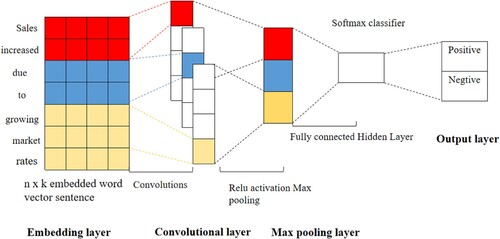
Table 1. The inner structure of text CNN for sentiment analysis.
3.2.4. Sentiment index calculation
In social media or news platform, after an event occurs, the public will have some comments on the company, and news articles will also report. These texts have an impact on the stock movements to a certain extent. After the sentiment analysis of financial texts, each news or post is classified as positive or negative. However, this is only the result of text classification. We need to calculate the overall sentiment tendency of the public in a day based on the number of positive and negative texts. According to the literature (Li et al., Citation2017), the sentiment index is calculated based on the ratio of the sum and the difference between the number of positive and negative texts, which can obtain highly accurate feature set. We follow their method and construct emotional feature sets based on non-traditional data sources. The sentiment measure is defined as the following formula:
(7)
(7) where Mtpos is the total number of positive news and forum posts on day t, and Mtneg is the total number of negative news and forum posts on day t. The range of sentiment index is between −0.5 and +0.5, and the sentiment index below 0 means that the sentiment is negative on the t day.
3.3. Stock price prediction
3.3.1. Constructing the matrix of prediction feature sets
We want to explore whether investor sentiment and technical indicators affect stock price movements. The selected feature sets contain nine-dimensional vectors, which are the open price, highest price, lowest price, close price, volume, sentiment index, stochastic oscillator (%K), William (%R), RSI. They are calculated according to the above formula (1), (2), (3), (4) and (7). We show the data of the last five trading days in the test set in Table and the output of the prediction model is the closing price.
Table 2. The input data format of LSTM prediction model.
3.3.2. Stock price prediction based on Att-LSTM
We regard the problem of stock price prediction as a regression problem not a classification problem. When we model data sets by using a deep neural network, the input label set is the closing price, and the predicted result is also the closing price. In detail, for a given data time t, a given stock s, we can predict the closing price of stock s on day t. Our prediction feature set is the result obtained by fusing two modules, which involve three dimensions of technical indicators analysis, one dimension of sentiment index, and five dimensions of historical transaction data. As shown in Table , the prediction data set matrix which we constructed has obvious chronological order, thus we adopt LSTM model for stock closing prediction. For sequence data with long time intervals and delays, the LSTM network also can capture the relationship on them. According to literature (Kraus & Feuerriegel, Citation2017), the LSTM networks are universally used in the financial field. As shown in Figure , the structure of LSTM model for stock price prediction consists of four parts: input layer, LSTM layer, attention layer and output layer. In the training stage, the inputs to this model include: open price, highest price, lowest price, volume, sentiment index, stochastic oscillator (%K), William (%R), RSI, and the closing price is a label. However, in the testing stage, there are only eight dimensions of data and these data are obtained by fusing the previous two modules. The selection from the matrix of the input layer is shown in formula (8), where
is the input matrix at time t of the stock s.
is the hidden output of the LSTM layer of the stock s at t−1 movement, which was 0 at the beginning, and the Wi and bi donate the weight matrices and the bias corresponding to input gate respectively. The
symbol represents the “sigmoid” function. Next is the LSTM layer, which is composed of many LSTM neurons. Each neuron will process the new input information and the information left by the previous neuron to determine which information can be output and which information will input into the next neuron. Formula (9) and (10) are to calculate the hidden output
of the LSTM layer, that is h1, h2, … , hn in Figure . Ct is the cell state when each LSTM neuron is calculated. Where Wc and bc donate the weight matrices and the bias respectively. And then, the output of the LSTM layer is multi-dimensional, and the fully connected layer is the process of dimensionality reduction, which is converted into a suitable output. The activation function used in this layer is “sigmoid”. However, for predicting the closing price, the contribution of the input to the output at each moment on the day is different. We added an attention layer after the LSTM layer and selected the LSTM layer feature with a higher/lower weight. The last is the output layer, where the output is the predicted closing price. Table shows the internal structure of the LSTM network using the attention layer.
(8)
(8)
(9)
(9)
(10)
(10)
Figure 4. The structure of S_I_LSTM model for stock price prediction.
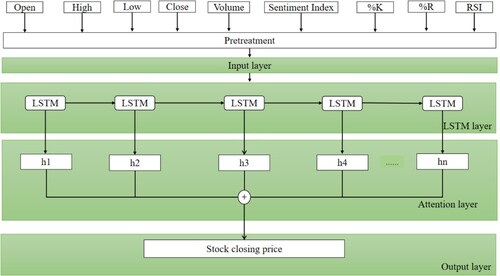
Table 3. The internal structure of LSTM network using attention layer.
4. Experiment results and discussion
4.1. Data description
In our experiments, we selected five listed company stocks from EastMoney.com as the research object. Table shows the detailed information. The dataset used in this work consists of 2351 news articles and 33,500 forum posts in 3377 transaction days from EastMoney.com, which is a professional internet financial media in China, corresponding to the period from 01 July 2017 to 30 April 2020. At the same time, it also crawls the historical stock trading data of the same period. The traditional stock historical data source contains 3377 rows, and each row contains six columns of data including the trading day. Vargas et al. (Citation2017, june 26-28) verified that the prediction results of the features extracted from news headlines are more useful than news content. According to this conclusion, only the headlines of financial news are left in the collected data set we collected. In addition, we select the data from 01 July 2017 to 31 December 2019 as the training set and the data from 01 January 2020 to 30 April 2020 as the test set.
Table 4. Description of the selected stocks.
4.2. Performance evaluation metric
Future prediction methods can be divided into two categories, movement prediction and future value prediction. In the stock market prediction, according to different future prediction, it can be divided into classification problems and regression problems, and different problems will have different evaluation indicators. In this paper, we view stock prediction as a regression problem, and can predict the close price. The most commonly used performance measurements have mean absolute error (MAE), mean square error (MSE) and root mean square error (RMSE). Where f is the predicted value and y is the true value:
(11)
(11)
(12)
(12)
(13)
(13)
4.3. Experimental results and performance comparison
In this section, the effect of the four data sources on five stocks will be verified based on S_I_LSTM prediction model. We use formula (11), (12), (13), three evaluation indicators to measure the performance on the test set under different conditions. We have conducted several experiments as follows.
4.3.1. Comparison of the effect on multi-source datasets and single source dataset
First, since people are often irrational when investing, it is difficult to rely on a single traditional data to simulate stock trends or prices. Therefore, it is necessary to compare the potential impact on the stock closing price of historical transaction data, technical indicators, financial news, and stock forum posts. The results are shown in Table . It can be seen that when only single data source is used as feature set to predict the closing price of a stock (for example, only historical transaction data, only technical indicators or only sentiment index), the result of MAE is higher than multi-source data set. Moreover, when only considering the sentiment tendency of investors, the MAE value is higher than the error value when only historical transaction data is used. This also confirms the original assumption that the investment trend of investors can only assist their decision-making, and cannot refer to investment. The sentiment index also needs to combine historical transaction data to achieve better prediction results, because investors are not all rational investments. When using multiple data sources, the average absolute error can reach 2.386835, which is lower than the other three single data sources, which are 0.082532, 0.072659 and 0.120507, respectively. However, when compared with MSE results, the result of predicting the stock closing price based on technical indicators is lower than other indicators, it is indicated that technical indicators are also more important influencing factors, and the prediction results need to comprehensively consider the error values of the three measurement indicators. In short, through this experimental comparison, it can be concluded that investors are more inclined to use multi-source data to assist their decision-making.
Table 5. Comparison of the single data source and the multiple data sources.
4.3.2. Comparison with other similar methods
Secondly, it is necessary to verify the proposed S_I_LSTM model, which contains stock historical data, technical indicators and sentiment analysis results. The results are shown in Table . It can be seen that when multiple data sources and sentiment analysis are combined to predict the closing price of stocks, the MAE based on S_I_LSTM can reach 2.386835. Compared with the literature (Zhang et al., Citation2019), our method’s MAE is reduced by 0.654165. They employed the successful experience of generative adversarial networks (GAN) and proposed a structure for predicting stock prices. Their structure adopted multi-layer perception (MLP) as the discriminator and LSTM as the generator. Jin et al. (Citation2019) proposed a stock market prediction model based on LSTM, in which the investor's sentiment tendency and EMD stock history data decomposition method were all taken into account. Their method also considered the investor's sentiment index, but only single non-traditional data set of the investor's comment data on the Stocktwits website was considered. Then the LSTM neural network combined with sentiment analysis results is used to predict stock closing price. Therefore, the MAE result of their method is 0.009286 higher than the result of the method proposed in this paper. Experiments with the method proposed in this paper on real data sets of five listed companies in China’s A-share market show that the combination of historical stock data, technical indicators, financial news and social media data and other multi-source data sets can help investors make decisions. At the same time, the S_I_LSTM stock prediction framework proposed in this article can also prove that investor sentiment and technical indicators are factors that affect stock price trends.
Table 6. The detailed results of the evaluation indicators for each model.
4.3.3. Comparison of the five stocks of listed company
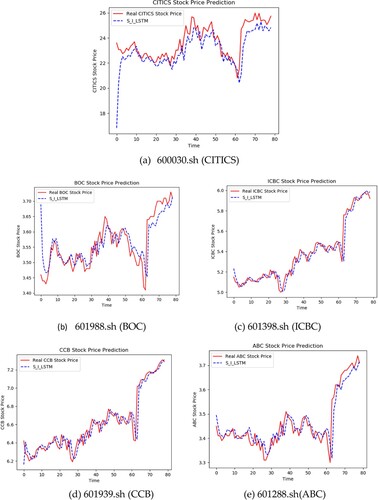
Finally, we compared the results of predicting the closing price of stocks of five listed companies through experiments, and the results are shown in Figure . In the figure, the x-axis represents 80 days of multi-source data in the test set, and the y-axis represents the stock closing price of listed companies. The red solid line represents the actual closing prices of the five listed companies, and the blue dotted line labelled “S_I_LSTM” is an LSTM model with sentiment index and technical indicators. It can be seen that at the beginning of the test period, the model's ability to fit the data is very poor. It can be clearly seen from the subgraph(a) that from the 1st day to the 5th day, the predicted closing price start from a small number to rise, it shows that the model is constantly capturing the law of stock changes every day. And from subgraph(b), it can be seen that the predicted closing price is directly higher and begins to fall over time. It also shows that at the beginning during the period, the amount of data is small, and the ability of the model to capture features is insufficient, but after the fifth day, as the amount of data gradually increases, the predictive ability of the model continues to improve. Moreover, these five listed companies have a simultaneous downward trend in 50–60 days of the test period. This is because of the new coronavirus pneumonia (COVID-19) that occurred in early 2020 that caused a severe decline in the stock market. During this period of time, there were many negative news about listed companies, and stock price prediction also showed a downward trend. By comparing the effectiveness of the S_I_LSTM prediction framework on the individual stock data set, it is found from subgraph (a)–(e) that the model has a good fit for the multi-source data set of five listed companies, and it also confirms that the impact of company-related financial news and forum posts on prediction results. What’s more, our research can be made into a stock price prediction system. This system can predict the ups and downs of stocks in advance and can assist investors in making decisions. And it allows investors to trade stocks at the right time to assist investors in making decisions.
Figure 5. The five companies’ closing price prediction results.
4. Conclusions
In this paper, a novel framework of S_I_LSTM model was proposed for stock price prediction. We discussed the impact of traditional data sources (stock historical transaction data and technical indicators) and non-traditional data sources (stock posts and financial news) on stock price predictions. Moreover, we also investigated whether the technical indicators have an impact on stock predictions. We proposed a deep learning method to analyse China's Shanghai A-share market based on multiple data sources. The proposed method incorporated investor sentiment and technical indicators into the stock price prediction. At the same time, the proposed method could provide investors with investment advice, which can be used to guide actual investment and had certain practical significance. However, due to the lack of time and our research ability, this paper still has certain limitations and needs to be further improved in future research. For example, there is less consideration in training labelled data. Also, the cycle or granularity of stock prediction are all factors that will be considered, which can increase the actual research value.
Acknowledgements
This work was supported by the National Natural Science China under Grant 61872134, the Science and Technology Development Center of the Ministry of Education under Grant 2019J01020, the Science and Technology Program of Changsha City under Grant kh2005019, kq2004021 and the 2011 Collaborative Innovative Center for Development and Utilisation of Finance and Economics Big Data Property, Universities of Hunan Province.
Disclosure statement
No potential conflict of interest was reported by the author(s).
Data availability statement
The datasets used and analysed during the current study are available from the corresponding author on reasonable request.
Additional information
Funding
References
- Achkar, R., Elias-Sleiman, F., Ezzidine, H., & Haidar, N. (2018). Comparison of BPA-MLP and LSTM-RNN for stocks prediction. In 2018 6th International Symposium on Computational and Business Intelligence (ISCBI) IEEE, 48–51. https://doi.org/10.1109/ISCBI.2018.00019.
- Ariyo, A. A., Adewumi, A. O., & Ayo, C. K. (2014, March 26-28). Stock price prediction using the ARIMA model. 2014 UKSim-AMSS 16th International Conference on Computer Modelling and Simulation, Cambridge, 106–112. https://doi.org/10.1109/UKSim.2014.67.
- Brockwell, P. J., & Davis, R. A. (2015). Time series: Theory and methods. Springer-Verlag.
- Checkley, M. S., Higón, D. A., & Alles, H. (2017). The hasty wisdom of the mob: How market sentiment predicts stock market behavior. Expert Systems with Applications, 77, 256–263. https://doi.org/10.1016/j.eswa.2017.01.029
- Chen, S., & He, H. (2018). Stock prediction using convolutional neural network. IOP Conference Series: Materials Science and Engineering, 435(1), 012026. https://doi.org/10.1088/1757899X/435/1/012026
- Eapen, J., Bein, D., & Verma, A. (2019, January 7-9). Novel deep learning model with CNN and bi-directional LSTM for improved stock market index prediction. 2019 IEEE 9th Annual Computing and Communication Workshop and Conference (CCWC) IEEE, 0264–0270. https://doi.org/10.1109/CCWC.2019.8666592.
- Fama, E. F. (1964). The distribution of the daily differences of the logarithms of stock prices. Unpublished Ph. D Dissertation, University of Chicago.
- Hinton, G. E., Srivastava, N., Krizhevsky, A., Sutskever, I., & Salakhutdinov, R. R. (2012). Improving neural networks by preventing co-adaptation of feature detectors. arXiv preprint arXiv:1207.0580.
- Hochreiter, S., & Schmidhuber, J. (1997). Long short-term memory. Neural Computation, 9(8), 1735–1780. https://doi.org/10.1162/neco.1997.9.8.1735
- Idrees, S. M., Alam, M. A., & Agarwal, P. (2019). A prediction approach for stock market volatility based on time series data. IEEE Access, 7, 17287–17298. https://doi.org/10.1109/ACCESS.2019.2895252
- Jiawei, X., & Murata, T. (2019, March 13-15). Stock market trend prediction with sentiment analysis based on LSTM neural network. Proceedings of the International MultiConference of Engineers and Computer Scientists, 475–479.
- Jin, Z., Yang, Y., & Liu, Y. (2019). Stock closing price prediction based on sentiment analysis and LSTM. Neural Computing and Applications, 1–17. https://doi.org/10.1007/s00521-019-04504-2
- Kim, Y. (2014). Convolutional neural networks for sentence classification. arXiv preprint arXiv,1408.5882. https://doi.org/10.3115/v1/D14-1181.
- Kraus, M., & Feuerriegel, S. (2017). Decision support from financial disclosures with deep neural networks and transfer learning. Decision Support Systems, 104, 38–48. https://doi.org/10.1016/j.dss.2017.10.001
- Krizhevsky, A., Sutskever, I., & Hinton, G. E. (2017). Imagenet classification with deep convolutional neural networks. Communications of the ACM, 60(6), 84–90. https://doi.org/10.1145/3065386
- Lee, C. Y., & Soo, V. W. (2017, December 1-3). Predict stock price with financial news based on recurrent convolutional neural networks. 2017 Conference on Technologies and Applications of Artificial Intelligence (TAAI) IEEE, 160–165. https://doi.org/10.1109/TAAI.2017.27.
- Li, J., Bu, H., & Wu, J. (2017, June 16-18). Sentiment-aware stock market prediction: A deep learning method. Proceedings of 2017 International Conference on Service Systems and Service Management IEEE, 1–6. https://doi.org/10.1109/ICSSSM.2017.7996306.
- Li, X., Xie, H., Chen, L., Wang, J., & Deng, X. (2014). News impact on stock price return via sentiment analysis. Knowledge-Based Systems, 69, 14–23. https://doi.org/10.1016/j.k-nosys.2014.04.022
- Li, M., Yang, C., Zhang, J., Puthal, D., Luo, Y., & Li, J. (2018, January 29-February 2). Stock market analysis using social networks. Proceedings of the Australasian Computer Science Week Multiconference, 1–10. https://doi.org/10.1145/3167918.3167967.
- Liang, W., Xiao, L., Zhang, K., Tang, M., He, D., & Li, K. C. (2021). Data fusion approach for collaborative anomaly intrusion detection in blockchain-based systems. IEEE Internet of Things Journal, 1–1. https://doi.org/10.1109/JIOT.2021.3053842
- Liang, W., Xie, S., Zhang, D., Li, X., & Li, K. (2020a). A mutual security authentication method for RFID-PUF circuit based on deep learning. ACM Transactions on Internet Technology, 1–20. https://doi.org/10.1145/3426968
- Liang, W., Zhang, D., Lei, X., Tang, M., Li, K., & Zomaya, A. (2020b). Circuit copyright blockchain: Blockchain-based homomorphic encryption for IP circuit protection. IEEE Transactions on Emerging Topics in Computing, 1–1. https://doi.org/10.1109/TETC.2020.2993032
- Lin, S. J., & Hsu, M. F. (2014). Enhanced risk management by an emerging multi-agent architecture. Connection Science, 26(3), 245–259. https://doi.org/10.1080/09540091.2014.908821
- Liu, Y., Zeng, Q., Yang, H., & Carrio, A. (2018, August 28-29). Stock price movement prediction from financial news with deep learning and knowledge graph embedding. In Pacific rim Knowledge acquisition workshop (pp. 102–113). Springer, Kenichi Yoshida, Maria Lee. https://doi.org/10.1007/978-3-31997289-3_8.
- Malkiel, B. G. (1973). A random walk down wall street. W. W. Norton.
- Mikolov, T., Chen, K., Corrado, G., & Dean, J. (2013). Efficient estimation of word representations in vector space. arXiv preprint arXiv:1301.3781.
- Minh, D. L., Sadeghi-Niaraki, A., Huy, H. D., Min, K., & Moon, H. (2018). Deep learning approach for short-term stock trends prediction based on two-stream gated recurrent unit network. IEEE Access, 6, 55392–55404. https://doi.org/10.1109/ACCESS.2018.2868970
- Mohan, S., Mullapudi, S., Sammeta, S., Vijayvergia, P., & Anastasiu, D. C. (2019, April 4-9). Stock price prediction using news sentiment analysis. 2019 IEEE Fifth International Conference on Big Data Computing Service and Applications (BigDataService) IEEE, 205–208. https://doi.org/10.1109/BigDataService.2019.00035.
- Oliveira, N., Cortez, P., & Areal, N. (2016). Stock market sentiment lexicon acquisition using microblogging data and statistical measures. Decision Support Systems, 85, 62–73. https://doi.org/10.1016/j.dss.2016.02.013
- Porshnev, A., Redkin, I., & Shevchenko, A. (2013, December 7-10). Machine learning in prediction of stock market indicators based on historical data and data from twitter sentiment analysis. 2013 IEEE 13th International Conference on Data Mining Workshops IEEE, 440–444. https://doi.org/10.1109/ICDMW.2013.111.
- Ritter, J. R. (2003). Behavioral finance. Pacific-Basin Finance Journal, 11(4), 429–437. https://doi.org/10.1016/S0927-538X(03)00048-9
- Sayavong, L., Wu, Z., & Chalita, S. (2019, August 10-11). Research on stock price prediction method based on convolutional neural network. 2019 International Conference on Virtual Reality and intelligent Systems (ICVRIS) IEEE, 173–176. https://doi.org/10.1109/ICVRI-S.2019.00050.
- Selvin, S., Vinayakumar, R., Gopalakrishnan, E. A., Menon, V. K., & Soman, K. P. (2017, September 13-16). Stock price prediction using LSTM, RNN and CNN-sliding window model. 2017 International Conference on Advances in Computing, Communications and Informatics (ICACCI) IEEE, 1643–1647. https://doi.org/10.1109/ICACCI.2017.8126078.
- Shah, D., Isah, H., & Zulkernine, F. (2018, December 10-13). Predicting the effects of news sentiments on the stock market. 2018 IEEE International Conference on Big Data, 2018. (Big data), Seattle, WA, USA, 4705–4708. https://doi.org/10.1109/BigData.2018.8621884.
- Sohangir, S., Wang, D., Pomeranets, A., & Khoshgoftaar, T. M. (2018). Big data: Deep learning for financial sentiment analysis. Journal of Big Data, 5(1), 3–28. https://doi.org/10.1186/s40537-017-0111-6
- Srivastava, V., & Biswas, B. (2020). CNN-based salient features in HSI image semantic target prediction. Connection Science, 32(2), 113–131. https://doi.org/10.1080/0954009-1.2019.1650330
- Statman, M. (2011). Investor sentiment, stock characteristics, and returns. The Journal of Portfolio Management, 37(3), 54–61. https://doi.org/10.3905/jpm.2011.37.3.054
- Sun, T., Wang, J., Zhang, P., Cao, Y., Liu, B., & Wang, D. (2017, August 10-11). Predicting stock price returns using microblog sentiment for Chinese stock market. 2017 3rd International Conference on Big Data Computing and Communications (BIGCOM) IEEE, 87–96. https://doi.org/10.1109/BIGCOM.2017.59.
- Sundermeyer, M., Schlüter, R., & Ney, H. (2012, September 1). LSTM neural networks for language modeling. Thirteenth Annual Conference of the International Speech Communication Association.
- Vargas, M. R., Anjos, C. D., Bichara, G. L., & Evsukoff, A. G. (2018, July 8-13). Deep leaming for stock market prediction using technical indicators and financial news articles. 2018 International Joint Conference on Neural Networks (IJCNN) IEEE, 1–8. https://doi.org/10.1109/IJCNN.2018.8489208.
- Vargas, M. R., De Lima, B. S., & Evsukoff, A. G. (2017, June 26-28). Deep learning for stock market prediction from financial news articles. 2017 IEEE International Conference on Computational Intelligence and Virtual Environments for Measurement Systems and Applications (CIVEMSA) IEEE, 60–65. https://doi.org/10.1109/CIVEMSA.2017.7995302.
- Wang, Y. (2017). Stock market forecasting with financial micro-blog based on sentiment and time series analysis. Journal of Shanghai Jiaotong University (Science), 22(2), 173–179. https://doi.org/10.1007/s12204-017-1818-4
- Wang, Q., Li, X., & Liu, Q. (2020). Empirical research of accounting conservatism, corporate governance and stock price collapse risk based on panel data model. Connection Science, 1–16. https://doi.org/10.1080/09540091.2020.1806204
- Wang, F., Shieh, S. J., Havlin, S., & Stanley, H. E. (2009). Statistical analysis of the overnight and daytime return. Physical Review E, 79(5), 056109. https://doi.org/10.1103/PhysRevE.79.056109
- Wei, D. (2019, October 17-19). Prediction of stock price based on LSTM neural network. 2019 International Conference on Artificial Intelligence and Advanced Manufacturing (AIAM) IEEE, 544–547. https://doi.org/10.1109/AIAM48774.2019.00113.
- Wu, H., Zhang, W., Shen, W., & Wang, J. (2018, October 22-26). Hybrid deep sequential modeling for social text-driven stock prediction. Proceedings of the 27th ACM International Conference on Information and Knowledge Management, 1627–1630. https://doi.org/10.1145/3269206.3269290.
- Xu, Y., & Keselj, V. (2019, December 9-12). Stock prediction using deep learning and sentiment analysis. 2019 IEEE International Conference on Big Data (Big Data) IEEE, 5573–5580. https://doi.org/10.1109/BigData47090.2019.9006342.
- Yadav, R., Kumar, A. V., & Kumar, A. (2019). News-based supervised sentiment analysis for prediction of futures buying behaviour. IIMB Management Review, 31(2), 157–166. https://doi.org/10.1016/j.iimb.2019.03.006
- Ying, L., Qian Nan, Z., Fu Ping, W., Tuan Kiang, C., Keng Pang, L., Heng Chang, Z., Lu, C., Jun, L. G., & Nam, L. (2021). Adaptive weights learning in CNN feature fusion for crime scene investigation image classification. Connection Science, 2021(5), 1–16. https://doi.org/10.1080/09540091.2021.1875987
- Yun, H., Sim, G., & Seok, J. (2019, September 11-13). Stock prices prediction using the title of newspaper articles with Korean natural language processing. 2019 International Conference on Artificial Intelligence in Information and Communication (ICAIIC) IEEE, 019–021. https://doi.org/10.1109/ICAIIC.2019.8668996.
- Zhang, K., Zhong, G., Dong, J., Wang, S., & Wang, Y. (2019). Stock market prediction based on generative adversarial network. Procedia Computer Science, 147, 400–406. https://doi.org/10.1016/j.procs.2019.01.256
- Zhao, B., He, Y., Yuan, C., & Huang, Y. (2016, July 24-29). Stock market prediction exploiting microblog sentiment analysis. 2016 International Joint Conference on Neural Networks (IJCNN) IEEE, 4482–4488. https://doi.org/10.1109/IJCNN.2016.7727786.
- Zhou, Z., Gao, M., Liu, Q., & Xiao, H. (2020). Forecasting stock price movements with multiple data sources: Evidence from stock market in China. Physica A: Statistical Mechanics and its Applications, 542, 123389. https://doi.org/10.1016/j.physa.2019.123389