
 ?Mathematical formulae have been encoded as MathML and are displayed in this HTML version using MathJax in order to improve their display. Uncheck the box to turn MathJax off. This feature requires Javascript. Click on a formula to zoom.
Abstract
An ontology provides a formal description on the domain concepts and their relationships. Due to the subjectivity of ontology engineers, one concept might be expressed in various ways, yielding the so-called ontology heterogeneity problem, and ontology matching is a ground method to address this problem. Ontology matching technique uses the similarity measure to determine the correspondences between two heterogeneous ontology entities. In order to improve the quality of ontology alignment, it is necessary to combine different kinds of similarity measures, and how to optimize the aggregating weights is called the ontology meta-matching problem. Tin this work, a heuristic evaluating metric on the ontology alignment is presented to evaluate the ontology alignment's quality, and a mathematical model on ontology meta-matching problem is constructed. Then, an Adaptive Evolutionary Algorithm (AEA) is proposed to effectively solve this problem. In particular, when the elite solution remains unchanged, AEA adaptively activates three independent exploring strategies, which, respectively use the adaptive selection, crossover and mutation operators based on the population diversity metric. In the experiment, we compare AEA among EA based matching technique and the state-of-the-art ontology matching technique, and the experimental results show its effectiveness.
1. Introduction
In order for two intelligent systems to implement the co-operation at the semantic level, it is necessary to use ontology to make an accurate semantic description on the shared data and knowledge (Zhang et al., Citation2020). An ontology is a formal and normalised description of the objects, concepts and other entities that exist in a domain and the relationships between them (Acampora & Vitiello, Citation2020). However, because of the subjective nature of ontology engineers, one concept in the same domain may be described in different ways, leading to the problem of ontology heterogeneity (Xue et al., Citation2020). It is an obstacle to implement the semantic interaction between systems (Benkhelifa et al., Citation2020), and currently the most reliable method to solve the problem is ontology matching.
In general, ontology matching is aimed at finding the entity correspondences between two heterogeneous ontologies. By means of using the similarity measures, an ontology matching system can distinguish the heterogeneous entities and generate the ontology alignment (Xue & Chen, Citation2021). To be specific, similarity measure can be seen as a function that calculates what extent two entities are similar and outputs a real number from 0 to 1. The frequently-used similarity measures can be categorised into three categories, i.e. the syntax-based, semantic-based and structure-based measures (Rahm & Bernstein, Citation2001). Since a single similarity measure is not able to ensure the result's confidence, it is usually necessary to combine several measures. How to determine the aggregating weights to obtain the high-quality alignment is the so-called ontology meta-matching problem (Martinez-Gil & Aldana-Montes, Citation2011), which is a challenging problem in the ontology matching domain.
In recent years, researchers have put forward a large number of automated or semi-automated ontology matching systems, which apply different computational intelligent techniques, such as Evolutionary Algorithm (EA) (Hancer, Citation2019) to determine the ontology alignment. GOAL (Genetics for Ontology Alignments) (Martinez-Gil et al., Citation2008) is the most notable one, which uses the standard EA to find the optimal aggregating weights. GOAL assesses the quality of the final alignment by reference alignment. Being inspired by GOAL, Vitiello et al. (Citation2013) employs Memetic Algorithm (MA) and Xue et al. utilises MA with both MatchFmeasure and Unanimous Improvement Ratio (UIR) (Xue & Wang, Citation2015) to address the ontology meta-matching problem. MA combines genetic algorithm and local search such as hill climbing algorithm in Xue and Wang (Citation2015). To realise the tradeoff between the global search and the local search, generally the local search strategy is executed in each evolutionary cycle and performs iterative search for optimal solution in the neighbourhood of the best individual of population. This marriage reduces the possibility of premature convergence and improves the quality of solution via strong mutation and a lot of fine-grained local search processes. Lv and Jiang (Citation2020) solves ontology meta-matching problem through EA with adaptive selection pressure. In this way, the selection pressure can be adjusted when needed to enlarge the population's diversity while the other EA operators keeps unchanged.
In this paper, an Adaptive Evolutionary Algorithm (AEA) is proposed, which can make full use of the evolutionary operators to overcome the problem of premature convergence. In particular, AEA first utilises the regular evolving strategy to execute the searching process, and when the elite solution keeps unchanged, it adaptively activates the exploring strategies. In this work, there are three independent exploring strategies, which respectively use the adaptive selection, crossover and mutation operators based on the population diversity metric. In addition, we propose a heuristic evaluating metric on alignment's quality, which does not require the reference alignment. Specifically, the contributions of this paper are as follows:
The heuristic evaluating metric is presented to evaluate the quality of an ontology alignment, which works without using the reference alignment.
An optimisation model of ontology meta-matching problem is constructed, which regards it as a continuous optimal problem.
An AEA-based ontology meta-matching technique is proposed, which uses the adaptive evolving strategies to help the algorithm effectively search for the global optima.
The rest of the paper is organised as follows: In Section 2, we introduce the related concepts of ontology matching; Section 3 formally defines the ontology meta-matching problem; Section 4 provides a detailed description on AEA; the experimental results and analysis are shown in Section 5; and finally, Section 6 draws the conclusions and presents the future work.
2. Preliminary
2.1. Ontology and ontology matching
Ontology is regarded as a technique for modelling domain knowledge by describing concepts and the relationships between them in the field of computer science (Ngo et al., Citation2013). Specifically, an ontology mainly consists of the following entities:
Class: represents a collection of objects with common characteristics in a particular domain.
Property: describes the relationships between two entities in a specific domain.
Instance: describes the concrete object corresponding to the classes in the real world.
Figure shows an example of an ontology. In the figure, “information technology” and “computer technology” are two classes in the field of technology, “scientist” and “computer scientist” are two classes in the field of human. “Artificial intelligence” is an instance of “computer technology” and “Turing” is a famous scientist in the field of computer science. “Research” is a property that describes the relationship between two classes.
Figure 1. An example of an ontology's class, property and instance.
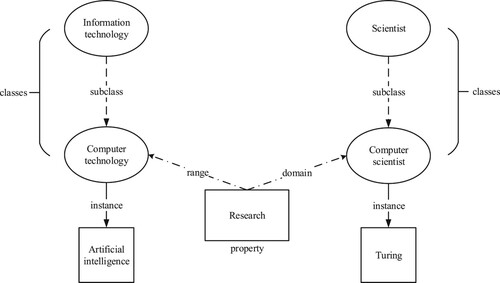
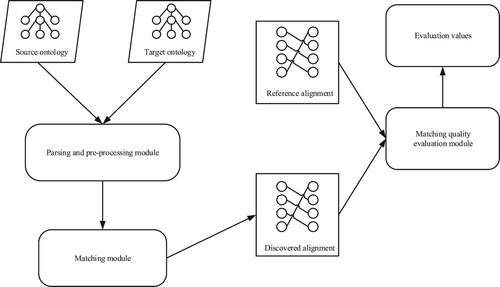
Figure shows the general process of ontology matching and alignment evaluation. As shown in the figure, a source ontology and a target ontology
are sent to the matching module after parsing and some pre-processing work. Then, the matching module is in charge of determining the alignment which consists of a number of mappings, i.e. matching pairs. Finally, the matching quality evaluation module evaluates the quality of obtained alignment with the reference alignment.
Figure 2. The flowchart of matching two ontologies and evaluating the alignment.
2.2. Similarity measure
A Similarity measure can be seen as a function , where
is the set of source entities and
is the set of target entities. Xue and Yang (Citation2021) For each pair of entities
, a real number generally between 0 and 1, expressing the similarity between two entities is computed by a similarity measure.
2.2.1. Syntax-based similarity measure
Syntax-based similarity measure calculates the morphological similarity of two entities' annotations, i.e. labels, comments. In this work, SMOA distance (Stoilos et al., Citation2005) is selected, which is a high-performance syntax-based similarity measure. In particular, it considers both the same and different characters in two strings, given two strings and
, it is defined as follows:
(1)
(1) where
is the measure of the congruence between
and
,
is the measure of incongruence, and
is the improvement of the result through the method proposed by Winkler (Citation1999).
2.2.2. Semantic-based similarity measure
Semantic-based similarity measure determines the semantic distance by considering the synonym or hypernym relationship between two words. To calculate the semantic similarity, a dictionary or a synonymordlista is needed, and WordNet (Miller, Citation1995) is the most commonly used one. This paper uses WuandPalmer (Wu, Citation1995) similarity measure to calculate the similarity between two entities, which is defined as follows:
(2)
(2) where LCA
represents the closest common parent concept between
and
;
,
and
represent the depth of hierarchy, respectively.
2.2.3. Structure-based similarity measure
Structure-based similarity measure calculates the similarity of entities by comparing the structure information of two ontologies. Xue and Wu (Citation2021) In this paper, the proposed structure-based similarity measure takes advantage of the information on an entity's subclasses and superclasses, which is defined as follows:
(3)
(3) where
and
are two entities from two ontologies,
and
represent the similarity about the number of entities' subclasses and superclasses, and
and
are the mean value of syntactic and semantic similarity between their subclasses and superclasses.
2.3. Similarity calculating and alignment determining
Ontology meta-matching integrates the similarity matrices obtained by using different similarity measures. In order to get the similarity matrix, the following operating steps are executed (Xue & Chen, Citation2019): (1) parse the ontologies to be matched using the API provided by Apache JenaFootnote1 to get the information about ontologies including the textual contents of entities, i.e. ID, label and comment, and the super-sub relationship between entities; (2) calculate the similarities of textual contents by the syntax-based and semantic-based similarity measures and the structural similarity of entities by the structure-based similarity measure; (3) calculate the average value of the similarities obtained by the syntax-based and semantic-based similarity measures. Figure shows the flowchart of calculating the similarity values:In Figure , SyID, SyLa and SyCo are, respectively, the similarity value of ID, Label and Comment calculated by syntax-based similarity measure. SeID, SeLa and SeCo are determined by semantic-based similarity measure. St is the similarity value calculated by structure-based similarity measure. SyAv and SeAv are, respectively, the average values of syntax-based and semantic-based similarity values.
Figure 3. The flowchart of similarity calculation with three kinds of similarity measures.
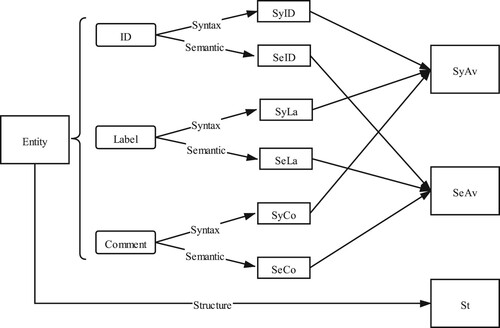
Figure shows an example of determining an alignment from a similarity matrix. Where and
are, respectively, the
entity and
entity in the source ontology and target ontology. The real numbers in the matrix are the similarity values of the entities on the corresponding rows and columns. The mappings can be firstly extracted through finding some specific similarity values which are the largest of the corresponding rows and columns, as shown by the bold numbers in the matrix. Since the matching mechanism is one-to-one, i.e. one entity has only one matched entity, the number of mappings may be less then entities. Then the final alignment is obtained by means of filtering through a threshold Th.
Figure 4. Determining an alignment from a similarity matrix.
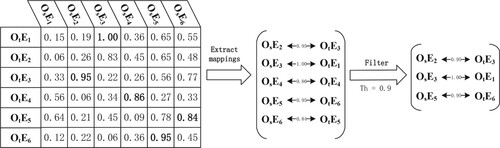
Figure 5. Ontology meta-matching process.
3. Ontology meta-matching problem
3.1. Ontology meta-matching process
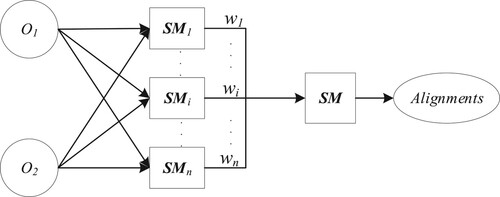
Since a single measure is difficult to precisely calculate the similarity between two entities, it is necessary to make multiple measures work together to obtain a result with a higher confidence level. Ontology meta-matching technique dedicates to integrate different similarity measures by assigning the aggregating weights (Xue & Chen, Citation2021). Figure shows the framework of ontology meta-matching, where and
are respectively the source and target ontologies to be matched, and
is the similarity matrix calculated by the ith similarity measure. By assigning n aggregating weights, i.e.
, to these similarity matrices, i.e.
, a final matrix SM can be obtained as shown in formula (Equation8
(8)
(8) ).
(4)
(4)
3.2. Heuristic evaluating metric on ontology alignment
The traditional evaluating metrics on the quality of alignment are from the field of information retrieval, which are respectively defined as follows Xue and Yao (Citation2018):
(5)
(5)
(6)
(6)
(7)
(7) where R is the reference alignment given by experts in related fields, and A is the final alignment we obtained. The value of
is the harmony mean of recall and precision.
These three metrics can evaluate the quality of the final alignment, but they require the reference alignment to be given in advance. In the practical matching scenario, it is difficult to get the exactly right reference alignment. In order to overcome this flaw, assuming that the required ontology alignment is 1: 1, i.e. one entity in an ontology matches with only one entity in another ontology and vice versa, three heuristic evaluating metrics are proposed in this paper, which are defined as follows:
(8)
(8)
(9)
(9)
(10)
(10) where
and
are, respectively, the amount of entities in the source and the target ontologies.
and
are respectively the number of entities which have been matched in ontology
and
.
represents the ratio of the number of matched entities in ontologies to the total number of entities.
represents the number of matching pairs and
is the similarity of the ith matching pair.
denotes the mean similarity value of the final alignments. The value of
is the harmony mean of
and
, and this paper takes
as the optimising objective.
3.3. Single-Objective optimal model
The single-objective optimal model of ontology meta-matching problem based on no reference alignments is constructed as follows:
(11)
(11) where X is the parameter set for aggregating n similarity measures, including
. th represents the threshold used to filter out matching pairs with low similarity values. The values of
and th range from 0 to 1. In this work, we take maximising
as objective, and we select three similarity measures, i.e. n = 3.
4. Adaptive evolutionary algorithm based ontology meta-matching
4.1. The framework of adaptive evolutionary algorithm
EA is an intelligent optimisation algorithm which is inspired by Darwin's evolutionary theory to solve practical problems (Deb & John, Citation1975). EA owns three evolutionary operators, i.e. selection, crossover and mutation (Casper et al., Citation2021). Thereinto, the selection operator is based on the fitness value of the individual to carry out a certain probability of survival, and guides the algorithm to find the individual with the best fitness. Crossover and mutation operators are responsible for the communication of information between individuals and the expansion of search space (Shen & Zhu, Citation2019). Because of the mechanism of survival of the fittest, with the increasing generation, the diversity of the population would be reduced, so the algorithm tends to fall into the local optima (Zhao & Du, Citation2021). In order to reduce the probability of falling into the local optima, this paper proposes an Adaptive Evolutionary Algorithm(AEA), which first utilises the regular evolving strategy to execute the searching process, and when the updating of elite solution stagnate, it adaptively activates the exploring strategies. The framework of AEA is shown in Figure .
Figure 6. The framework of AEA.
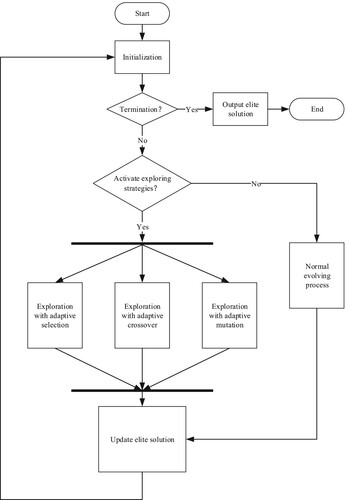
First, the population and the parameters of the algorithm are initialised; Then it is going to determine whether the termination condition has been met. If the iteration reaches the predetermined maximum maxGen, the final result is output. If not, then judge if the elite solution in the population remains unchanged for a certain number of continuous generations. If not, do a normal evolving operation. Otherwise, activate three kinds of searching strategy which focus on the exploration respectively in three groups. In particular, the first group adaptively adjusts the selection pressure, the second group adjusts the crossover probability and the third adjusts the mutation probability on the basis of the normal EA. After the three groups have completed the evolution process of one generation, the optimal solution is merged and then judged again. If the optimal solution remains unchanged, the exploration strategy continues. And if the optimal solution is changed, carry out the normal evolving process.
The exploring strategies and the normal evolving process are all consists of three evolutionary operators, and because the operators are executed in sequence, so the complexity of AEA is governed by the operator with highest time complexity. The selection operator has the highest time complexity , n denotes the size of the population. Therefore, if the algorithm iterates for t times, the time complexity of AEA is
.
4.2. Evolutionary operators based on population diversity metric
4.2.1. Population's diversity metric
During the searching process of EA, keeping the diversity of population can balance the exploration and exploitation of the algorithm. Generally population's diversity can be measured from both genotypes and phenotypes of individuals (Gu & Liu, Citation2021). Since the ontology meta-matching problem solved in this paper is a multi-model problem and one fitness value may correspond to many different sets of parameters, we measure the population diversity in AEA with the fitness values of the individuals. The metric we used is defined as follows Lobo et al. (Citation2007):
(12)
(12) where
,
and
are, respectively, the minimum, average, and maximum fitness values within the population. This metric measures where the average fitness is positioned between the minimum and maximum fitness variations in the current population. When the diversity of population is low, all individuals' fitness values are relatively similar, leading to
,
and
being close to each other, so ψ is close to 0, and vice versa. That is, when the value of the metric ψ is close to zero the population diversity is low, while the population diversity is high when ψ is close to one. This metric occupies any value in the interval
and can effectively estimate the population's convergence situation in terms of fitness values. Therefore, the subsequent adaptive strategies are implemented by measuring this metric.
4.2.2. Selection
According to Darwin's theory of evolution, naturally adaptable individuals are more likely to survive and reproduce than less adaptable individuals. But for the sake that population diversity should not diminish rapidly, individuals with low fitness should also have a certain probability of being retained for reproduction, crossover and mutation (Reza, Citation2019). Having these into account, this paper uses the roulette wheel as selection method where an individual is selected according to a given probability which is related to the fitness value. In detail, the probability is proportional to the ratio of individual's fitness to the sum of all individuals in the population. Furthermore, when the diversity of population decreases and because of this the algorithm falls into local optimal quickly, the selection pressure should be adjusted. To increase the diversity of population, the selection pressure should be reduced, namely it is necessary to improve the probability of selecting individuals with small fitness, but not more than individuals with high fitness. According to the above requirements, a number α, which can be calculated according to formula (Equation13(13)
(13) ), can be added to the fitness of all individuals in the population when executing the roulette wheel selection. As a consequence, the probability of individuals with low fitness being selected will increase compared with before and finally the diversity of the population will increase.
(13)
(13) Where ψ is the population diversity, Υ is a fixed real number. The lower the diversity ψ, the larger the real number α to be added on, and vice versa. According to the mechanism of roulette wheel section, if a real number added to all the individuals' fitness at the same time, the probabilities of the individuals with lower fitness will increase. And as ψ gets bigger the probabilities will increase by a larger amount, namely the selection pressure is reduced, the population gets more diverse. The real number Υ determines the magnitude of the addition ψ, and the final selected value of this parameter is given in the experimental configuration.
4.2.3. Crossover
Crossover refers to the mixing and recombination of genes between two selected individuals (called parents) with a certain crossover probability. Each crossover of two individuals produces two new offspring. In this paper, we use one-cut-point crossover and the cut position is generated randomly. Each parent is divided into two parts, and then the four parts of the parents are reorganised to get two new children. In this paper, if the evolution falls into local optimum, the probability of crossover can be adjusted according to the diversity ψ of the population, and then the diversity of the population can be increased, and the algorithm will have more chance to jump out of local optimum. The formula for adaptively adjusting the crossover probability cp is as follows:
(14)
(14) Where ψ is the population diversity, cp gets larger as ψ decreases. Since that the crossover probability of EA is usually from 0 to 1, so in our work, cp is designed to adaptively varies from 0 to 1 utilising the measured diversity ψ.
4.2.4. Mutation
Mutation operator is to change some genes randomly, which can guarantee the diversity of the population to some extent and enlarge the search range of the algorithm. In our work, for each gene of an individual, we check if the mutation could be applied according to the mutation probability, and if it is, the value of this gene position will be then randomly changed to 0 or 1. The greater the mutation probability mp is, the larger the variation range of the genes in individual is. When the evolution falls into local optimum, the smaller the population diversity is, the higher the mutation probability needs to be changed, so it is more likely to jump out of local optimum. The formula for adaptively adjusting the mutation probability mp is as follows:
(15)
(15) Where ψ is the population diversity, Γ is a fixed real number. mp gets larger as the diversity metric ψ becomes lower. In the traditional EA, the mutation probability is empirically set to a real number from 0 to 0.1. Based on this precedent as well as the experimental test, the final selected value of Γ is shown in the experimental configuration.
5. Experiment
5.1. Experimental configuration
In order to verify the effectiveness of the proposed method, we exploit a testing dataset named benchmark track which is provided by the Ontology Alignment Evaluation Initiative (OAEI)Footnote2 and is popular to be used for testing different ontology matching techniques. The dataset is focused on relevant knowledge in the field of scientific publications and consists of a large number of artificial ontologies derived from the seed ontology. In the dataset, various artificial ontologies need to be matched with the seed ontology, and each testing case consists of a seed ontology and the other ontology built by variating it. All of the testing cases in OAEI benchmark are briefly described in Table .
Table 1. Brief description on OAEI Benchmark.
The similarity measures used in this experiment are SMOA (syntax-based similarity measure), Wu-and-Palmer (semantic-based similarity measure) and structure-based measure, which are presented in Section 2.2. All the results shown in the tables and figures are the average result of 10 independent runs. The parameters of AEA are listed as follows, which are determined empirically to ensure the highest alignment's quality in the matching tasks.
maximum generation: 1000;
population size: 60;
number of stagnant generation: 10;
real number Υ for calculating add: 10;
real number Γ for calculating mp: 0.1.
5.2. Experimental results and analysis
In this paper, we conduct three comparative experiments. Firstly, to verify the effectiveness of the proposed heuristic evaluating metric, we compare the results obtained by using f−measure and as the evaluating metric respectively; Secondly, we check the effectiveness of adaptive evolving strategies by comparing AEA with the traditional EA and with its variational versions; Finally, we compare AEA with state-of-the-art ontology matching systems.
5.2.1. Testing on the effectiveness of heuristic evaluating metric
In order to verify the effectiveness of the proposed heuristic evaluating metric, we compare AEA with heuristic evaluating metric and AEA with f−measure. Table shows the experimental results, where FM stands for f−measure and stands for
.
Table 2. Comparison between heuristic evaluating metric and f-measure.
As can be seen from Table , for most of the testing cases (89 of 108), their f−measure values are the same. With regard to the resting 19 testing cases, the differences are less than 0.08. To sum up, without the utilisation of reference alignment, quality reduction of the obtained alignment just occurs in a small portion of testing cases, which shows the effectiveness of the proposed heuristic evaluating metrics.
5.2.2. Testing on the effectiveness of adaptive evolving strategy
To check the effectiveness of adaptive evolving strategies, we compare the performance of AEA-based matching technique with the EA-based matching technique which uses the same parameters as those in AEA, and the experimental results are shown in Figure . We further compare AEA with its variations, whose results are shown in Figures and .
Figure 7. Comparison between AEA and EA with different crossover and mutation rates.
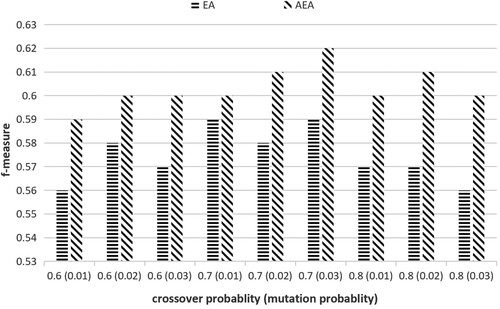
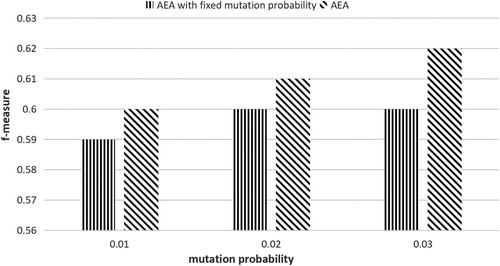
Figure 8. Comparison between AEA and its variations (i.e. AEAs with fixed crossover probabilities).
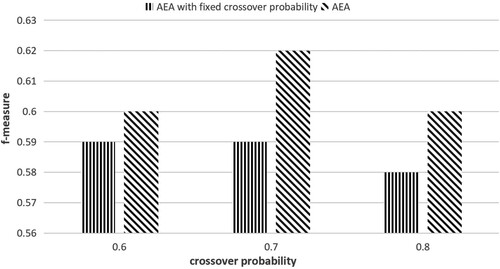
Figure 9. Comparison between AEA and its variations (i.e. AEAs with fixed mutation probabilities).
We show the mean f-measure of AEA and EA in Figure , where the vertical axis is the f-measure value, and the horizontal axis is the crossover and mutation probabilities. If the crossover probability is too large, it would yield the algorithm's premature convergence. If the crossover rate is too small, the algorithm would be difficult to converge. So, three representative crossover rates are selected in this paper, i.e. 0.6, 0.7, 0.8. Similarly, the value of mutation probability should also be in an appropriate range. If it is too large, the algorithm tends to search randomly. If too small, the algorithm's global search ability is insufficient. Therefore, 0.01, 0.02 and 0.03 are selected as three crossover rates. Here, three representative values of crossover probability and mutation probability are selected, respectively, and on this basis we get nine groups of representative configurations. In Figure , 0.6, 0.7 and 0.8 are the crossover probabilities, and 0.01, 0.02 and 0.03 in brackets are the mutation probabilities. As shown in this figure, the alignments determined by AEA are significantly better than EA. Particularly, for different configurations of parameters, AEA's mean f-measure values are all higher than those of EA. The highest mean f-measure value of EA is 0.59, while that of AEA is 0.62.
Additionally, Figures and compares AEA with its variations. The first version of AEA's variation fixes the crossover probability of AEA, and the second fixes the mutation probability. As can be seen from these two figures, no matter which adaptive parameter is fixed, the mean f-measure becomes lower, which means the quality of the obtained alignment is reduced.
To sum up, the proposed adaptive evolving strategies is able to effectively discover the phenomenon of premature convergence and help the algorithm jump out of local optimum, and thus it is able to effectively improve the alignment's quality.
5.2.3. Comparison with state-of-the-art ontology matching systems
In the last experiment, we compare among AEA and the state-of-the-art ontology matching systems which take part in the OAEI. According to the distinguishing ontology heterogeneities, all of the testing cases OAEI participants have tested can be divided into four groups. The mean f-measure values of the four groups as well as the average of the entire testing cases are listed in Table .
Table 3. Comparison with state-of-the-art ontology matching systems.
As can be seen from the table, the average f−measure value of the entire testing cases obtained by AEA-based ontology matching system is higher than the other methods, which reflects that the quality of the alignments obtained by our matching system is superior to that of other matching systems in general. Specifically, our results have the greatest improvement on the testing cases of the second group, while in the third group the extent of promotion is the lowest. This is because of the different heterogeneities. For 201–202-8, the testing ontologies have different lexical and linguistic but same structure features with source ontology, but our matching system can measure the similarity of text description for the entity and determine the corresponding from the structure feature, so the correct mappings can be found more fully compared to other systems. While as to 221–247, the ontologies have different structures but same lexical and linguistic features with source ontology. Due to the extensive and mature application of syntax-based and semantic-based similarity measures, most matching systems work well on this group. Ontologies in the 248–266 have different lexical, linguistic and structure features with source ontology, as a result, the quality of the final alignment is lower than that of other testing cases. The average f-measure value for this group is raised by our system to more than 0.5, and to improve the overall quality in the future work, the optimisation of the matching quality on this group is critical.
6. Conclusion and future work
To effectively matching the ontologies, in this paper, a heuristic evaluating metric on the ontology alignment is proposed, and based on it, an optimisation model on the ontology meta-matching problem is developed. Subsequently, an AEA-based ontology matching technique is proposed to address the ontology meta-matching problem. Finally, we use OAEI's benchmark to test the performance of our proposal. The effectiveness of the heuristic evaluating metric proposed in this paper is proved by a comparison with reference alignment based evaluation metric. The comparing results with EA-based ontology matching technique show that AEA is able to effectively avoid the algorithm falls into local optima. And the comparison among AEA-based ontology matching technique and the state-of-the-art ontology matching systems demonstrates that our method can effectively determine high-quality alignments. To sum up, with the development and utilisation of ontology meta-matching system based on AEA proposed in this paper to determine the correspondences between heterogeneous ontologies, it cannot only be independent of the reference alignments provided by experts, but also obtain ontology alignments with higher qualities than the traditional EA-based and some advanced matching systems.
The method proposed in this paper still has some limitations and shortcomings. Firstly, our matching system uses several most commonly used similarity measures, which may not be applicable to ontology matching problems in other professional fields, such as biomedical and anatomy. Secondly, the system's design and experiment in this paper are both based on small and medium scale ontology matching problems. For large-scale ontology matching problems, our matching system may have problems of time consuming and poor alignment's quality. In the future, we are interested in how to choose more suitable similarity measures for ontology matching in different domains. Furthermore, the large-scale ontology matching problem (Xue & Zhang, Citation2021) is also a significant subject to be studied.
Disclosure statement
No potential conflict of interest was reported by the authors.
Additional information
Funding
Notes
References
- Acampora, G. G., & Vitiello, A. (2020). A study on local search meta-heuristics for ontology alignment. Computational Intelligence for Semantic Knowledge Management, 837, 53–70. https://doi.org/10.1007/978-3-030-23760-8
- Benkhelifa, R., Biskri, I., & Ameur, E. (2020). User content categorisation model, a generic model that combines text mining and semantic models. International Journal of Computational Science and Engineering, 21(4), 536. https://doi.org/10.1504/IJCSE.2020.106867
- Casper, H., Bram, T. H., & Hans, P. (2021). Evolutionary computation for bottom-up hypothesis generation on emotion and communication. Connection Science, 33(2), 296–320. https://doi.org/10.1080/09540091.2020.1814203
- Deb, K., & John, H. (1975). Adaptation in natural and artificial systems. An introductory analysis with applications to biology, control, and artificial intelligence. University of Michigan Press.
- Gu, F., & Liu, H. (2021). A rough-to-fine evolutionary multiobjective optimization algorithm. IEEE Transactions on Cybernetics. https://doi.org/10.1109/TCYB.2021.3081357
- Hancer, E. (2019). Fuzzy kernel feature selection with multi-objective differential evolution algorithm. Connection Science, 31(4), 323–341. https://doi.org/10.1080/09540091.2019.1639624
- Lobo, F. G., Lima, F., & Michalewicz, Z. (2007). Parameter setting in evolutionary algorithms (pp. 47–76). Springer Berlin Heidelberg.
- Lv, Q., & Jiang, C. (2020, December). Solving ontology meta-matching problem through an evolutionary algorithm with approximate evaluation indicators and adaptive selection pressure. IEEE Access, 99(Dec.), 1–1. https://doi.org/10.1109/Access.6287639
- Martinez-Gil, J., Alba, E., & Aldana-Montes, J. F. (2008). Optimizing ontology alignments by using genetic algorithms. In International Conference on Nature Inspired Reasoning for the Semantic Web (pp. 36–55).
- Martinez-Gil, J., & Aldana-Montes, J. F. (2011). Evaluation of two heuristic approaches to solve the ontology meta-matching problem. Knowledge & Information Systems, 26(2), 225–247. https://doi.org/10.1007/s10115-009-0277-0
- Miller, G. A. (1995). WordNet: A lexical database for English. Communications of the Acm, 38(11), 39–41. https://doi.org/10.1145/219717.219748
- Ngo, D. H., Bellahsene, Z., & Todorov, K. (2013). Opening the black box of ontology matching. In Extended Semantic Web Conference (pp. 16–30).
- Rahm, E., & Bernstein, P. A. (2001). A survey of approaches to automatic schema matching. The VLDB Journal, 10(4), 334–350. https://doi.org/10.1007/s007780100057
- Reza, Z. (2019). Combining evolutionary computation with the variable neighbourhood search in creating an artificial music composer. Connection Science, 31(3), 267–293. https://doi.org/10.1080/09540091.2019.1603200
- Shen, D., & Zhu, L. (2019). Differential evolution with spatially neighbourhood best search in dynamic environment. International Journal of Computational Science and Engineering, 19(1), 104. https://doi.org/10.1504/IJCSE.2019.099644
- Stoilos, G., Stamou, G. B., & Kollias, S. D. (2005, November). A string metric for ontology alignment. In International Semantic Web Conference.
- Vitiello, A., Persiano, G., Loia, V., & Acampora, G. (2013). Memetic algorithms for ontology alignment. Universit degli Studi di Salerno.
- Winkler, W. E. (1999). The state of record linkage and current research problems.
- Wu, Z. (1995). Verb semantics and lexical selection (Tech. Rep.).
- Xue, X. (2020). A Compact Firefly Algorithm for Matching Biomedical Ontologies, Knowledge and Information Systems. Knowledge and Information Systems, 62(7), 2855–2871. https://doi.org/10.1007/s10115-020-01443-6
- Xue, X., & Chen, J. (2019). Using compact evolutionary tabu search algorithm for matching sensor ontologies. Swarm and Evolutionary Computation, 48(6), 25–30. https://doi.org/10.1016/j.swevo.2019.03.007
- Xue, X., & Chen, J. (2021, September). Matching biomedical ontologies through compact differential evolution algorithm with compact adaption schemes on control parameters. Neurocomputing, 458, 526–534. https://doi.org/10.1016/j.neucom.2020.03.122
- Xue, X., & Wang, Y. (2015, June). Optimizing ontology alignments through a memetic algorithm using both MatchFmeasure and unanimous improvement ratio. Artificial Intelligence, 223(Jun.), 65–81. https://doi.org/10.1016/j.artint.2015.03.001
- Xue, X., & Wu, X. (2021). Integrating sensor ontologies with global and local alignment extractions. Wireless Communications & Mobile Computing. https://doi.org/10.1155/2021/6625184
- Xue, X., & Yang, C. (2021). Optimizing ontology alignment through linkage learning on entity correspondences. Complexity. https://doi.org/10.1155/2021/5574732
- Xue, X., & Yao, X. (2018, November). Interactive ontology matching based on partial reference alignment. Applied Soft Computing, 72(4), 355–370. https://doi.org/10.1016/j.asoc.2018.08.003
- Xue, X., & Zhang, J. (2021). Matching large-scale biomedical ontologies with central concept based partitioning algorithm and adaptive compact evolutionary algorithm. Applied Soft Computing, 106(6), 1–11. https://doi.org/10.1016/j.asoc.2021.107343
- Zhang, R., Cheng, J., Li, F., Lu, W., & Zhang, X. (2020). A deep neural architecture for sentence semantic matching. International Journal of Computational Science and Engineering, 21(4), 574. https://doi.org/10.1504/IJCSE.2020.106870
- Zhao, F., & Du, S. (2021). A hybrid self-adaptive invasive weed algorithm with differential evolution. Connection Science, 33(4), 929–953. https://doi.org/10.1080/09540091.2021.1917517