
 ?Mathematical formulae have been encoded as MathML and are displayed in this HTML version using MathJax in order to improve their display. Uncheck the box to turn MathJax off. This feature requires Javascript. Click on a formula to zoom.
Abstract
When the ambient temperature is low, a large amount of water mist and dust will inevitably appear around the zinc flotation cell, forming haze, which seriously affects the extraction of flotation froth image features. General defogging methods of natural image are difficult to obtain satisfactory results for such industrial haze image. Therefore, we propose a real-time defogging method based on ASM-VoFD (Atmospheric Scattering Model and the Variable-order Fractional Differential). First, the dark pixel ratio is used to detect fog in froth image, which solves the redundant calculation caused by unnecessary defogging operations. Second, the linear transformation of the atmospheric scattering model is used to calculate the initial transmission map, and the gaussian filter is used to optimize the initial transmittance, and the haze-free image is restored with atmospheric light estimation. Finally, a variable order fractional differential operator is used to enhance the edges and texture details of the restored froth image, which solves the problems of blurred edges and low contrast. The experiments show that the algorithm has a good defogging effect on the industrial images, enhance the edges of the image, and can be effectively implemented in O(N) time to meet the application requirements of real-time flotation monitoring.
1. Introduction
Froth flotation is a beneficiation method to separate minerals according to the physical and chemical properties of the mineral surface. The main process of froth flotation is that bubbles rise in the pulp with selective but adhered mineral particles at the gas–liquid interface, and then the froth formed on the pulp surface is scraped to achieve the purpose of beneficiation. The surface visual characteristics of these froths (such as froth size, colour, texture, and flow rate) are closely related to process indicators, working conditions, and operating variables. These characteristics can be used as an important basis for judging the effect of mineral separation operations. The accurate extraction of froth image features is the premise of the machine vision flotation production process (Aldrich et al., Citation2010). However, the complex flotation industry has a harsh environment with a large amount of dust and fog, as well as uneven illumination, resulting in serious pollution in images collected by surveillance video (Jinping et al., Citation2010). In particular, when the temperature in the plant is low (below 5C), The water mist produced by the mineral particles and water droplets splashed during the froth defoaming is very large. This condition causes a thick water mist that covers the entire flotation cell. The existence of these water mists seriously affects the accurate extraction of bubble characteristics. Therefore, dehazing preprocessing on the froth image is an important task in obtaining froth parameters.
The flotation state monitoring system based on machine vision (as shown in Figure (a)) not only obtains traditional process parameters, but also collects a large amount of visual image information related to working conditions. Then, these parameters are fused with characteristic information to realise the intelligent identification and accurate trend forecast of multi-modal conditions in the flotation process. The collection and processing of data is very important to the analysis results (Liang et al., Citation2019). Long-term practice observation shows that the flotation plant suffers from insufficient light at night and a lot of floating dust, especially when the temperature is low, the haze will appear, as shown in Figure (b). Different flotation tanks (zinc-roughing, -refining, and -scavenging) carried different zinc content of the froth, and the froth showed different grey-brown. Figures (c), (d) and (e) are the foggy froth images in the three flotation tanks, respectively. In particular, the quality of fogged froth images (as shown in Figure (e)) taken in dark weather or low light at night is very low, which urgently requires real-time and effective defogging algorithms to improve the clarity of froth images.
Figure 1. (a) Flotation site industrial camera; (b) flotation plant covered by mist; (c) hazy image of the zinc-roughing tank; (d) hazy image of the zinc-refining tank; (e) hazy image of the zinc-scavenging tank.
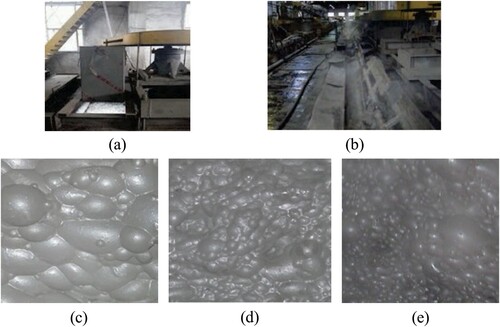
Figure shows the clear images, hazy images and the corresponding histogram in the zinc-roughing tank. Figure shows that the grey value range of the foggy froth image is greatly reduced, indicating a single peak state. The reason is that a layer of haze is added to the bubble map, and the image is off-white as a whole. Compared with natural images, froth images have the following characteristics:
In the froth image, only a small amount of black and dark small pieces are seen, especially the high mineral content carried by the zinc-refining froth, which is not easy to break, and finding pixels with a grey value less than 50 is difficult. The defogging algorithm based on dark channel prior (He et al., Citation2010; C. Li et al., Citation2020; J. B. Wang et al., Citation2015; Wei et al., Citation2020) has a very good effect in natural images, but it is not suitable for flotation froth image defogging, which will result in high estimated transmittance and the recovered image cannot truly reflect the froth characteristics.
Due to the fact that the flotation froth is sporty during the shooting process, it is impossible to find the corresponding clear image from the collected blurred image. This limits the application of some advanced and effective defogging algorithms. For example, the method of estimating scene depth information by obtaining multiple images of the same scene (Narasimhan & Nayar, Citation2000, Citation2002), and the supervised deep learning network method (Cai et al., Citation2016; B. Li et al., Citation2017).
The distance between the froth surface and the industrial camera is relatively stable, that is, the depth of field of the froth image is basically the same. Except for the reflected light-bright spots on the top of the froth, there is no large colour jump at the edges between the foams, which is more conducive to the restoration of hazy images based on the linear transformation of the atmospheric scattering model. For example, the linear transformation method of the atmospheric scattering model can achieve a better defogging effect when the depth of the field is basically the same (Alajarmeh et al., Citation2018; Ge et al., Citation2015; Ju et al., Citation2017; W. Wang et al., Citation2017). The key is that it has a great advantage in time efficiency.
The light source when collecting the froth image is mainly the high-brightness incandescent set in the installation box of the industrial camera. Auxiliary light sources are from atmospheric light and factory lighting. However, froth images taken in dark weather and night environment are low-light images with unclear edges, so many good defogging algorithms cannot achieve the ideal defogging effect.
The purpose of this study is to develop a suitable defogging method of flotation froth image, improve the accuracy of feature extraction of flotation froth image, and meet the application requirements of real-time monitoring based on machine vision. In order to achieve this goal, we first analyse the different characteristics between clear froth image and fogged image, and identify foggy froth image with average brightness ratio and dark pixel ratio. Secondly, we estimate the transmission image by the prior information of local image energy of gradient (EOG) and the linear transformation of atmospheric scattering model (ASM), optimise the initial transmittance by Gaussian filtering, and combine the estimated atmospheric light value to reconstruct the clear image. Finally, for the edge blur of the restored low-light image at the froth-highlights, we use the variational fractional differential operator to enhance the edges, texture details and brightness to obtain the optimal defogging performance.
The main contributions of this research work are as follows:
Before the image defogs, we detect the froth image by extracting a dark pixel ratio, which can effectively identify the foggy image and distinguish it from other froth blur images (motion blur and defocus blur). This provides a reference for the recognition of blurred images in the flotation industry.
In the defogging algorithm, the maximisation of the local energy gradient function is adopted as a prior information, which is easy to realise and independent of colour information. Therefore, such information is more suitable for the defogging of the zinc flotation froth image (monochrome colour, greyish brown).
Through qualitative and quantitative analysis in the experiment, this method is superior to the five advanced defogging methods in image recovery performance and time efficiency. At the same time, edge enhancement is performed on the defogging results of low-light fogged images, which improves the applicability of the algorithm.
2. Related work
At present, dehazing algorithms are mainly divided into two categories: image enhancement and image restoration. The image enhancement method does not consider the causes of image degradation and has wide applicability. This method can effectively improve the contrast of the foggy image, enhance the image details, and improve the visual effect of the image, but it may cause some loss of information in the prominent part. Typical methods include histogram equalisation (Stark, Citation2000), retinex (Zeng et al., Citation2014; Zhou & Zhou, Citation2013), the wavelet transform (Khmag et al., Citation2018), and contrast enhancement algorithms (Kim et al., Citation2011). The defogging method based on the physical model mainly establishes a degradation model by analysing the principle of light scattering by the atmosphere and uses the model to obtain a clear fog-free image. This kind of method has strong pertinence and natural dehazing and generally involves no information loss. The key point of processing is the estimation of the parameters in the model. McCartney (Citation1976) first used this principle (Mie Scattering Theory) to establish an atmospheric scattering model in 1977. In 1998, Oakley and Satherley (Citation1998) began to use The Mie scattering theory to carry out some restoration studies on images taken under severe weather. Subsequently, model-based defogging methods have attracted more and more attention and have now become a research hotspot in the field of image processing. Fattal (Citation2008) estimated the reflectivity of the scene and the transmittance of the medium under the assumption that the transmittance and the surface shadow were locally unrelated. This method has a good effect on the processing of light haze images, but may fail for images with heavy haze. Tarel and Hautiere (Citation2009) introduced a method based on contrast enhancement to eliminate haze. The algorithm is simple and efficient, but the parameters in the algorithm cannot be adjusted adaptively. The best and well-known algorithm is single image dehazing based on dark channel prior theory proposed by He et al. (Citation2010). However, the optimisation process takes more time in estimating the transmittance map. Subsequently, extensive studies have been conducted on this theory (Fujita & Fukushima, Citation2017; Khmag et al., Citation2018). Kim et al. (Citation2013) enhanced the image by maximising the contrast block by block, minimised the information loss caused by pixel truncation, and minimised the colour distortion of the restored image as much as possible. W. Wang et al. (Citation2017) proposed a fast single-image haze removal method based on linear transformation. The algorithm is effective in removing fog in images with little change in depth of field. But in the low light fog image, the edge of the restored image is blurred. Wu et al. (Citation2021) proposed a method of atmospheric scattering linear transformation based on local image entropy maximisation prior to estimate the transmittance of image blocks and optimised the transmittance by guided filtering. The algorithm has good defogging performance and high efficiency, which can meet the needs of industrial applications. The algorithm (Kim et al., Citation2013; Tarel & Hautiere, Citation2009; W. Wang et al., Citation2017; Wu et al., Citation2021) uses some prior information to transform the atmospheric scattering model, which can obtain the estimation of transmittance. These algorithms are suitable for foggy images with little change in depth of field and have high efficiency.
With the development of neural networks and deep learning, researchers have begun to replace traditional image dehazing methods with methods based on deep learning. Tang et al. (Citation2014) proposed a novel transmission estimation method through a learning-based method; the researchers analysed the relevant characteristics of multi-scale haze in a regression framework based on random forest, but this feature fusion method relies heavily on dark channel features. Cai et al. (Citation2016) proposed an end-to-end training model that used neural networks to estimate in the atmospheric degradation model. The model inputs the hazy map, outputs the transmission rate
map, and then uses the atmospheric degradation model to restore the haze-free image. B. Li et al. (Citation2017) proposed an image defogging model established by a convolutional neural network (CNN), called all-in-one defogging network (AOD-net). AOD net does not estimate the transfer rate and atmospheric light as previous models do, but directly generates a de-fogging image. These learning-based algorithms require many haze-free and hazy images as training data. If the training sample is not large enough, then it cannot display the true depth information of the image, especially the edge area. In the process of capturing the flotation froth image, the foggy image and the corresponding non-fog image cannot be obtained due to the froth movement and the fog mask. At the same time, the change of illumination makes the extracted fogged characteristics also affect the recovery result.
3. Dehazing algorithm
The method of removing the haze in the flotation froth monitoring video consists of the following steps: (1) foggy image recognition (dark pixel ratio features); (2) defogging method based on linear transformation of the atmospheric scattering model; (3) image edge enhancement of the restoration result. First, the detailed content of the foggy image recognition algorithm in the first part is described.
3.1. Foggy image recognition
In the haze image, the human eye's recognition ability is lower than that of normal weather, and it is more sensitive to the lightness information than the colour information of the image. Therefore, the dark pixel ratio is selected as the identified features of the foggy image. Figure shows a flowchart of the froth foggy image recognition.
Figure 2. The flowchart of froth foggy image recognition.
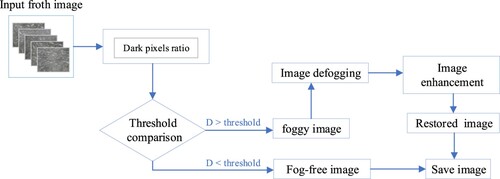
Figure 3. Dark pixel ratio of blur and clear image: (a) clear image; (b) zinc-roughing foggy image; (c) motion blur image; (d) defocus blur image.
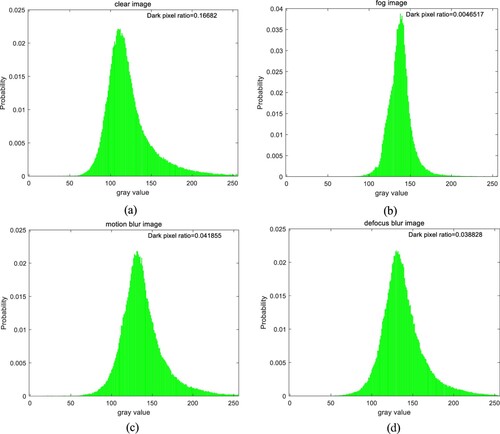
Under the same illumination conditions, the lightness of clear froth image and foggy image in the same flotation cell is very different. This is mainly reflected in the histogram of its lightness component. The histogram of the clear image is evenly distributed and smooth, while the histogram of the foggy froth image becomes narrower and thinner and moves to the right as a whole, as shown in Figure . Therefore, compared with clear images, the lightness value of dark pixels increases in foggy images, resulting in a significant reduction in the dark pixel ratio.
Perform histogram statistics for lightness component image. Dark pixel ratio D is denoted as
(1)
(1)
where
represents the histogram value with a grey level of k. Dark pixel
refers to the corresponding pixel to the grey value range [0,100]. The statistical result of the dark pixels
is
.
We choose the froth image of the zinc-roughing flotation tank for comparative analysis. Experimental results are shown in Figure . The dark pixel ratio of clear images is larger than that of motion blur images and defocus blur images, while the dark pixel ratio of foggy images is much smaller than that of the first three images, almost 10 times the difference. Thus, this dark pixel ratio method can be used to classify foggy froth images.
3.2. Zinc flotation froth image defogging
3.2.1. Atmospheric scattering model of flotation industry site
The atmospheric scattering models are as follows:
(2)
(2)
where I is the intensity of the haze image observed by the imaging device, J is the intensity of the haze-free image to be restored, A is the atmospheric light, and t is the transmittance that reflects the ability of light to penetrate the haze. In Equation (Equation2
(2)
(2) ),
represents the part of the reflected light from the target that enters the camera after atmospheric scattering and attenuation; this part decays exponentially as the depth of the scene increases.
is the part of the camera that enters the camera after the atmospheric light is scattered; this part increases with the depth of the scene, which causes blurring and colour shift distortion. Parameters
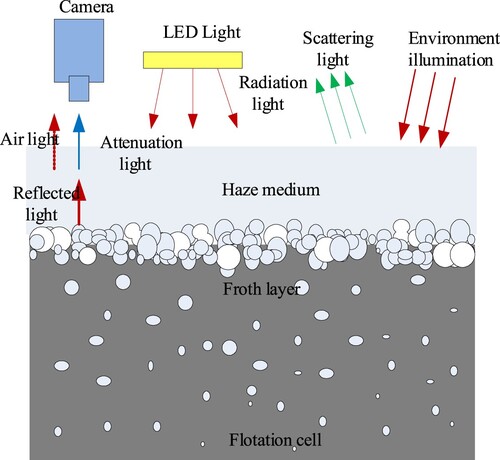
and A have to be estimated to restore the haze-free image. The solution to this problem is ill-conditioned. The atmospheric scattering model of the flotation froth foggy image is presented in Figure .
Figure 4. Atmospheric scattering model of flotation foam atomisation image.
The clear processing of the flotation froth foggy image requires strong prior information or a reasonable structure to solve the model. The algorithm proposed in this chapter aims to perform linear transformation on the scattering model, and use the local image EOG and the fidelity for the constraint to restore the haze-free froth image. This method not only obtains a good dehazing effect but also retains the textural details of the image. Furthermore, the transmittance is quickly optimised, thereby meeting real-time industry requirements.
3.2.2. Estimation of atmospheric light
The accurate estimation of atmospheric light A value in the atmospheric scattering model is directly related to the accurate calculation of transmittance, and ultimately affects the colour and brightness of the restored image. Generally, in the dehazing of natural images, if the atmospheric light value A is extremely large, the overall image is darker and the visibility is low. When the atmospheric light value A is low, some parts of the image (such as bright areas, light edges, and white objects) have obvious colour distortion.
According to Figure , the main light source of the froth image video comes from the light-emitting diode installed at the top of the box. Due to the physical and characteristics of the froth, the froth that adheres to the mineral particles automatically burst after a certain period under the action of gravity. As a result, the mineral content on the top of the froth slowly decreases until only a water film is found at the end, which bursts immediately. The reflection of the light source at the water-air interface is total reflection, so in the froth image we obtain, bright spots are seen at the top of the froth. In the non-fog state, the brightness of the froth highlights is extremely high and is basically pure white. In the foggy state, the froth highlights are shrouded in haze, which is grey and foggy. In the image of the flotation froth with fog, the bright spots on the froth reflect the atmospheric light value of the corresponding area of the image. In this section, the froth image is first greyed out, and then the threshold is set to extract the highlight pixels of the froth image. The average value of these pixels is taken as the estimated result of the atmospheric light A value. Many experiments have proved that the estimated results of atmospheric light A value in different flotation cell froths are different. The atmospheric light A of the zinc-roughing tank is approximately 220, the zinc-refining tank is approximately 175, and the zinc-scavenging tank is approximately 190. The result can effectively reflect the real atmospheric light conditions and restore the texture details of the fog-free image.
3.2.3. Estimation of transmission map
When atmospheric light A is known, the accurate estimation of the transmittance determines the effect of image dehazing. This study proposes that in the real-time dehazing of a linear transformation of the atmospheric scattering model, the local image EOG and fidelity maximisation prior is used in estimating the transmission map.
(a) Linear transformation of atmospheric scattering model
According to Equation (Equation2(2)
(2) ), the mathematical model of a single dehazing image
can be derived as follows:
(3)
(3)
Based on the assumption that in a small local image, the depth of the image is the same (in fact, the foam layer formed by the bubbles floating up to the surface of the slurry is basically the same as the depth of the camera above the flotation tank), which means the transmission rate
of each small block is a constant. Then, according to Equation (Equation2
(2)
(2) ), each pixel p in the image block
can be expressed as
(4)
(4)
where a is the slope and b is the intercept. They are expressed as
(5)
(5)
Equation (Equation4
(4)
(4) ) shows that in a partial image block, a linear relationship exists between the haze-containing image
and the clear haze-free image
. The slope a and intercept b change with the change of the transmission rate t.
(b) The maximisation prior of EOG–fidelity objective function
The clarity of flotation froth foggy image was evaluated by the energy of the gradient function. This function takes the squares sum of the squares of the difference between the grey values of adjacent pixels in the x and y directions as the gradient value of each pixel, and then accumulates the gradient values of all pixels as an evaluation of image sharpness. For the image , the definition of the energy gradient function is expressed as follows:
(6)
(6)
In this forum:
(7a)
(7a)
(7b)
(7b)
The symbol ⊗ represents the spatial filtering of the image under the mask template. The size of
and
is
(8)
(8)
The pixel neighbourhood corresponding to the mask template is
(9)
(9)
Therefore, the expression of the image energy of the gradient function is
(10)
(10)
Equation (Equation2
(2)
(2) ) shows that if the value of the transmittance
is small, then the value of
may appear more than the upper limit of grey value 255. If the value of the transmittance
is large, the value of
less than the lower limit of the grey value 0. In this case, the grey value beyond the range of
is automatically cropped, which causes colour distortion in the restored fog-free image. Therefore, this study uses the local image energy gradient maximisation prior as the constraint to estimate the optimal transmittance
, and also designs a subfunction (Fidelity function), that is, the image colour metric sub-function composed of information fidelity, such as
(11)
(11)
where p represents a certain pixel in the restored image, N is the total number of pixels, and
represents the ratio of pixels in the range of
each colour channel of the restored haze-free image J when the transmittance
is known. When the pixel ratio to be cropped is smaller, the value of the information fidelity function
is larger. The maximum value of this function can be used to control the pixel ratio that is cut off, which maximises the EOG of the local image to the greatest extent and makes the restored image clearer while retaining its original colour.
The proposed algorithm designs an objective function based on the energy of the gradient fidelity to constrain the estimated optimal transmittance as follows:
(12)
(12)
where
represents the image energy gradient function, and
represents the image colour metric subfunction. The optimal estimated value of the transmittance t based on the energy gradient-fidelity objective function proposed in this paper is
(13)
(13)
where
,
, and
represent when the transmittance t is known, the EOG–fidelity of the restored haze-free image J function value, the EOG function value, and the fidelity function value.
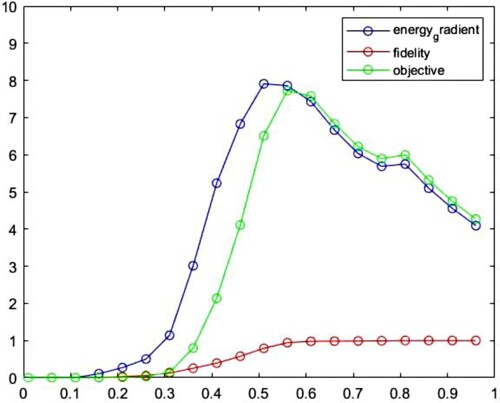
As shown in Figure , the lines with the highest and lowest peak values, respectively, represent the changes in local energy of gradient and fidelity, and the middle line represents the changes in the objective function . In this example, when the transmittance t is less than 0.3, the objective function value is relatively low, and the fidelity is much less than 1, indicating that within this range, few points exist in the image with pixel values between 0 and 255, which does not meet our needs for results. When the transmittance t exceeds 0.6, the fidelity is close to 1, which means that almost no pixels are cut off. At the same time, when the transmittance t approaches 1,
gradually decreases. Therefore, the optimal transmittance should be determined between 0.5 and 0.6 to ensure that the energy gradient-fidelity objective function reaches the maximum value.
Figure 5. The objective function for finding the optimal transmission value.
Through the aforementioned method, the transmittance of a small image can be estimated. To obtain the best transmittance, we divide the image into ,
,
, and other small blocks. Then, we use the step size as the 1/2 sliding window of the block size to estimate, which can reduce the degree of block artefacts in the restored image to a certain extent. The preceding steps are repeated to obtain the initial estimated transmission map.
3.2.4. Refining the transmission map
The transmission map obtained by the method in Section 3.2.3 is pixel-based, and the transmission rate is the same in a small area. Theoretically, the transmission rate of each pixel is different in the image, especially at the image edge or where the depth of field jumps. At this time, the restored image may have halo or block artefacts. To solve this problem, we use Gaussian blur filtering to refine the block-based transmission mapping, reduce block artefacts, and enhance image details. The Gaussian blur method uses the weighted average method. At the image scale of , the Gaussian function represented by pixel
is as follows:
(14)
(14)
The larger the standard deviation
of the normal distribution, the more blurred is the image. The distribution map after Gaussian filtering is obtained after convolving two non-zero matrices:
(15)
(15)
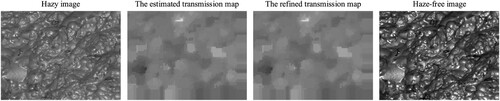
By comparing the results of Gaussian, average, anisotropic, median, and guided filtering on the image processing results, we find that the effect of Gaussian filter processing is better than that of mean filter and median filter processing, and the effect of guided filtering is best. Considering the processing time, Gaussian filtering and average filtering take less time. Figure shows the process of estimating the transmission rate, refining the transmission map, and generating a fog-free image. We analyse the impact of various filtering algorithms on the results in Section 4.2.
Figure 6. Calculate the transmission map and dehaze processing effect map for the foggy image.
3.3. Recovered image enhancement based on variable-order fractional differential operator
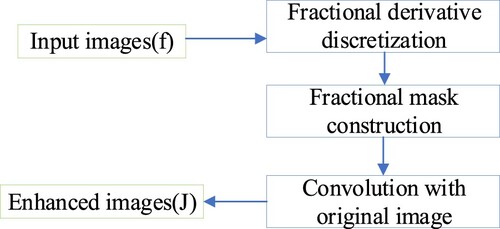
In order to solve the problems of unclear edge and low contrast of the recovered image, the variable-order fractional differential operator (Xu et al., Citation2015) is used to enhance the image. The flow chart of this method is shown in Figure .
Figure 7. The flow chart of froth images enhancement.
In this paper, the Riemann–Liouville fractional derivative is adopted and its definition is as follows:
(16)
(16)
where the
represents the Euler's gamma function. Then the expressions of right and left R-L fractional derivatives are shown below, respectively:
(17)
(17)
(18)
(18)
where
. And the mathematical expression for the discretisation of R-L fractional derivative at point
is shown below:
(19)
(19)
where the v is the order of the fractional derivative. And the h represents the step size, the
is the p-order discrete coefficient of the R-L fractional derivative. In addition, we use the fractional backward difference formula of order p (FBDF-p) to generate discretisation coefficients. The discretisation coefficient
can be obtained by the following recurrence formulas:
(20)
(20)
(21)
(21)
where the discrete order p satisfies
.
In this paper, a template structure based on eight symmetric directions is used to construct a variable-order fractional differential mask, as shown in Figure .
Figure 8. Fractional differential mask construction.
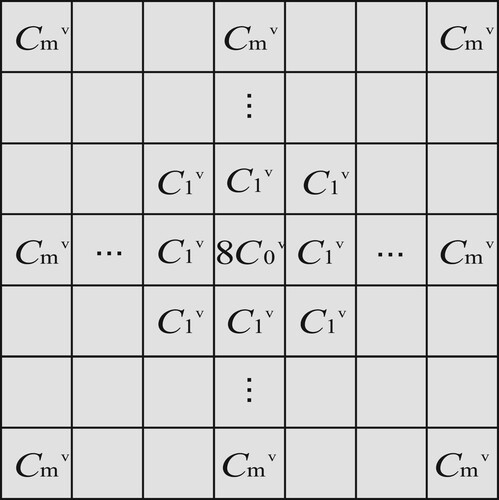
The size of the template is , and all elements in the template are normalised, as shown below:
(22)
(22)
Then, the final enhanced froth images can be obtained through convolution based on the variable-order fractional-order template M, which can be expressed by the following formula:
(23)
(23)
The enhanced image J can be finally obtained by sliding the template size window from left to right and from top to bottom to conduct convolution operation on the froth image.
4. Experimental analysis
Experiments were carried out on flotation froth images based on the above proposed defogging and enhancement algorithm, which proved the effectiveness of the proposed method for the clearness of flotation froth foggy images.
4.1. Date sets
The visual data of the froth layer on the pulp in the flotation tank were collected by the industrial camera installed in the flotation field, and the foggy froth image data set was obtained for the defogging pretreatment. The camera is installed above the flotation tank, as shown in Figure (a). In the zinc flotation process, the life of froth from generation to deformation and then to rupture is a complex physical and chemical process. At the same time, the whole froth layer on the pulp has dynamic changes such as displacement and collapse due to the surge of pulp and scraping-bubble. Therefore, even for flotation froth manufactured in the laboratory, the corresponding clear image of the foggy image cannot be obtained with the artificial addition of fog. In the experiment, we captured froth images of different illumination conditions, different flotation tanks and different haze levels in the flotation field, and established two image data sets named Image_nor (normal illumination) and Image_low (low illumination) (90 images, respectively). Each data set contains three groups of froth foggy images (30 images per tank) from different flotation tanks (zinc-refining tank, zinc-roughing tank and zinc-scavenging tank), among which the images in each group have fog images of light, medium and heavy fog levels (10 images per stage).
4.2. Qualitative validation experiments
In this part, we will verify the performance of the algorithm proposed in this paper from the qualitative aspect, mainly from fog concentration, lighting conditions, transmission rate optimisation, fog removal algorithm to verify the effect of image restoration.
4.2.1. Influence of various filtering methods on dehazing effect
In refining the transmission map, various filtering methods have different processing effects. We, respectively, perform Gaussian, average, guided, bilateral (Liang et al., Citation2021) and median filtering on the initial transmission map of the hazy image of the zinc flotation cell. The processing effects of filtering are shown in Figure , where the VER value is the image quality evaluation standard without reference (see Section 4.3 for specific calculation), and the TIME value is the execution time of optimised transmission graph.
Figure 9. Comparison of different filtering dehazing effects.
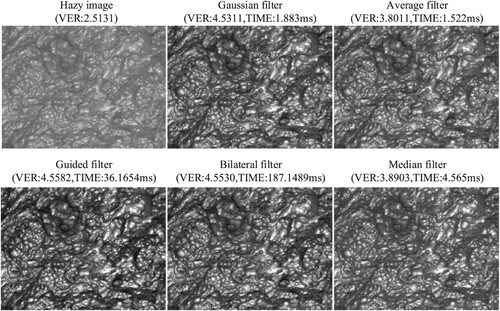
In the recovered image, the effects of the guided filter, bilateral filter and Gaussian filter on optimising the transmission map are better than those of the average filter and median filter. However, because the refinement process of guided filter and bilateral filter is highly complex and time-consuming, it is not conducive to real-time industrial scenes. The median and average filter have similar effects, while the result of the Gaussian filtering is closer to the true haze-free image than the two other types, with clearer details and less time consumption. The reason is that simple average filter and median filter do not consider the weight of adjacent pixels in the smoothing operation, which leads to blurred edges. In the Gaussian filter, the closer the relationship between adjacent pixels, the higher the weight. Otherwise, the weight is lower. The bilateral filter effect is more effective but also more time-consuming. Therefore, under comprehensive consideration, we select the Gaussian filter as the method to refine the transmission map.
4.2.2. The enhancement effect of the initial recovered image
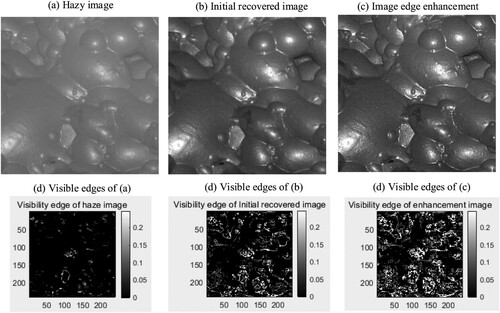
The hazy froth image was selected as the experimental object in the zinc-roughing tank, and the initial restored image was obtained by the defogging algorithm based on linear transformation in Section 3.2, and then the final defogging result was obtained by edge enhancement of the restored image. According to the definition of the visibility edge ratio in Section 4.3, we can obtain the visibility edge image of fog image, initial recovered image and final defogging image, as shown in Figure . The visible edge of the enhanced image is significantly more than that of the original restored image.
Figure 10. Visible edges of haze image and recovered image.
4.2.3. Dehazing effect under different lighting conditions
In the zinc flotation site, the change of ambient light will affect the brightness of the foam image. In this paper, the method proposed for low light foam atomisation image enhances the edge and texture of the restored image after defogging, and obtains a good defogging effect. As shown in Figure , the fog removal effects of other classical methods (Berman et al., Citation2016; Cai et al., Citation2016; He et al., Citation2010; Petro et al., Citation2014; Tarel & Hautiere, Citation2009; W. Wang et al., Citation2017) are compared.
Figure 11. Comparison chart of dehazing effect under different lighting conditions.
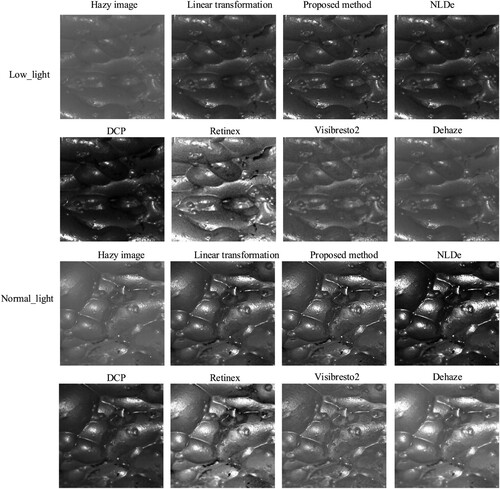
This paper uses prior information and linear transformation on the atmospheric scattering model to obtain the transmission rate, and the dehazing result after optimising the initial transmission rate is satisfactory. However, in the sharpening result of low-light dense fog images, the edges and the highlights of the froth are blurred. Therefore, the variational fractional differential operator is used to enhance the edges and texture structure of the recovered image, and the energy of gradient value of the image is improved (as shown in Table ). It can be seen from Figure that the method proposed in this paper can obtain restored images that are most consistent with the colour and texture characteristics of the froth itself under normal or low light conditions.
Table 1. Comparison of dehazing time of different algorithms (time unit: s).
4.2.4. The defogging effect of each algorithm under different fog densities
To test the dehazing performance of the algorithm under different fog densities, we select three fog density of low, medium, and high foggy froth images to process the foggy images in the zinc-roughing tank, zinc-refining tank and zinc-scavenging tank. As shown in Figure , the proposed algorithm can effectively dehaze images with different densities. The only disadvantage is that when dealing with images with high fog density, the resulting image becomes distorted.
Figure 12. Comparison of dehazing effects of different fog densities.
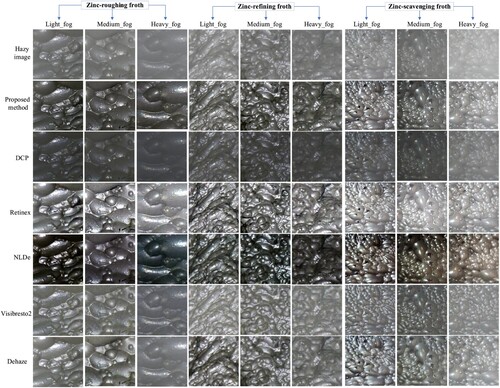
The DCP algorithm (He et al., Citation2010) is an effective algorithm in the current image dehazing effect. However, it has some prerequisites, that is, after statistical analysis, many rich colours or shadows are in the natural image. Then, the intensity value of most of the pixels in its dark channel image is extremely low or close to zero. However, the flotation froth image is different from the natural image. It has a single colour, and most of the pixel values of the corresponding dark channel image are at least greater than 50. If the DCP algorithm is used to remove the fog, the restored fog-free image cannot truly describe the colour and brightness of the froth. Retinex algorithm (Petro et al., Citation2014) is an enhancement dehazing method that has a certain dehazing effect visually. The algorithm is efficient, but the phenomenon of image distortion appears in certain places. NLDe algorithm (Berman et al., Citation2016) is effective in removing smog, but the result is often excessive enhancement and colour distortion.Visibresto2 algorithm (Tarel & Hautiere, Citation2009) has a certain effect on outdoor images, but it seems useless for industrial foggy images such as flotation froth. DehazeNet algorithm (Cai et al., Citation2016) can remove haze in images with slight and moderate haze levels. However, as the smog becomes denser, its defogging ability is very limited.
The algorithm proposed in this paper has a better effect than other methods in low-light especially. The dehazing method based on the linear transformation of the atmospheric scattering model and Gaussian filter optimising has a shorter processing time and high efficiency, and can satisfy real-time industrial dehazing needs. The enhanced algorithm to restore the image solves the problem of edge blur.
4.3. Quantitative validation experiments
In the process of obtaining a flotation foam image, froth deformation, collapse, merger, rupture and irregular motion changes occur at any time. These changes are unpredictable. Therefore, it is impossible to obtain a foggy froth image and a corresponding clear image at the same time. Here, we choose two non-reference standards (EOG described in Section 3.2.3 and visibility edge ratio (Hautiere et al., Citation2008; Sun et al., Citation2021) to evaluate the performance of the proposed algorithm.
The difference in image pixel brightness is a direct reflection of spatial contrast. Hautiere et al. (Citation2008) introduced a contrast definition that is very suitable for digital images and gave the contrast definition between two pixels x and y of an image f, which is defined by
(24)
(24)
where M is the maximum brightness of the image. Let
be the set of all couples
separated by s. The optimum thresholds
are set, and if 2
,
is considered to be a visible edge. More detail about this method can be found in references (Hautiere et al., Citation2008; Yu et al., Citation2011). According to the contrast value and threshold control of each pixel, we can obtain the visible edge image. Let the set of points on the visible edge be expressed as
, the number of visible edge pixels be denoted as
, and the number of all edge pixels be represented as
. Finally, the visibility edge ratio of the image is defined as
(25)
(25)
where
.
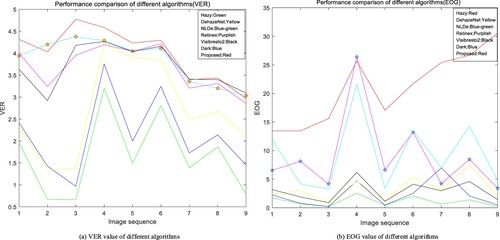
In order to verify the effectiveness of the proposed algorithm, we conducted a qualitative comparison of each algorithm on froth images of different fog levels in the three flotation tanks in Figure , as shown in Figure . The results of VER and EOG show that the proposed algorithm (marked by the line with the highest VER value and EOG value), Retinex and NLDe algorithm can obtain better visibility edge ratio values than other algorithms, and the proposed algorithm can obtain higher energy of gradient values than other algorithms. Combined with the dehazing effect of Figures and , the Retinex algorithm has a certain defogging effect on light fog images, but the restored images have serious colour distortion. The NLDe algorithm has a strong defogging ability, but no matter how the parameters are adjusted, the restored image is over-enhanced, the colour is dark, and the greyish brown of the froth cannot be restored.
Figure 13. Performance comparison of different algorithms.
In the process of froth image defogging, the first step is fog detection. When the ambient temperature is low, the air near the flotation cell is humid and easy to saturate, forming haze. This situation is relatively low compared to the seasonal change of the year. Therefore, it is necessary to detect the haze before defogging the froth image. In order to improve the detection efficiency, we set the temperature parameter. When the temperature is less than 5 C, the system detects whether the froth image is foggy every hour, and the operation efficiency of the detection process is
(MN is the image size). The second step is the dehazing algorithm based on linear transformation of the atmospheric scattering model. The estimated operating efficiency of the transmission diagram is
. In the refinement of the transmission diagram, the time of Gaussian filtering is lower than that of other filtering, which is shown in Figure . Thirdly, when the edge enhancement is performed on the initial restored image, the mask size of the differential operator is
, and the fractional order is 0.5, the details of the froth image are enhanced without introducing redundant noise. We convert an RGB image into HIS space and only enhance the edge of brightness component, which improves the efficiency of operation without causing colour loss of image.
We compared the running times of different algorithms, as shown in Table . The size of the test froth image is ,
. The parameters of the computing platform are CPU3.5 GHz, 64-bit Intel(R) Xeon(R), 32 GB RAM, Matlab2018a. The classical DCP dehazing algorithm consumes a lot of time, and the time efficiency is improved after many improvements by many researchers. Retinex algorithm is used for defogging from the aspect of image enhancement, with low time cost, but its deficiency is that the colour of the restored image seriously deviates from the true colour of the froth. Visibresto2 defogging algorithm takes about 0.5 s. This algorithm is not suitable for industrial image defogging, and the effect is very poor. DehazeNet algorithm can recover high-quality froth images under normal light with no colour distortion. However, its defogging performance is greatly reduced for low-light foggy images. The algorithm proposed in this paper has great advantages in time efficiency, the restored image can truly describe the characteristics of the froth itself, and the image texture is rich in details.
5. Conclusions
In the intelligent flotation automation system based on machine vision, defogging is only a pretreatment operation to provide clear froth images for subsequent feature extraction, and it must meet the real-time requirements of the industry. Therefore, this paper aims to solve this problem by proposing a fast and effective method to remove haze for flotation industrial froth images. The energy gradient of the image reflects the sharpness of the image. In the experiment, the maximum local image energy gradient is used as a prior constraint to obtain the initial transmittance. The proposed method is simple in operation and high in calculation efficiency, and does not need a lot of data to participate in the network training for a long time. However, in view of the results of removing low-light fog, the blur phenomenon exists at the edges in the high spots of bubbles. Therefore, the method based on the variational fractional differential is adopted to enhance the edges of images and enrich the details of images. The quantitative and qualitative analysis shows that the defogging performance and computational efficiency of this method are better than those of the other five methods, and it can meet the demand of high-quality samples extracted from flotation froth features. However, in the captured froth image, there are various mixed-blur images. In the future, our goal is to study an algorithm that can remove multiple blurs or mixed blurs, and consider applying the deep neural network method (Sun et al., Citation2021; Xi et al., Citation2021) and some algorithms of image enhancement (Y. Li et al., Citation2018; Zhang et al., Citation2021) to the new computing environment of the Internet of Things-smart terminal devices (Liang et al., Citation2021) (such as edge computing, fog computing, etc.) to meet the requirements of high efficiency and low power consumption in the flotation industry. We will extract froth image features, industrial process data for information integration, fusion and other processing (Sandor et al., Citation2019; Yu et al., Citation2021), and finally, realise the intelligent automatic control of flotation.
Disclosure statement
No potential conflict of interest was reported by the author(s).
Additional information
Funding
References
- Alajarmeh, A., Salam, R., Abdulrahim, K., Marhusin, M., Zaidan, A., & Zaidan, B. (2018). Real-time framework for image dehazing based on linear transmission and constant-time airlight estimation. Information Sciences, 436(22), 108–130. https://doi.org/10.1016/j.ins.2018.01.009
- Aldrich, C., Marais, C., Shean, B., & Cilliers, J. (2010). Online monitoring and control of froth flotation systems with machine vision: A review. International Journal of Mineral Processing, 96(1–4), 1–13. https://doi.org/10.1016/j.minpro.2010.04.005
- Berman, D., Treibitz, T., & Avidan, S. (2016, June 27–30). Non-local image dehazing. Proceedings of the IEEE conference on Computer Vision and Pattern Recognition, Las Vegas, NV (pp. 1674–1682). IEEE. https://doi.org/10.1109/CVPR.2016.185
- Cai, B., Xu, X., Jia, K., Qing, C., & Tao, D. (2016). Dehazenet: An end-to-end system for single image haze removal. IEEE Transactions on Image Processing, 25(11), 5187–5198. https://doi.org/10.1109/TIP.2016.2598681
- Fattal, R. (2008). Single image dehazing. ACM Transactions on Graphics, 27(3), 1–9. https://doi.org/10.1145/1360612.1360671
- Fujita, S., & Fukushima, N. (2017). Extending guided image filtering for high-dimensional signals. In J. Braz, N. Magnenat-Thalmann, P. Richard, L. Linsen, A. Telea, S. Battiato, & F. Imai (Eds.), Computer vision, imaging and computer graphics theory and applications, VISIGRAPP 2016 (Vol. 693, Communications in Computer and Information Science, pp. 439–453). Springer. https://doi.org/10.1007/978-3-319-64870-5_21
- Ge, G., Wei, Z., & Zhao, J. (2015). Fast single-image dehazing using linear transformation. Optik, 126(21), 3245–3252. https://doi.org/10.1016/j.ijleo.2015.07.138
- Hautiere, N., Tarel, J. P., Aubert, D., & Dumont, E. (2008). Blind contrast enhancement assessment by gradient ratioing at visible edges. Image Analysis & Stereology, 27(2), 87–95. https://doi.org/10.5566/ias.v27.p87-95
- He, K., Sun, J., & Tang, X. (2010). Single image haze removal using dark channel prior. IEEE Transactions on Pattern Analysis and Machine Intelligence, 33(12), 2341–2353. https://doi.org/10.1109/TPAMI.2010.168
- Jinping, L., Weihua, G., Xuemin, M., Zhaohui, T., & Jianqi, L. (2010). Flotation froth image texture feature extraction based on Gabor wavelets. Chinese Journal of Scientific Instrument, 31(8), 1769–1775. https://doi.org/10.19650/j.cnki.cjsi.2010.08.015
- Ju, M., Zhang, D., & Wang, X. (2017). Single image dehazing via an improved atmospheric scattering model. The Visual Computer, 33(12), 1613–1625. https://doi.org/10.1007/s00371-016-1305-1
- Khmag, A., Al-Haddad, S., Ramli, A. R., & Kalantar, B. (2018). Single image dehazing using second-generation wavelet transforms and the mean vector L2-norm. The Visual Computer, 34(5), 675–688. https://doi.org/10.1007/s00371-017-1406-5
- Kim, J. H., Jang, W. D., Sim, J. Y., & Kim, C. S. (2013). Optimized contrast enhancement for real-time image and video dehazing. Journal of Visual Communication and Image Representation, 24(3), 410–425. https://doi.org/10.1016/j.jvcir.2013.02.004
- Kim, J. H., Sim, J. Y., & Kim, C. S. (2011, May 22–27). Single image dehazing based on contrast enhancement. IEEE International Conference on Acoustics, Speech and Signal Processing (ICASSP), Prague, Czech Republic (pp. 1273–1276). IEEE. https://doi.org/10.1109/ICASSP.2011.5946643
- Li, B., Peng, X., Wang, Z., Xu, J., & Feng, D. (2017, October 22–29). Aod-net: All-in-one dehazing network. Proceedings of the IEEE International Conference on Computer Vision (ICCV), Venice, Italy (pp. 4770–4778). IEEE. https://doi.org/10.1109/ICCV.2017.511
- Li, C., He, T., Wang, Y., Zhang, L., Liu, R., & Zheng, J. (2020). Pipeline image haze removal system using dark channel prior on cloud processing platform. International Journal of Computational Science and Engineering, 22(1), 84–95. https://doi.org/10.1504/IJCSE.2020.107254
- Li, Y., Lu, H., Li, K. C., Kim, H., & Serikawa, S. (2018). Non-uniform de-scattering and de-blurring of underwater images. Mobile Networks and Applications, 23(2), 352–362. https://doi.org/10.1007/s11036-017-0933-7
- Liang, W., Long, J., Li, K. C., Xu, J., Ma, N., & Lei, X. (2021, April). A fast defogging image recognition algorithm based on bilateral hybrid filtering. ACM Transactions on Multimedia Computing, Communications, and Applications, 17(2), 1–16. https://doi.org/10.1145/3391297
- Liang, W., Ning, Z., Xie, S., Hu, Y., Lu, S., & Zhang, D. (2021). Secure fusion approach for the internet of things in smart autonomous multi-robot systems. Information Sciences, 579(1), 468–482. https://doi.org/10.1016/j.ins.2021.08.035
- Liang, W., Xie, S., Long, J., Li, K. C., Zhang, D., & Li, K. (2019). A double PUF-based RFID identity authentication protocol in service-centric internet of things environments. Information Sciences, 503(10), 129–147. https://doi.org/10.1016/j.ins.2019.06.047https://www.sciencedirect.com/science/article/pii/S0020025519305857.
- McCartney, E. J. (1976). Optics of the atmosphere: Scattering by molecules and particles. Physics Today, 30(5), 76–77. https://doi.org/10.1063/1.3037551
- Narasimhan, S. G., & Nayar, S. K. (2000, June 15). Chromatic framework for vision in bad weather. Proceedings IEEE conference on Computer Vision and Pattern Recognition, CVPR 2000 (Cat. No.PR00662), Hilton Head, SC (pp. 598–605). IEEE. https://doi.org/10.1109/CVPR.2000.855874
- Narasimhan, S. G., & Nayar, S. K. (2002). Vision and the atmosphere. International Journal of Computer Vision, 48(3), 233–254. https://doi.org/10.1023/A:1016328200723
- Oakley, J. P., & Satherley, B. L. (1998). Improving image quality in poor visibility conditions using a physical model for contrast degradation. IEEE Transactions on Image Processing, 7(2), 167–179. https://doi.org/10.1109/83.660994
- Petro, A. B., Sbert, C., & Morel, J. M. (2014). Multiscale retinex. Image Processing On Line, 4, 71–88. https://doi.org/10.5201/ipol.2014.107
- Sandor, V. K. A., Lin, Y., Li, X., Lin, F., & Zhang, S. (2019). Efficient decentralized multi-authority attribute based encryption for mobile cloud data storage. Journal of Network and Computer Applications, 129(4), 25–36. https://doi.org/10.1016/j.jnca.2019.01.003
- Stark, J. A. (2000). Adaptive image contrast enhancement using generalizations of histogram equalization. IEEE Transactions on Image Processing, 9(5), 889–896. https://doi.org/10.1109/83.841534
- Sun, X., Wang, Q., Zhang, X., Xu, C., & Zhang, W. (2021). Deep blur detection network with boundary-aware multi-scale features. Connection Science. https://doi.org/10.1080/09540091.2021.1933906
- Tang, K., Yang, J., & Wang, J. (2014, June 23–28). Investigating haze-relevant features in a learning framework for image dehazing. Proceedings of the IEEE conference on Computer Vision and Pattern Recognition, Columbus, OH (pp. 2995–3000). IEEE. https://doi.org/10.1109/CVPR.2014.383
- Tarel, J. P., & Hautiere, N. (2009, September 29-October 2). Fast visibility restoration from a single color or gray level image. IEEE 12th international conference on Computer Vision, Kyoto, Japan (pp. 2201–2208). IEEE. https://doi.org/10.1109/ICCV.2009.5459251
- Wang, J. B., He, N., Zhang, L. L., & Lu, K. (2015). Single image dehazing with a physical model and dark channel prior. Neurocomputing, 149(3), 718–728. https://doi.org/10.1016/j.neucom.2014.08.005
- Wang, W., Yuan, X., Wu, X., & Liu, Y. (2017). Fast image dehazing method based on linear transformation. IEEE Transactions on Multimedia, 19(6), 1142–1155. https://doi.org/10.1109/TMM.2017.2652069
- Wei, Z., Zhu, G., Liang, X., & Liu, W. (2020). An image fusion dehazing algorithm based on dark channel prior and retinex. International Journal of Computational Science and Engineering, 23(2), 115–123. https://doi.org/10.1504/IJCSE.2020.110556
- Wu, X., Liu, X. Y., & Yuan, F. (2021). Fast dehazing method for improving the image quality in pellet size measurement. Computers in Industry, 128, 103438. https://doi.org/10.1016/j.compind.2021.103438
- Xi, C., Feng, H. Y., & Wang, J. L. (2021). Robust coal granularity estimation via deep neural network with an image enhancement layer. Connection Science, 33(3), 1–30. https://doi.org/10.1080/09540091.2021.2017853
- Xu, M., Yang, J., Zhao, D., & Zhao, H. (2015). An image-enhancement method based on variable-order fractional differential operators. Bio-medical Materials and Engineering, 26(S1), S1325–S1333. https://doi.org/10.3233/BME-151430
- Yu, L., Duan, Y., & Li, K. C. (2021). A real-world service mashup platform based on data integration, information synthesis, and knowledge fusion. Connection Science, 33(3), 463–481. https://doi.org/10.1080/09540091.2020.1841110
- Yu, X., Xiao, C., Deng, M., & Peng, L. (2011, August 12–15). A classification algorithm to distinguish image as haze or non-haze. Sixth international conference on Image and Graphics, Hefei, China (pp. 286–289). IEEE. https://doi.org/10.1109/ICIG.2011.22
- Zeng, F., Wu, Q., & Du, J. (2014). Foggy image enhancement based on filter variable multi-scale retinex. Applied Mechanics and Materials, 505–506, 1041–1045. https://doi.org/10.4028/www.scientific.net/AMM.505-506.1041
- Zhang, J., Cheng, Z., Cheng, X., & Chen, B. (2021). OAC-HAS: Outsourced access control with hidden access structures in fog-enhanced IoT systems. Connection Science, 33(4), 1060–1076. https://doi.org/10.1080/09540091.2020.1841096
- Zhou, J., & Zhou, F. (2013, December 23–24). Single image dehazing motivated by Retinex theory. 2nd international symposium on Instrumentation and Measurement, Sensor Network and Automation (IMSNA), Toronto, ON (pp. 243–247). IEEE. https://doi.org/10.1109/IMSNA.2013.6743260