
 ?Mathematical formulae have been encoded as MathML and are displayed in this HTML version using MathJax in order to improve their display. Uncheck the box to turn MathJax off. This feature requires Javascript. Click on a formula to zoom.
Abstract
The mixed control chart is proposed to improve detection performance with fewer process shifts. In this study, we proposed the modified exponentially weighted moving average - moving average control chart (MMEM), a new mixed control chart for observing the changes in the process mean. Average run length, standard deviation of run length, and median run length can be used to examine the effectiveness of detecting changes in the proposed chart with Shewhart, Moving Average (MA), Modified Exponentially Weighted Moving Average (MEWMA), and Mixed Moving Average - Modified Exponentially Weighted Moving Average (MMME) control charts in parametric and nonparametric distributions that use Monte Carlo simulation. The results demonstrate that the proposed chart outperforms other control charts mostly in the detection of small-to-moderate shifts. To illustrate the application of the proposed chart, chemical process temperature data and dataset on survival times of a group of patients suffering from head and neck cancer disease and treated with radiotherapy were provided, and it was discovered that the proposed chart performs better than other control charts.
1. Introduction
Many statistical methods have grown and developed in a variety of procedures, including often used in industry, business, health care, the environment, engineering, and other fields. Control charts are an important tool in Statistical Process Control (SPC) and are extensively used to control, monitor, and optimise a manufacturing procedure. Shewhart introduced the first control chart study, which is known as the Shewhart chart (Shewhart, Citation1931). The Shewhart chart has a high performance in detecting large shifts in the process mean. However, an alternate control chart has been developed to improve the detection of relatively minor to moderate shifts, such as the cumulative sum (CUSUM) control chart proposed by Page (Citation1954), the exponentially weighted moving average (EWMA) control chart presented by Roberts (Citation1959) and moving average (MA) control chart introduced by Khoo (Citation2004). Moreover, Patel and Divecha (Citation2011) created the modified exponentially weighted moving average (MEWMA) control chart. Khan et al. (Citation2017) developed a generalised form of MEWMA that takes into account the process's past and current actions. As a result, when compared to existing control charts, it can detect shifts faster. Based on the MEWMA chart, exciting works have been finalised. Aslam et al. (Citation2017) showed that the modified exponentially weighted moving average statistic was used to create a control chart for the Conway–Maxwell Poisson (COM-Poisson) distribution. The proposed chart detects smaller changes in the location parameter of the COM-Poisson distribution efficiently. The proposed control chart's performance was evaluated using the average and standard deviation of the run length for various parameters. Detection ability has also been improved when compared to the existing control chart using the EWMA statistic. Saghir et al. (Citation2020) studied a MEWMA chart for monitoring the process variation. The MEWMA chart's efficiency is investigated and compared to some existing control charts. The comparison reveals that the proposal performs better than its counterparts. Aslam and Anwar (Citation2020) developed a Bayesian Modified-EWMA chart to monitor the location parameter in a process that used average run length to evaluate the proposed chart and its counterparts. The results reveal that the improved chart performs better counterparts in terms of monitoring small to moderate shifts in the process. Alevizakos et al. (Citation2021) investigated the MEWMA chart in greater depth using different values of its additional design parameter and created the double MEWMA (DMEWMA) chart to monitor shifts in the process mean under the assumption of normal distribution. The performance of their chart was measured by the average and standard deviation of run length. When compared to the classical chart, the modified schemes with a medium or large value of the smoothing parameter and a negative value of the additional parameter had better detection ability for the range of shifts.
The mixed control chart is proposed to boost detection performance for fewer process shifts. Several works of literature are available on constructing a mixed control chart to increase the actuation of the control chart to detect the abrupt change. For example, Wong et al. (Citation2004) developed a simple design of the MA chart and the combined MA–Shewhart scheme for easy implementation in the financial sector. Therefore, in detecting the intended shift, the MA chart is slightly less sensitive than the EWMA or CUSUM charts, but the overall performance is quite similar. The MA chart and the corresponding EWMA chart have nearly identical in-control run length distributions. Because it is based on a simple average, the MA chart is much easier to understand. Abbas et al. (Citation2013) explored the EWMA-CUSUM mixed charts for process monitoring. The proposed control chart is compared to some representative control charts, like the classical CUSUM, classical EWMA, Fast Initial Response (FIR) CUSUM, FIR EWMA, adaptive CUSUM with an EWMA-based shift estimator, weighted CUSUM, and runs rules-based CUSUM and EWMA. The comparisons show that using both charts makes the proposed scheme even more sensitive to small shifts in the process mean than other small shift detection schemes. Zaman et al. (Citation2015) suggested the mixed CUSUM-EWMA chart (MCE), which is used to track the location of a process. The proposed control chart's performance is evaluated using the average run length, extra quadratic loss, and relative average run length. The analysis revealed that the proposed MCE control chart is very sensitive for detecting small and moderate shifts and has a very efficient structure when compared to existing counterparts. Khan et al. (Citation2016) designed an EWMA control chart for exponential distributed quality based on moving average statistics, the proposed control chart first approximates normal variables from the sample data, then calculates the MA statistic for each subgroup, and finally constructs the EWMA statistic based on the current and previous MA statistics. The average run lengths (in control and out of control) are calculated and tabulated using process shift parameters and smoothing constants. For all shift parameters, the proposed control chart outperforms the MA control chart. Taboran et al. (Citation2019) proposed the MA-EWMA charts to search for process changes mean with normal and non-normal distributions, whereas Sukparungsee et al. (Citation2020) suggested EWMA-MA charts. The results showed that the proposed chart's efficiency outperformed the Shewhart, MA, and EWMA charts in terms of detection using average run length, a standard deviation of run length, and median run length. Taboran et al. (Citation2020, Citation2021) presented a Tukey MA-EWMA control chart and a Tukey MA-DEWMA control chart for the monitor mean process, respectively. Both control charts are a merger of parametric and nonparametric control charts, and research has shown that the ARL of the presented chart is much more efficient at detecting changes than other control charts. Anwar et al. (Citation2020) proposed a modified-mxEWMA chart for better process monitoring with auxiliary data. Abbas et al. (Citation2020) created a new mixed EWMA–progressive mean (MEP) chart that evaluated the performance of the proposed MEP control chart by average run length. The analysis reveals that the proposal of this study offers a superior design structure compared to its competing counterparts. Anwar et al. (Citation2020, Citation2021) presented mixed MxMEC and MxMCE control charts based on auxiliary information for efficient process monitoring, and the combined mixed EWMA-CUSUM (CMEC) control chart is used to simultaneously monitor the process parameters, with the results demonstrating the superiority of the proposed chart over other competing charts for small-to-moderate shifts. Abid et al. (Citation2021a, Citation2021b) presented a mixed homogeneously weighted moving average and cumulative sum (HWMA-CUSUM) and CUSUM-HWMA, and the results demonstrate that the designed chart outperforms the existing control charts. Ali et al. (Citation2021) suggested a new nonparametric exponentially weighted moving average chart with a progressive setup based on sign and arcsine test statistics, and the research demonstrated that when the proposed chart's performance is compared to alternatives, its ability to detect small and persistent shifts is much better. Riaz et al. (Citation2021) created the progressive exponentially weighted moving average (PEWMA) chart. The proposed PEWMA chart's performance is also compared to some existing competitors, including the classical EWMA, classical CUSUM, HWMA, MEC, MCE, and DEWMA charts, discovering that the proposal offers design features like high sensitivity to small and persistent drifts in the process mean. The mixed MA-CUSUM control chart was created by Saengsura et al. (Citation2022), and the results indicate that the proposed chart was more efficient than the Shewhart, CUSUM, MA, and CUSUM-MA charts by using ARL, SDRL, and MRL.
In this paper, we proposed the MEWMA-MA (MMEM) chart, a mixed control chart that combines the MEWMA chart and the MA chart with the motivation of improving detection ability for smaller shifts in the process mean parameter under symmetric and asymmetric distributions. Average run length (ARL), standard deviation of run length (SDRL), and median run length (MRL) were used as efficiency criteria in Monte Carlo simulation and their efficiency was compared to Shewhart, MA, MEWMA, and MA-MEWMA charts. Furthermore, it could also be implemented in real data.
2. Design of control chart
The parametric control charts MA and MEWMA were used in this study. We presented a new control chart (MMME, MMEM) by combining the MA and MEWMA control charts as follows.
2.1. Moving average control chart (MA)
The MA control chart is a very useful tool in SPC. It can detect a small change. Suppose that observation , for
are independent and identically distributed (i.i.d.) random samples from the normal distribution. The statistic of the MA chart at the time
is calculated from the moving average at each width (
). It can be divided into two cases as follows:
(1)
(1)
The mean and variance of MA statistic are given as follows:
(2)
(2)
(3)
(3)
Therefore, the control limits of the MA chart are given as follow:
(4)
(4) where
is a coefficient of the control limits of the MA control chart.
and
are the mean and standard deviation of the process respectively.
2.2. Modified exponentially weighted moving average control chart (MEWMA)
The MEWMA control chart was developed by Khan et al. (Citation2017). It is very effective in detecting small and abrupt shifts. Suppose that observation at the time
,
follows the normal distribution. The statistic of the MEWMA control chart is defined as follows.
(5)
(5) where
is the MEWMA statistic at time
,
is a smoothing parameter between 0–1 and
is an additional parameter (
). This research identifies
. Then the mean and variance of
are:
(6)
(6)
(7)
(7) From Equation Equation7
(7)
(7) , when
, the asymptotic variance is
(8)
(8) The upper and lower control limits of MEWMA chart are:
(9)
(9) where
is a coefficient of the control limits of the MEWMA control chart.
is the mean of the process and
is a variance of the process.
2.3. Mixed moving average - modified exponentially weighted moving average control chart (MMME)
This chart was a combination of the MA and MEWMA control charts. The statistic of the MEWMA chart is used the input to the MA chart (Equation Equation1
(1)
(1) ). The statistic of the MMME control chart is defined as:
(10)
(10) where
is the MMME statistic at the time
and
is the MEWMA statistic at a time
. Therefore, the asymptotical upper and lower control limits of the MMME chart are given as follow:
(11)
(11) where
is a coefficient of the control limits of the MMME control chart.
is the mean and
is a variance of the MEWMA respectively.
2.4. The proposed mixed modified exponentially weighted moving average - moving average control chart (MMEM)
Similarly, the MMEM chart is formed by combining the design structures of a MEWMA and an MA control chart. The statistic of the MMEM control chart is defined as:
(12)
(12) where
is the MMEM statistic at the time
,
is the MA statistic at the time
,
is a smoothing parameter between 0–1 and
is an additional parameter (
).
is starting value and is set to be equal to the target mean
, then the control limit of MMEM chart are the expected values for the data, which will be the same value of the MA chart. The variance will be applied between the MEWMA and MA chart as shown in Equation Equation3
(3)
(3) and Equation Equation8
(8)
(8) . In this study, we assume that the two control charts are independent and that there is no covariance term. If the two control charts are dependent, we demonstrate through an example of the proposed chart's covariance term in Appendix. Thus, the upper and lower control limits of the MMEM chart are given as follow:
(13)
(13) where
is a coefficient of the control limits of the MMEM control chart.
is the mean and
is a variance of the MA respectively.
3. The methodology of performance measurement and comparison
The average run length (ARL) is a commonly used metric to assess the effectiveness of a control chart. It is the expected number of times before the control chart raises a warning signal indicating that the process is already out of control (Montgomery, Citation2009). is used when the situation is under control, and it should be large, whereas
is used when the situation is out of control, and it should be small. The control chart with the highest efficiency reveals the minimum
. Furthermore, the standard deviation of the run length (SDRL) and the median run length (MRL) are used to assess the efficiency of the control chart. For a run length distribution that can range from highly skewed to nearly symmetric for the shift, the MRL is a more meaningful quantity to trust because interpretation based on the MRL is more clearly understood (Gan, Citation1993).
The ARL, SDRL, and MRL are used as criteria in this paper to measure the efficiency of the control chart, which is evaluated using computer simulation (Huifeng et al., Citation2021; Kashani et al., Citation2020; Zhao et al., Citation2020) and the values are set as follows: (1) Each round of experimentation should have a sample size (n) of 10,000. (2) Set the number of repetitions (N) of the experiment to 200,000. And (3) When the process is under control, given .
The ARL, SDRL, and MRL are defined as follows:
(14)
(14)
(15)
(15)
(16)
(16) where
is the number of samples required before the process becomes uncontrollable for the first time,
is the number of data simulations, and
is the number of experiment repetitions. The data sets for simulation are generated by simulating and monitoring the performance of this algorithm using the Monte Carlo method (Hancer, Citation2019; Qiu et al., Citation2021; Xie et al., Citation2021).
The algorithm of the proposed chart is divided into the following steps:
Generate “n” random samples from any underlying probability distribution.
Decide “V” at pre-specified
.
Evaluate the proposed statistic of the control charts.
Calculate the control limits (UCL/LCL) and plot the values statistic on these limits in step 3.
Steps 1–4 should be repeated 200,000 times to calculate the chart's performance measure (ARL, SDRL, and MRL).
4. Results
4.1. The simulation studies
The point of the study was to compare the speed with which the proposed chart detected a change in the mean of the process versus the Shewhart, MA, MEWMA, and MMME control charts under symmetric distributions: Normal(0,1), Laplace(0,1) distributions and asymmetric distributions: Exponential(1), Gamma(4,1) distributions. A comparison of performance in detecting a change when the parameter shifts were [−4, 4] has also been performed. The assessments of the control chart's efficiency were taken from , SDRL and MRL values. The most efficient control chart was the one with the minimum
, SDRL, and MRL values. The results were shown in Tables .
Table 1. Comparison of the chart's performance with ,
and
for Normal distribution.
Table 2. Comparison of the chart's performance with ,
and
for Laplace distribution.
Table 3. Comparison of the chart's performance with ,
and
for Exponential Distribution.
Table 4. Comparison of the chart's performance with ,
and
for Gamma distribution.
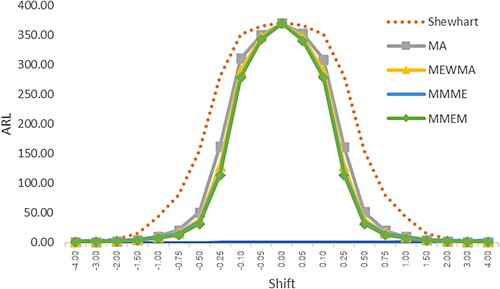
The results for a process with observations following the Normal(0,1) distribution where ,
and
are shown in Table and Figure . We discovered that the MMEM control chart
was the most effective control chart for detecting changes when the shift parameter level was set to
,
,
,
,
,
, whereas the MA control chart was the most useful in detecting changes when the shift parameter level was set to ,,. When considering the results of the SDRL and MRL, it was consistent with giving a similar value.
Figure 1. Average run length (ARL) curves of Shewhart, MA, MEWMA, MMME and MMEM control chart for Normal distribution.
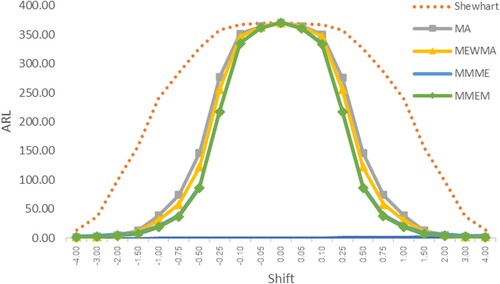
The results for a process with observations following the Laplace(0,1) distribution are shown in Table 2 and Figure . The proposed MMEM control chart had lower
, SDRL and MRL values than other control charts when the shift parameter was changed at
,
,
,
,
,
,
,
except for
and
, where the MA control chart outperformed. When the SDRL and MRL values were considered, the results were found to be consistent with the
.
Figure 2. Average run length (ARL) curves of Shewhart, MA, MEWMA, MMME and MMEM control chart for Laplace distribution.
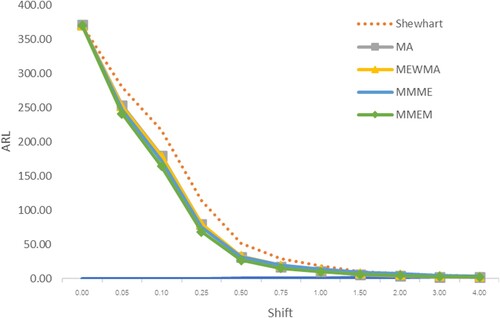
From Table and Figure , when the process was Exponential(1) distribution,
,
and
. We discover that the MMEM control chart was the most effective at detecting changes more than other control charts when the shift parameter level was changed at 0.05, 0.10, 0.25, 0.50, 0.75, and 1.00 whereas from parameter change at 1.50, 2.00, 3.00, and 4.00 that MA control chart was more efficient. When the SDRL and MRL values were assumed, the results were validated with the
.
Figure 3. Average run length (ARL) curves of Shewhart, MA, MEWMA, MMME and MMEM control chart for Exponential distribution.
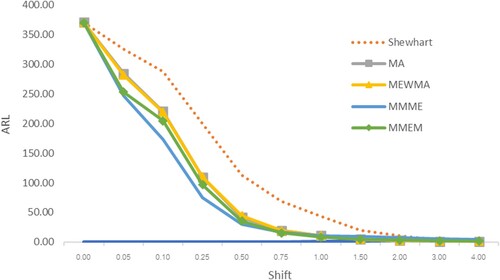
The results for a process with observations following the Gamma(4,1) distribution are shown in Table and Figure . The proposed MMEM control chart had lower
, SDRL and MRL values than other control charts when the shift parameter was changed at 0.05, 0.10, 0.25, 0.50, 0.75 1.00, and 1.50 except for 2.00, 3.00, and 4.00, where the MA control chart outperformed. When the SDRL and MRL values were considered, the results were found to be consistent with the
.
Figure 4. Average run length (ARL) curves of Shewhart, MA, MEWMA, MMME and MMEM control chart for Gamma distribution.
4.2. Application
We used the proposed control chart on two sets of real-world data: (1) Chemical process temperature data and (2) The survival times of a group of patients suffering from head and neck cancer disease and treated using radiotherapy. The data generated the Shewhart, MA, MEWMA, MMME, and MMEM charts.
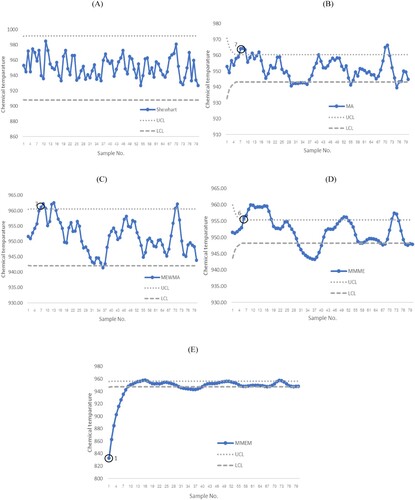
The first data set consists of temperature reading from a chemical process taken every two minutes in degrees Celsius (Montgomery, Citation2009, p. 431). When the process is unchanged, it follows a normal distribution with a mean of 950. It can be concluded that the MMEM control chart was the quickest to detect a change in chemical process temperature in the first, while the MMME chart was able to detect a change in the 6th, the MA and the MEWMA charts were able to detect a change in the 7th, and the Shewhart chart was unable to detect a change in the chemical process. As a result, the MMEM chart performs the best in terms of early detection of a change, as illustrated in Figure .
Figure 5. The performance comparison of detecting a change in the Chemical process temperature data between (A)Shewhart chart, (B) MA chart, (C) MEWMA chart, (D) MMME chart and (E) MMEM chart.
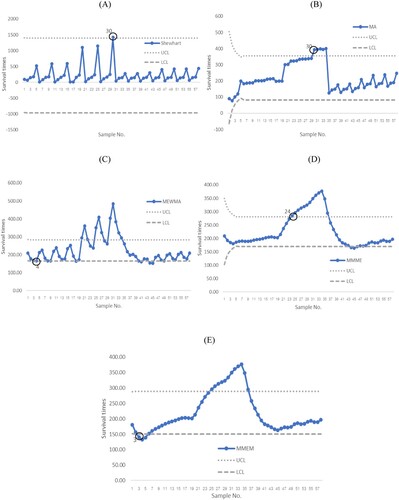
The second set of data represents the survival times of a group of patients with head and neck cancer who were treated with radiotherapy (Shanker et al., Citation2015). It complies with the exponential distribution. The results showed that the performance of the proposed chart can detect a mean change in survival times in the third. Following that, the MEWMA charts detected a change in survival times on the fourth, the MMME charts on the 24th, the MA and the Shewhart control charts were able to detect a change in survival time on the 30th. As a result, it was possible to conclude that the proposed chart was the quickest control chart to detect a change in the survival times of a group of patients with head and neck cancer disease who were being treated with radiotherapy, as indicated in Figure .
Figure 6. The performance comparison of detecting of a change in the survival times of a group of patients suffering from head and neck cancer disease data between (A)Shewhart chart, (B) MA chart, (C) MEWMA chart, (D) MMME chart and (E) MMEM chart.
5. Discussions and conclusions
In the present article, we proposed the new control chart, which is a combination of the MEWMA and MA control charts to detect shifts in the mean of process under symmetric and asymmetric distributions. The ARL, SDRL, and MRL are used as criteria to measure the efficiency of the control chart, which is evaluated using Monte Carlo simulation. The in-control average run length was 370. The results are summarized in Table . The comparative analysis reveals that the proposed chart detects the shift in the process mean significantly better than the Shewhart, MA, MEWMA, and MMME charts when the shift is small to moderate in all distributions. When the parameter had a large shift, the MA control chart exceeded the proposed chart. Consider a process that exhibits a normal distribution, the proposed control chart detected the change more effectively than other control charts at and
. However, when
and
, it was found that the MA chart had better efficiency than other control charts. For the Laplace distribution, the proposed control chart detected the change more effectively than other control charts at
and
similarly normal distribution. Whereas, when
and
it was found that the MA chart and the proposed chart had better efficiency than other control charts.
Table 5. Comparison of the chart's performance of Shewhart, MA, MEWMA, MMME and MMEM control chart for symmetric and asymmetric distribution.
For the exponential distribution and gamma distribution, the proposed control chart detected the change more effectively than the other control chart at . On the other hand, when
, it was found that MA chart had better efficiency than other control charts. The application results of the proposed chart to the two set of data revealed that the proposed chart was efficient to detect the change of both data sets.
However, we evaluate the proposed MMEM chart's ARL performance to MA-EWMA (Taboran et al., Citation2019) and EWMA-MA (Sukparungsee et al., Citation2020). The simulation outcomes revealed that the proposed chart exceeded the EWMA-MA for all dimensions of change under symmetric and asymmetric distributions, while the proposed chart outperformed the MA-EWMA for some dimensions of change under symmetric distribution. Nevertheless, the limitations of the proposed chart can be used by ignoring the covariance term and ARL from simulation may take a long time. This work can be extended for estimation of the variance parameter and apply them to real data with different distributions in future research studies.
Acknowledgements
The authors would like to thank the Ministry of Science and Technology Thailand for the Ph.D. scholarship. The authors would like to express their appreciation to Graduate College, King Mongkut's University of Technology North Bangkok and Rajamangala University of Technology Lanna for their all support. Besides, we would like to express our gratitude to Thailand Science Research and Innovation, Ministry of Higher Education, Science, Research for supporting the research fund with Contract no. KMUTNB-FF-65-41.
Disclosure statement
No potential conflict of interest was reported by the author(s).
Additional information
Funding
References
- Abbas, N., Riaz, M., & Does, R. J. M. M. (2013). Mixed exponentially weighted moving average-cumulative Sum charts for process monitoring. Quality and Reliability Engineering International, 29(3), 345–356. https://doi.org/10.1002/qre.1385
- Abbas, Z., Nazir, H. Z., Akhtar, N., Riaz, M., & Abid, M. (2020). On developing an exponentially weighted moving average chart under progressive setup: An efficient approach to manufacturing processes. Quality and Reliability Engineering International, 36(7), 2569–2591. https://doi.org/10.1002/qre.2716
- Abid, M., Mei, S., Nazir, H. Z., Riaz, M., & Hussain, S. (2021a). A mixed HWMA-CUSUM mean chart with an application to manufacturing process. Quality and Reliability Engineering International, 37(2), 618–631. https://doi.org/10.1002/qre.2752
- Abid, M., Mei, S., Nazir, H. Z., Riaz, M., Hussain, S., & Abbas, Z. (2021b). A mixed cumulative sum homogeneously weighted moving average control chart for monitoring process mean. Quality and Reliability Engineering International, 37(5), 1758–1771. https://doi.org/10.1002/qre.2824
- Alevizakos, V., Chatterjee, K., & Koukouvinos, C. (2021). Modified EWMA and DEWMA control charts for process monitoring. Communications in Statistics – Theory and Methods, 1–25. https://doi.org/10.1080/03610926.2021.1872642
- Ali, S., Abbas, Z., Nazir, H. Z., Riaz, M., Zhang, X., & Li, Y. (2021). On designing mixed nonparametric control chart for monitoring the manufacturing processes. Arabian Journal for Science and Engineering, 46(12), 12117–12136. https://doi.org/10.1007/s13369-021-05801-6
- Anwar, S. M., Aslam, M., Ahmad, S., & Riaz, M. (2020a). A modified-mxEWMA location chart for the improved process monitoring using auxiliary information and its application in wood industry. Quality Technology & Quantitative Management, 17(5), 561–579. https://doi.org/10.1080/16843703.2019.1696011
- Anwar, S. M., Aslam, M., Riaz, M., & Zaman, B. (2020b). On mixed memory control charts based on auxiliary information for efficient process monitoring. Quality and Reliability Engineering International, 36(6), 1949–1968. https://doi.org/10.1002/qre.2667
- Anwar, S. M., Aslam, M., Zaman, B., & Riaz, M. (2021). Mixed memory control chart based on auxiliary information for simultaneously monitoring of process parameters: An application in glass field. Computers & Industrial Engineering, 156, 1–18. https://doi.org/10.1016/j.cie.2021.107284
- Aslam, M., & Anwar, S. M. (2020). An improved Bayesian modified-EWMA location chart and its applications in mechanical and sport industry. PLOS ONE, 15, e0229422. https://doi.org/10.1371/journal.pone.0229422
- Aslam, M., Saghir, A., Ahmad, L., Jun, C.-H., & Hussain, J. (2017). A control chart for COM-Poisson distribution using a modified EWMA statistic. Journal of Statistical Computation and Simulation, 87(18), 3491–3502. https://doi.org/10.1080/00949655.2017.1373114
- Gan, F. F. (1993). An optimal design of EWMA control charts based on median run length. Journal of Statistical Computation and Simulation, 45(3-4), 169–184. https://doi.org/10.1080/00949659308811479
- Hancer, E. (2019). Fuzzy kernel feature selection with multi-objective differential evolution algorithm. connection Science, 31(4), 323–341. https://doi.org/10.1080/09540091.2019.1639624
- Huifeng, W., Shankar, A., & Vivekananda, G. N. (2021). Modelling and simulation of sprinters’ health promotion strategy based on sports biomechanics. Connection Science, 33(4), 1028–1046. https://doi.org/10.1080/09540091.2020.1807467
- Kashani, M., Gorgin, S., & Shojaedini, S. V. (2020). A fuzzy irregular cellular automata-based method for the vertex colouring problem. Connection Science, 32(1), 37–52. https://doi.org/10.1080/09540091.2019.1650329
- Khan, N., Aslam, M., & Jun, C.-H. (2016). A EWMA control chart for exponential distributed quality based on moving average statistics. Quality and Reliability Engineering International, 32(3), 1179–1190. https://doi.org/10.1002/qre.1825
- Khan, N., Aslam, M., & Jun, C.-H. (2017). Design of a control chart using a modified EWMA statistic. Quality and Reliability Engineering International, 33(5), 1095–1104. https://doi.org/10.1002/qre.2102
- Khoo, M. B. C. (2004). A moving average control chart for monitoring the fraction Non-conforming. Quality and Reliability Engineering International, 20(6), 617–635. https://doi.org/10.1002/qre.576
- Montgomery, D. C. (2009). Introduction to statistical quality control. John Wiley and Sons, Inc.
- Page, E. S. (1954). Continuous inspection schemes. Biometrika, 41(1-2), 100–115. https://doi.org/10.1093/biomet/41.1-2.100
- Patel, A. K., & Divecha, J. (2011). Modified exponentially weighted moving average (EWMA) control chart for an analytical process data. Journal of Chemical Engineering and Materials Science, 2(1), 12–20. https://doi.org/10.5897/JCEMS.9000014
- Qiu, L., Sai, S., & Tian, X. (2021). Tsfsim: A three-step fast selection algorithm for influence maximisation in social network. Connection Science, 33(4), 854–869. https://doi.org/10.1080/09540091.2021.1904206
- Riaz, M., Abbas, Z., Nazir, H. Z., Akhtar, N., & Abid, M. (2021). On designing a progressive EWMA structure for an efficient monitoring of silicate enactment in hard bake processes. Arabian Journal for Science and Engineering, 46(2), 1743–1760. https://doi.org/10.1007/s13369-020-04948-y
- Roberts, S. W. (1959). Control chart tests based on geometric moving averages. Technometrics, 1(3), 239–250. https://doi.org/10.1080/00401706.1959.10489860
- Saengsura, N., Sukparungsee, S., & Areepong, Y. (2022). Mixed moving average-cumulative sum control chart for monitoring parameter change. Intelligent Automation & Soft Computing, 31(1), 635–647. https://doi.org/10.32604/iasc.2022.019997
- Saghir, A., Aslam, M., Faraz, A., Ahmad, L., & Heuchenne, C. (2020). Monitoring process variation using modified EWMA. Quality and Reliability Engineering International, 36(1), 328–339. https://doi.org/10.1002/qre.2576
- Shanker, R., Fesshaye, H., & Selvaraj, S. (2015). On modeling of lifetimes data using exponential and lindley distributions. Biometrics & Biostatistics International Journal, 2(5), 140–147. https://doi.org/10.15406/bbij.2015.02.00042
- Shewhart, W. A. (1931). Economic control of quality manufactured product. D. Van Nostrand Company, Inc.
- Sukparungsee, S., Areepong, Y., & Taboran, R. (2020). Exponentially weighted moving average—moving average charts for monitoring the process mean. PLOS ONE, 15(2), https://doi.org/10.1371/journal.pone.0228208
- Taboran, R., Sukparungsee, S., & Areepong, Y. (2019). Mixed moving average – exponentially weighted moving average control charts for monitoring of parameter change. Proceedings of the International MultiConference of engineers and Computer scientists (IMECS 2019), Hong Kong, 13-15 March 2019.
- Taboran, R., Sukparungsee, S., & Areepong, Y. (2020). A New nonparametric Tukey MA-EWMA control charts for detecting mean shifts. IEEE Access, 8, 207249–207259. https://doi.org/10.1109/ACCESS.2020.3037293
- Taboran, R., Sukparungsee, S., & Areepong, Y. (2021). Design of a New Tukey MA-DEWMA control chart to monitor process and its applications. IEEE Access, 9, 102746–102757. https://doi.org/10.1109/ACCESS.2021.3098172
- Wong, H. B., Gan, F. F., & Chang, T. C. (2004). Designs of moving average control chart. Journal of Statistical Computation and Simulation, 74(1), 47–62. https://doi.org/10.1080/0094965031000105890
- Xie, Y., Ji, L., Li, L., Guo, Z., & Baker, T. (2021). An adaptive defense mechanism to prevent advanced persistent threats. Connection Science, 33(2), 359–379. https://doi.org/10.1080/09540091.2020.1832960
- Zaman, B., Riaz, M., Abbas, N., & Does, R. J. M. M. (2015). Mixed cumulative Sum-exponentially weighted moving average control charts: An efficient Way of monitoring process location. Quality and Reliability Engineering International, 31(8), 1407–1421. https://doi.org/10.1002/qre.1678
- Zhao, F., Zhang, L., Zhang, Y., Ma, W., Zhang, C., & Song, H. (2020). An improved water wave optimisation algorithm enhanced by CMA-ES and opposition-based learning. Connection Science, 32(2), 132–161. https://doi.org/10.1080/09540091.2019.1674247
Appendix
We provided an example of the proposed chart's covariance term.
Assume iid random sample.
set ,
,
and
are constant.
For t=1,
Thus,
For t=2,
Thus,
Consider
,
For t=5=w,
Thus,
Therefore, the covariance term of two control chart is defined as: