
 ?Mathematical formulae have been encoded as MathML and are displayed in this HTML version using MathJax in order to improve their display. Uncheck the box to turn MathJax off. This feature requires Javascript. Click on a formula to zoom.
ABSTRACT
Due to the complex maritime environment, communication satellite signals are inevitably subjected to various unpredictable situations which results in the noisy signal. To tackle the fickle ocean environment, we propose a novel scheme to extract and identify the fingerprint feature of communication satellite signals. K-means clustering algorithm is utilised to optimise the conventional Smooth Pseudo Wigner-Ville Distribution (SPWVD), which makes the final result of SPWVD closer to the feature of the original data and improves the accuracy of signal fingerprinting. Basing on the improved SPWVD, the singular value entropy is calculated by time-frequency analysis. Then, the entropy of diagonal slices is generated by the ameliorated bispectrum method which is enhanced by using the fractional low-order covariance method. Consequently, a two-dimensional signal fingerprint feature vector can be calculated. For the fingerprint feature recognition, the XGBoost classifier which is more efficient in machine learning classification is employed. Finally, we simulate the Iridium satellite signal for experiments with MATLAB. The experimental result shows the superiority of the improved SPWVD method and the improved bispectrum method, which proves the scheme's feasibility.
1. Introduction
Maritime communication has become an essential part of the communication service industry. With the rapid development of marine communication informatisation, various challenges have emerged. Poor data availability, insufficient data authenticity assurance, available channels, and weak encryption are tough nuts to crack under the open ocean network communication environment. Marine communication networks are used primarily on mobile platforms (aircraft, mobile buoys, ships), offshore and shore-based platforms, and offshore fixed platforms. In these application scenarios, the communication distance is relatively long, and only satellite and wireless communication can be used to achieve a communication guarantee. Therefore, it is necessary to explore a method of fingerprint feature extraction and identification of communication satellite signals based on the marine environment.
Signal recognition is an application of pattern recognition, so it can generally be summarised as three steps pattern recognition (Yu, Citation2010): first, pre-process the data, that is, perform preliminary processing on the original signal data, and map the signal from the signal space to the observation. The process mainly includes quadrature down-conversion, filtering, in-phase quadrature decomposition, carrier estimation, and elimination of carrier frequency components. Then perform signal feature extraction, map the signal data in the high-dimensional observation space to the low-dimensional observation space, and extract various features of the received signal. The most important thing is to choose valuable features. Finally, the classification decision is made. The basic concept of classification decision is to classify the identified target into a specific category through pattern recognition in the feature space. The classifier then identifies it according to the input signal fingerprint features. The process is divided into two steps: learning, looking for a suitable classification standard through known samples; the other is identifying, using the standard to design a classifier to realise the classification and identification of unknown types of signals.
With the development of time-frequency analysis methods, its performance is gradually improved. Many nonlinear analysis techniques are combined with signal processing (Z. Chen & Huang, Citation2011). Advanced signal processing techniques such as high-order spectrum (Yunusa-Kaltungo et al., Citation2015), wavelet packet transform (Adly et al., Citation2017; Medaiyese et al., Citation2022), and Hilbert transforms (Antunes et al., Citation2018; K. Huang et al., Citation2022) have been generated. There have also been various research improvements on the SPWVD method. Aiming at the problem of cross-term distribution in time-frequency distribution, methods such as MP-SPWVD (Fu et al., Citation2021) using matching pursuit and LMS (Meena et al., Citation2019) have appeared to suppress cross-terms. There is a CEEMD method (Wei et al., Citation2022; Zhao et al., Citation2020) in the noise reduction processing of SPWVD, which realises the noise removal in the signal. Under real conditions, the environment in which the signal is located is complex, and external factors easily affect the signal. At this time, the first-order and second-order statistics are not enough to fully represent the information carried by the signal. Higher-order statistics can represent more signal content. The methods of higher-order statistics have been applied in many fields. Bispectrum is also called the third-order cumulant spectrum. Bispectrum analysis based on high-order statistics can well suppress Gaussian white noise and is an effective method to solve nonlinear phase coupling (H. Chen et al., Citation2018; Nie et al., Citation2021; Sugiyama et al., Citation2019). At present, there are traditional bispectrum methods such as parametric AR bispectrum (Y.-J. Huang, Citation2011), parametric ARMA bispectrum (H.-B. Xu et al., Citation2012), and nonparametric bispectrum (Holdø et al., Citation2017; W. Zhang & Raghuveer, Citation1991). Later, some extensions to the traditional bispectrum methods have also appeared, such as deterministic bispectrum (Saidi, Citation2017), principal component bispectrum (Liu et al., Citation2017; R. Zhang & Tan, Citation2014), cyclic bispectrum (Zhou et al., Citation2012), and modulated signal bispectrum (Hassin et al., Citation2017; Rehab et al., Citation2016), fractional low-order direct bispectrum, and fractional low-order indirect bispectrum (Wang et al., Citation2020). Under the influence of artificial intelligence (Lin et al., Citation2016), the selection of signal features has also undergone great changes. Some entropy-based methods such as hierarchical entropy (Zhu et al., Citation2014), fuzzy entropy (Cánovas & Kupka, Citation2017), sample entropy (Marwaha & Sunkaria, Citation2016), approximate entropy (Xiong et al., Citation2010), hierarchical fuzzy entropy (Y. Li et al., Citation2016), and mixed entropy of different features (J. Xu et al., Citation2020) are proposed.
Signal recognition is based on feature extraction to determine the category of the signal. The existing classification algorithms are mainly related to classification algorithms in machine learning, such as Support Vector Machine (SVM) (M. Li et al., Citation2016), Artificial Neural Network (ANNs) (Ankalaki & Majumdar, Citation2015), Decision Tree (DT) (Fan et al., Citation2014), Back Propagation (BP) Neural Network, Probabilistic Neural Network (PNN) (Wu et al., Citation2019), etc. SVM is essentially a convex quadratic programming problem. The perceptron expansion mechanism is used to find the maximum interval classification hyperplane. Since SVM can use the kernel function, it can convert the nonlinear classification problem from low-dimensional to high-dimensional space for linearity. Therefore, it has unique advantages in solving issues such as small samples, nonlinearity, and high dimensionality. It can also use SVM to solve problems such as function fitting, has good generalisation ability, and can ensure local optimal solutions. The optimal global solution is consistent (Bi & Liu, Citation2016), effectively handling classification problems. ANNs training requires a large number of samples, and the generalisation ability is weak, which makes ANNs difficult in practical applications. The decision tree first finds a set of rules for the internal classification of data from the original chaotic and disordered sample data points. It expresses the rule method in a tree structure through recursion. It is judged from top to bottom until it is classified as a particular leaf node category, the internal node represents the discrimination rule, and the leaf node represents a specific category. The classification criteria of the decision tree classification method are intuitive and easy to understand, easy to explain, and have an extensive range of applications in the fields of machine learning and data mining. At present, it is a significant trend of future development in the field of signal processing to apply the mature classification algorithms in artificial intelligence theory to the area of signal processing to establish and discriminate signal types.
The main contributions of this work are summarised as follows:
To apply to the scenario of marine satellite communication, the improved SPWVD method and the improved bispectrum method are used as signal feature extraction methods.
The maritime communication satellite signal is processed by the SPWVD method, and after the spectrum is generated, it will be affected by noise. After using the k-means clustering method to process the spectrogram, the result of the SPWVD method can be closer to the original signal to denoise the signal.
According to the fractional low-order covariance method, improving the bispectrum method can make the improved bispectrum method also perform well in a stable α environment. Improve the environmental applicability of the bispectrum method, better handle the signal in the marine environment, and save the signal information more completely.
Finally, the experimental results are given. A classifier is trained for signal recognition using the decision tree-based XGBoost algorithm. Finally, the practicability of the fingerprint feature extraction and identification method of marine satellite signals is verified through the simulation test.
2. Signal fingerprint feature extraction principle
2.1. Principle of improved SPWVD method
SPWVD is improved based on Wigner-Ville Distribution (WVD). It can be understood as multiplying a time signal in the past and a time signal in the future and then performing a Fourier transformation on the time difference. In this process, the time-continuous signal appears twice, so it can also be called bilinear transform. However, in this process, the more components in the signal, the more cross terms will be generated, and the cross terms will significantly impact the time-frequency distribution. Pseudo Wigner-Ville Distribution (PWVD) performs basic WVD Windowing makes WVD localised, compressing the cross-term problem (K. Zhang, Citation2020) to a certain extent but also destroys some edge features of WVD. SPWVD is obtained by convolving WVD and smoothing function. Because the window function performs smoothing operations on time and frequency, the effect of eliminating cross terms is better, and it can also ensure the time-frequency characteristics and aggregation performance. The SPWVD method is derived as follows:
Define the WVD of the original signal as:
(1)
(1) Where t represents the time variable; σ represents the signal frequency; τ is the time delay;
represents the parameter factor of the Fourier transform;
is the conjugate of x.
The instantaneous auto-correlation theorem of the original signal is:
(2)
(2) Using the windowing function to smooth the WVD can suppress the generation of cross terms. The SPWVD distribution of the original signal
is:
(3)
(3) Where
and
are the window functions in time and frequency directions and u is the frequency delay.
2.2. Principle of K-means clustering algorithm
The similarity is the basis of clustering algorithms. The so-called clustering is to divide similar things into the same group. The properties of specific classes are not known during the process of the clustering algorithm. The ultimate goal of clustering algorithms is to group similar things. Clustering algorithms are mainly used to cluster numerical values. A variety of features are extracted from the data, and these features are formed into a multi-dimensional vector, representing a mapping from the original data to a multi-dimensional vector space, and then clustering and dividing according to the set method rules to ensure the similarity of the same group of data Sex is the greatest. Among the traditional clustering algorithms in machine learning, the K-means algorithm is the most widely used and relatively simple in the clustering algorithm.
The K-means algorithm is an unsupervised learning machine learning algorithm and a distance-based clustering algorithm. The basic idea of the K-means algorithm is to cluster all the samples to K central samples according to the clustering criteria according to the input K clustering target samples. Then judge whether the initial clustering is reasonable. If not, modify the clustering target sample. Iterate this process until the clustering result is good. Generally speaking, it is to classify each data point into the cluster class where the nearest cluster centre point is located. The specific steps are as follows:
Randomly select K data points as the central particles of the initial cluster;
For all sample data, use the Euclidean formula to calculate the distance from each sample data point to each cluster centre mass point and divide each sample data point into the class where the nearest mass centre is located.
(4)
K-means needs to update the centroid. K-means recalculates the mean of the sample data in each cluster and uses the resulting mean as the new cluster centroid of the cluster.
If no data sample is the same as the average, use the Euclidean formula to calculate the distance from the data sample to the average point, and use the data sample closest to the average point as the new cluster centroid.
If the change of the cluster centre does not exceed the preset threshold, it will converge. Otherwise, go to step (2). The condition for an algorithm to end is:
The principle of the K-means clustering algorithm is simple, the algorithm runs relatively fast, and it has certain scalability when dealing with large amounts of data.
2.3. Principle of improved SPWVD method
To solve the problem that the satellite communication signal unavoidably contains noise under the complex ocean environment, the traditional time-frequency analysis method is improved. In the improved SPWVD method, the k-means clustering method is combined to calculate a new SPWVD time-frequency map. Using the advantages of the machine learning clustering algorithm k-means, the time-frequency map obtained by the traditional SPWVD method is clustered. The original signal and noise are classified into different clusters to achieve the effect of denoising the signal, which can better approximate the characteristics of the signal without added noise. Improve the accuracy of subsequent signal recognition. Therefore, the improved SPWVD method can better express the features of the original signal and better adapt to various signal and noise conditions according to the way of adjusting the threshold. Therefore, the frequency filter constructed by the k-means clustering algorithm is adaptive to different signal environments. The specific steps of the SPWVD method combined with the k-means clustering algorithm are as follows:
First, perform PWVD time-frequency analysis on the received signal;
Use the windowing function to perform the smoothing operation on the result obtained by PWVD to obtain the SPWVD distribution;
Select the sample initialised in the SPWVD distribution as the initial cluster centre;
Calculate the distance from each sample in the SPWVD distribution data set to each cluster centre, and group it with the cluster centre with the smallest distance;
Recompute the cluster centres for each class;
Repeat steps (4) and (5) until the iteration number condition is reached;
According to a reasonable threshold, the denoised SPWVD distribution after K-means clustering is obtained.
The proposed improved SPWVD method based on k-means is described in Algorithm 1.
2.4. Principle of the bispectrum method
Higher-order statistics are random variables whose statistical order is greater than or equal to the third order. As the need for signal analysis increases, some signal analysis challenges also arise. There are many non-stationary signals in some practical scenarios, and traditional low-order statistics can no longer meet their analysis needs. Therefore, higher-order statistics are applied to the field of signal analysis. Compared with ordinary low-order statistics, high-order statistics can better preserve the phase information of signals in the process of signal processing and have a certain role in suppressing white Gaussian noise. According to these characteristics, compared with ordinary low-order statistics, high-order statistics have advantages in non-stationary signal processing.
The definition of the higher-order cumulant is the t-order derivative of the second characteristic function of the continuous random variable x at the origin, that is, the k-order cumulant of the continuous random variable x. For a continuous random variable x, its probability density function is . With
, then the expectation of
is:
(7)
(7) And when
,
takes the maximum value.
The second characteristic function can be obtained by performing the natural logarithm operation on the first characteristic function, namely:
(8)
(8)
is also known as the cumulant generating function because the kth derivative of
at the origin is the k-order cumulant of a continuous random variable:
(9)
(9) In the case of multiple continuous random variables, for n continuous random variables
, their joint probability density function is
. Then the first joint eigenfunction of n continuous random variables are:
(10)
(10) The second joint eigenfunction of n continuous random variables are:
(11)
(11) Perform the
order partial derivative operation on the above formula, and there is an r-order joint cumulant:
(12)
(12) Usually, the partial derivative order is
, then the n-order joint cumulant of n continuous random variables is:
(13)
(13) It can be known from the above that let the non-stationary random signal
be:
(14)
(14) Then it's k-order cumulant is:
(15)
(15) If the research object becomes a Gaussian random variable, it can be known through the above process that the odd and even orders of the high-order accumulation amount are both 0. Therefore, the high-order accumulators can suppress the Gaussian white noise to a certain extent.
These advantages make higher-order cumulants and their spectra an important tool in signal processing. The spectrum formed by higher-order accumulations is called multispectrum, also known as higher-order spectrum. Among them, when the order k = 3, it is the spectrum with the lowest order, called bispectrum. Because the higher the order of the high-order accumulation amount, the higher the computational complexity will be, which will affect the practicability of the actual scene application. Therefore, the bispectrum estimation method is the most commonly used in the analysis of high-order spectral signals, and it also has good performance in terms of performance. The following focuses on the definition of bispectrum:
Assuming that the mean of the signal is 0, and the third-order is a stationary random process, then its autocorrelation expression is:
(16)
(16) The power spectrum is defined as:
(17)
(17) The third-order accumulation of the signal
is:
(18)
(18) The bispectrum of the signal
can be defined as:
(19)
(19) The symmetry of the third-order cumulant of the signal
is defined as:
(20)
(20) From the definition of bispectrum and the symmetry of the accumulators in the three realms, we can see that bispectrum has the following properties:
Bispectrum preserves phase information.
The bispectrum is periodic, and the period is
Bispectrum has symmetry, there are:
2.5. Fractional low-order covariance bispectrum method principle
Bispectrum is also called the third-order cumulant spectrum. Bispectrum can suppress Gaussian white noise to a certain extent. The signal processed by bispectrum method results in a complex matrix containing the original signal information. Bispectrum has the advantages of scale invariance, time independence, phase preservation, and time shift invariance. However, the recognition effect is not ideal for a low signal-to-noise ratio. Moreover, in some scenarios with stable α distribution, the traditional bispectrum analysis method is not reliable. Based on the fractional low-order improved bispectrum method, this paper proposes a fractional low-order covariance bispectrum to improve the practicability of the bispectrum analysis method in scenarios. For signal processing in α stable distributed noise environment, the amplitude and phase information of the original signal can be better preserved.
The fractional low-order covariance of the original signal that obeys the α stationary distribution is defined as:
(24)
(24) Where
is defined as
.
The Fourier transform of is:
(25)
(25) Then the fractional low-order covariance of N sample data
is:
(26)
(26) From the relationship between correlation and convolution, the estimated value of self-fractional low-order covariance can be obtained as:
(27)
(27) At this time, if the Fourier transforms of
and
are
and
, then the above formula is performed Fourier transforms are:
(28)
(28) If A = B, then the above formula can also be expressed as:
(29)
(29) Let the total frequency sampling point of the signal be I, the sampling frequency is
, there is
. Then the fractional low-order covariance bispectrum of the original data
is:
(30)
(30) Among them,
,
, and
represent:
(31)
(31)
(32)
(32)
(33)
(33)
3. Signal fingerprint feature extraction method
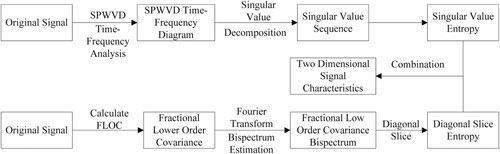
In this section, signal fingerprint feature design is based on two methods, SPWVD and fractional low-order covariance bispectrum. After the SPWVD algorithm decomposes the signal, the singular value decomposition is performed according to the obtained time spectrum, and then the singular value entropy is calculated. After the original signal is processed by the fractional low-order covariance bispectrum method, a bispectrum is generated, the obtained bispectrum is sliced diagonally, and then the fractional low-order covariance bispectrum diagonal slice entropy is calculated. Constructing eigenvectors combining marginal spectral entropy, singular value entropy, and fractional low-order covariance bispectrum diagonal slice entropy can be used for signal identification. Figure represents the specific steps.
Figure 1. Signal fingerprint feature extraction method.
3.1. Signal fingerprint feature extraction based on improved SPWVD
SPWVD is a widely used time-frequency analysis technology. The SPWVD time-frequency signal map can be obtained by performing an SPWVD transformation on the signal. There are slight gaps in frequency components between the SPWVD time-frequency maps of different signals so that the signal fingerprint features can be extracted from the SPWVD time-frequency maps of the signals. The gap between the SPWVD time-frequency maps of different signals can be used as the basis for signal fingerprint feature extraction. SVD is an effective method to extract the local features of the matrix, which can extract the intrinsic properties of the matrix data. It has the advantages of stability and translation time invariance. Therefore, this paper proposes to use the singular value decomposition method to extract the secondary features of the signal SPWVD time-frequency map.
This paper uses k-means to construct a frequency-domain filter, and an appropriate threshold is set to remove redundant frequency components in the spectrum and noise in the spectrogram. Finally, an SPWVD time-frequency map that expresses the original signal features more accurately is obtained. Since the obtained signal SPWVD time-frequency map is a two-dimensional image, it is not conducive to directly extracting the signal fingerprint features. Therefore, the SPWVD time-frequency diagram is firstly subjected to singular value decomposition to obtain the singular value vector of the signal SPWVD time-frequency diagram. Finally, the singular value vector is used to get the singular value. The value entropy, the singular value entropy, is used as the signal fingerprint feature. The specific steps to obtain the singular value entropy are as follows:
Perform SPWVD time-frequency processing on the acquired signal to obtain the SPWVD time-frequency diagram;
Perform k-means clustering on the original SPWVD time-frequency map, remove noise points, and generate an SPWVD time-frequency map with noise-removed data;
Perform singular value decomposition on the SPWVD time-frequency map of the denoised data to obtain a singular value sequence, normalise the singular value sequence to get
Find the singular value entropy:
There are differences in the singular value entropy of different satellite signals. The singular value entropy of each satellite signal does not overlap and has a good degree of discrimination. Therefore, the time-frequency diagram obtained by the signal SPWVD transformation can be decomposed into a singular value, and finally, the singular value can be obtained. Entropy acts as a signal fingerprint feature.
3.2. Signal fingerprint feature extraction based on fractional low-order covariance bispectrum
The bispectrum in the face of some environments, such as α stable distribution noise, the effect of the bispectrum will become less than ideal. A fractional low-order covariance bispectrum approach is proposed to solve the related problem. The bispectrum is obtained according to the fractional low-order covariance bispectrum, and then diagonal slices are performed to calculate the fractional low-order covariance bispectrum diagonal slice entropy, which can be used as a signal fingerprint feature. The specific steps to obtain the fractional low-order covariance bispectrum diagonal slice entropy are as follows:
Find the fractional low-order covariance of the acquired signal;
Fourier transforms the fractional low-order covariance of the original signal;
Obtain the fractional low-order covariance bispectrum according to the results in (2) and the bispectrum estimation method;
According to the bispectrum estimated matrix
Find the bispectrum diagonal slice
Calculate the diagonal slice entropy:
4. Identification method based on XGBoost algorithm
The Gradient Boosting Decision Tree (GBDT) algorithm first obtains the loss function through multiple rounds of iteration and then descends the obtained loss function along the gradient direction, combines the obtained classifier functions according to a certain weight, and finally form a strong classifier as the final predicted value output. Extreme Gradient Boosting (XGBoost) is an optimisation of GBDT. The network performs better than other algorithms or frameworks in unstructured data prediction problems, but in processing small and medium structured data, decision tree-based algorithms perform better (Dey et al., Citation2021; Hirayama et al., Citation2019).
XGBoost is based on Classification and Regression Tree (CART). The principle of CART is to divide the feature space into several units through continuous iteration of the binary tree. Each leaf node is the output of a feature unit. CART will be too detailed for the division of a training set feature space, leading to data set overfitting and poor generalisation ability.
The XGBoost algorithm solves the significant shortcomings of CART. XGBoost linearly combines multiple CARTs to form an integrated model. The fitting error of the previous tree is used as the fitting target of the next tree, and new regression trees are continuously added to promote the final predicted value. Approach known values. The specific process is as follows:
Initialisation, there is no tree in the model at this time:
Insert the first tree in the model:
Insert a second tree in the model:
Insert the tth tree in the model:
can be expressed as:
5. Simulation experiments and analysis
5.1. Communication satellite signal simulation
The communication mode of the current marine environment mainly relies on communication satellite terminals. Among them, the most widely used communication satellite terminal is the Iridium system. The system comprises a satellite constellation, system control station, and gateway station. Users can make voice calls worldwide through the equipped iridium satellite terminal. The satellite constellation of the Iridium system is composed of 66 low-orbit satellites operating in orbit at an altitude of 780 km, which can ensure that the Iridium satellites cover any location on the earth at any time. The iridium communication system mainly transmits the signal to the gateway station through the interstellar link, and the gateway station sends the signal to the ground telephone. This paper will simulate the iridium signal to carry out the fingerprint feature extraction and recognition experiment of communication satellite signals. The iridium star system adopts Quadrature Phase Shift Keying (QPSK) modulation method. QPSK is a digital modulation method. QPSK represents four binary combinations of 01, 00, 10, and 11 according to four initial phases. After the serial-to-parallel conversion of the data stream is performed according to the corresponding trigonometric function, it is divided into two channels, multiplied by cos and sin, respectively, and then superimposed to generate a QPSK signal. QPSK has high modulation efficiency, fast transmission rate, and strong anti-interference ability, so it is especially suitable for satellite channels with serious noise and attenuation.
QPSK specifies four carrier phases. In the modulation process, the binary baseband signal is first converted into serial/parallel and divided into two sequences of halving the rate. Then a level switcher is used to generate a bipolar two-voltage signal. The flat signals
and
have the same length. Then the in-phase carrier and the quadrature carrier are modulated, respectively, and the QPSK signal is obtained after adding the two. The expression is as follows:
(43)
(43)
represents the QPSK modulated signal obtained by vector sum addition. Figure shows two bipolar two-level signals and QPSK modulated signals simulated according to the QPSK modulation method. To simulate the marine satellite communication environment more realistically, the simulation experiment of the method of fingerprint extraction and identification of the communication satellite signal proposed in this paper is carried out better. With the
precondition, noise is added to the simulated signal. As Figure shows.
Figure 2. Simulated QPSK modulated signal.
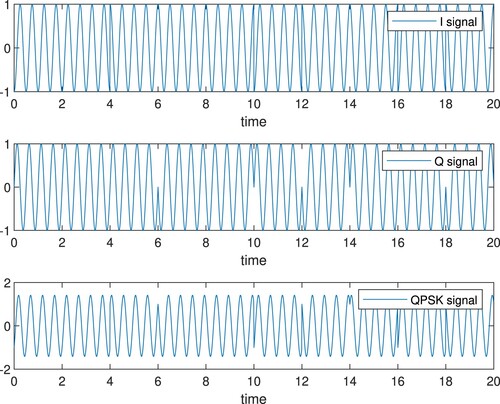
Figure 3. QPSK simulation signal with added noise.
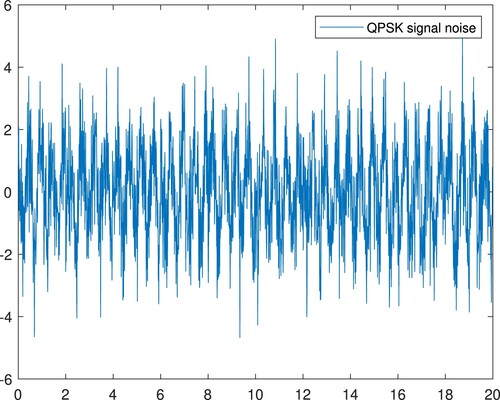
In the article, the difference in QPSK signal modulation mode is mainly reflected by changing the number of bits and the bit period. This difference can represent the difference and uniqueness of the simulated device. Then generate random simulated noise. The generated QPSK modulated signal is combined with random noise to generate the final simulated signal.
5.2. Experimental analysis of improved SPWVD method
The experiment will use the QPSK modulated signal to simulate the iridium communication better to simulate the satellite communication in the marine environment. Using the k-means algorithm to improve the SPWVD method can better remove the noise in the signal. It can make the signal's fingerprint characteristics closer to the original signal's fingerprint characteristics. In the complex and changeable marine environment, the influence of noise on signal recognition can be better excluded. Currently, the existing noise reduction methods applied to SPWVD are based on CEEMD and other methods. This paper will select the noise reduction method combined with CEEMD with better performance for comparison. And there are still many improved SPWVD methods that can suppress cross-terms' generation to varying degrees. The SPWVD improvement method based on the LMS improvement method will also be selected for comparison here. After using the three methods to generate the SPWVD time-frequency map, respectively. According to the signal feature extraction method proposed in this paper, the SPWVD time-frequency diagrams of the two methods are decomposed into singular values. The singular value entropy is calculated according to the singular value. The singular value entropy can indicate the uniformity of the signal feature distribution. The lower the singular value entropy, the more uniform the signal feature distribution. This paper shows the environment's signal-to-noise ratio is ,
, and
. The singular value entropy calculated using the three methods is compared with the singular value entropy of the original un-noised signal. The experimental results are shown in Table .
Table 1. Singular value entropy comparison.
As can be seen from Table , compared with the method based on CEEMD noise reduction, the LMS-based suppression cross-term method. The singular value entropy calculated according to the k-means-based SPWVD noise reduction method proposed in this paper is closer to the singular value entropy of the original signal without noise added, and the signal feature distribution after noise reduction is more uniform.
5.3. Experimental analysis of fractional low-order covariance bispectrum method
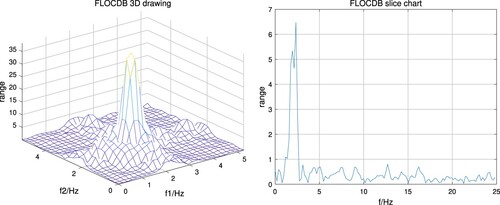
Using the fractional low-order covariance bispectrum method can improve the scene applicability of the bispectrum estimation method. This paper compares the fractional low-order covariance bispectrum method with the original bispectrum estimation method to verify the performance superiority of the fractional low-order covariance bispectrum method. Firstly, bispectrum estimation is performed on the simulated signal according to the method of bispectrum estimation. The bispectrum matrix is generated, then normalised, and the normalised bispectrum is diagonally sliced. Finally, the bispectrum diagonal slice entropy is calculated. Figure shows the 3D map and the slice map of the conventional bispectrum. In the same way, use the fractional low-order covariance bispectrum method proposed in the article to operate on the simulated signal and then normalise, slice diagonally, and calculate the entropy of diagonal slices. Fractional low-order covariance bispectrum three-dimensional map and slice map are shown in Figure .
Figure 4. Traditional bispectrum three-dimensional map, slice map.
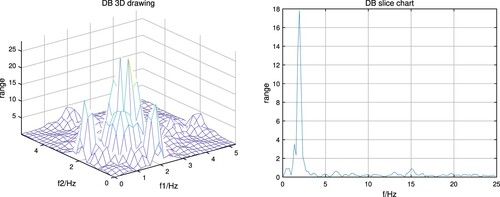
Figure 5. Fractional low-order covariance bispectrum three-dimensional map, slice map.
Then, when the signal-to-noise ratio is ,
, and
, the traditional bispectrum estimation method and the fractional low-order covariance bispectrum method are used for feature extraction. Then use the XGBoost classifier for training classification, and the results are shown in Table . It can be seen from the table that the fractional low-order covariance bispectrum method can improve the accuracy of the fingerprint identification of communication satellite signals.
Table 2. Comparison of accuracy rates of signal feature recognition.
5.4. Experiment analysis of communication satellite signal recognition based on maritime environment
To simulate the Iridium communication satellite signal, this study uses the QPSK signal modulation method to conduct a simulation experiment on the Iridium communication satellite signal to verify the fingerprint feature extraction and identification method of the communication satellite signal based on the marine environment proposed in this paper. According to the obtained singular value entropy combined with Fractional low-order covariance bispectrum diagonal slice entropy, a two-dimensional feature vector is formed, which is used as a signal fingerprint feature for the identification of the proposed method.
To verify the availability of the proposed method for fingerprint feature extraction of communication satellites in the marine environment, two different devices were simulated using the QPSK signal modulation method. The traditional SPWVD singular value entropy feature extraction method, the bispectrum diagonal slice entropy feature extraction method, the feature extraction method combining SPWVD singular value entropy and bispectrum diagonal slice entropy, fractional low order covariance bispectrum diagonal slice entropy method, and the method proposed in this paper are used for identification experiments. Then a comparative analysis was carried out, and the experimental results are shown in Table . From the results in Table , it can be known that the method proposed in this paper based on the fingerprint feature extraction and identification of communication satellite signals in the marine environment has a certain improvement in performance. And according to Table , it can also be known that the fingerprint feature extraction and identification method of communication satellite signal based on the marine environment can guarantee the accuracy of identification to a certain extent. Compared with the traditional bispectrum estimation method, the fractional low order covariance bispectrum significantly improves recognition accuracy. Therefore, the method of fingerprint feature extraction and identification of communication satellite signals based on the marine environment proposed in this paper is feasible.
Table 3. XGBoost recognition results.
6. Conclusion
The novel fingerprint extraction and recognition method can be applied to satellite communication scenarios in the marine environment. For the SPWVD time-frequency analysis method, the k-means algorithm is used for denoising, which can better express the characteristics of the original signal. It reflects the superiority of applying the machine learning K-means clustering algorithm to SPWVD. Then the singular value entropy is extracted from the SPWVD time-frequency map. The traditional bispectrum estimation method is improved, and the fractional low-order covariance method is used to solve the problem that the conventional bispectrum has a poor effect in the scene with a stable distribution of noise α, and improve the applicability of the bispectrum method. Finally, diagonal slices are performed according to the obtained bispectrum, and the entropy of the fractional low-order covariance bispectrum diagonal slice is calculated. And the two-dimensional signal fingerprint feature vector is constructed with the singular value entropy. Compared with the method based on CEEMD noise reduction, the SPWVD noise reduction method, based on k-means in this paper, shows that the signal feature distribution after noise reduction is more uniform. The improved SPWVD time-frequency analysis method can also better express the characteristics of the original signal. The scene applicability of fractional low-order covariance bispectrum is also better than that of traditional bispectrum estimation methods. At the same time, the feasibility of the fingerprint feature extraction and identification method of communication satellite signal based on the marine environment is proved by using the XGBoost algorithm.
Disclosure statement
The authors declare that they have no known competing financial interests or personal relationships that could have appeared to influence the work reported in this paper.
Additional information
Funding
References
- Adly, A. R., El Sehiemy, R. A., & Abdelaziz, A. Y. (2017). A novel single end measuring system based fast identification scheme for transmission line faults. Measurement, 103, 263–274. https://doi.org/10.1016/j.measurement.2017.02.041
- Ankalaki, S., & Majumdar, J. (2015). Leaf identification based on back propagation neural network and support vector machine. In 2015 International conference on cognitive computing and information processing (CCIP) (pp. 1–7). IEEE.
- Antunes, J., Debut, V., Piteau, P., Delaune, X., & Borsoi, L. (2018). On using the Hilbert transform for blind identification of complex modes: A practical approach. Journal of Sound and Vibration, 412, 222–241. https://doi.org/10.1016/j.jsv.2017.09.017
- Bi, F., & Liu, Y. (2016). Fault diagnosis of valve clearance in diesel engine based on bp neural network and support vector machine. Transactions of Tianjin University, 22(6), 536–543. https://doi.org/10.1007/s12209-016-2675-1
- Cánovas, J. S., & Kupka, J. (2017). On fuzzy entropy and topological entropy of fuzzy extensions of dynamical systems. Fuzzy Sets and Systems, 309, 115–130. https://doi.org/10.1016/j.fss.2015.12.013
- Chen, H., Zehni, M., & Zhao, Z. (2018). A spectral method for stable bispectrum inversion with application to multireference alignment. IEEE Signal Processing Letters, 25(7), 911–915. https://doi.org/10.1109/LSP.2018.2831631
- Chen, Z., & Huang, Y. (2011). Fault diagnosis of ultrasonic motor using ar bispectrum. Journal of Central South University, 42(12), 3728–3734.
- Dey, A., Rahman, M., Ratnam, D. V., & Sharma, N. (2021). Automatic detection of GNSs ionospheric scintillation based on extreme gradient boosting technique. IEEE Geoscience and Remote Sensing Letters, 19, 1–5. https://doi.org/10.1109/LGRS.2021.3091700
- Fan, G., Yu, B., Chao, L., & Deng, Z. (2014). Design of interference recognition and classification filter of satellite navigation electromagnetic environment. Journal of Systems Engineering and Electronics, 36(02), 234–238.
- Fu, X., Yu, J., Dai, L., Liu, J., Huang, J., & Ren, W. (2021). Cross-term suppression method for time-frequency spectrum of engineering blasting signals. Journal of Testing and Evaluation, 50(1). https://doi.org/10.1520/JTE20210094
- Hassin, O., Yao, A., Zhang, H., Gu, F., & Ball, A. (2017). Predicting oil film performance in a journal bearing based on modulation signal bispectrum analysis of vibration signals. International Journal of COMADEM, 20(3), 19–24.
- Hirayama, H., Sharma, R. C., Tomita, M., & Hara, K. (2019). Evaluating multiple classifier system for the reduction of salt-and-pepper noise in the classification of very-high-resolution satellite images. International Journal of Remote Sensing, 40(7), 2542–2557. https://doi.org/10.1080/01431161.2018.1528400
- Holdø, I., Bramness, J., Handal, M., Hansen, B., Hjellvik, V., & Skurtveit, S. (2017). Infants with sleep problems have increased risk of ADHD. Sleep Medicine, 40(1), e132. https://doi.org/10.1016/j.sleep.2017.11.387
- Huang, K., Guo, Z., Ye, J., & Peng, Y. (2022). A method for extracting fingerprint feature of communication satellite signal. Wireless Communications and Mobile Computing, 2022. https://doi.org/10.1155/2022/7796017
- Huang, Y.-J. (2011). Ar bispectrum analysis of block forming machine's hydraulic vibrate signals. China Mechanical Engineering, 22(16), 1954–1959. http://www.cmemo.org.cn/EN/Y2011/V22/I16/1954
- Li, M., Li, S., & Huang, X. (2016). Communication jamming recognition based on improved SVM. Modern Electronics Technique, 39(24), 26–29. https://doi.org/10.16652/j.issn.1004-373x.2016.24.007
- Li, Y., Xu, M., Zhao, H., & Huang, W. (2016). Hierarchical fuzzy entropy and improved support vector machine based binary tree approach for rolling bearing fault diagnosis. Mechanism and Machine Theory, 98, 114–132. https://doi.org/10.1016/j.mechmachtheory.2015.11.010
- Lin, Y., Wang, C., Wang, J., & Dou, Z. (2016). A novel dynamic spectrum access framework based on reinforcement learning for cognitive radio sensor networks. Sensors, 16(10), 1675. https://doi.org/10.3390/s16101675
- Liu, Z., Dou, W., & Wang, X. (2017). Fault diagnosis approach based on principal component bispectrum analysis and support vector machine for rotating machinery. Journal of Vibration and Shork, 26(12), 23–27. https://doi.org/10.13465/j.cnki.jvs.2007.12.035
- Marwaha, P., & Sunkaria, R. K. (2016). Complexity quantification of cardiac variability time series using improved sample entropy (i-sampen). Australasian Physical & Engineering Sciences in Medicine, 39(3), 755–763. https://doi.org/10.1007/s13246-016-0457-7
- Medaiyese, O. O., Ezuma, M., Lauf, A. P., & Guvenc, I. (2022). Wavelet transform analytics for RF-based UAV detection and identification system using machine learning. Pervasive and Mobile Computing, 82, 101569. https://doi.org/10.1016/j.pmcj.2022.101569
- Meena, P., Sharma, R. R., & Pachori, R. B. (2019). Cross-term suppression in the Wigner-Ville distribution using variational mode decomposition. In 2019 5th International conference on signal processing, computing and control (ISPCC) (pp. 323–328). IEEE.
- Nie, W., Han, Z.-C., Zhou, M., Xie, L.-B., & Jiang, Q. (2021). UAV detection and identification based on Wifi signal and RF fingerprint. IEEE Sensors Journal, 21( 12), 13540–13550. https://doi.org/10.1109/JSEN.2021.3068444
- Rehab, I., Tian, X., Zhang, R., Gu, F., & Ball, A. (2016). A Study Of The Diagnostic Amplitude Of Rolling Bearing Under Increasing Radial Clearance Using Modulation Signal Bispectrum. COMADEM 2016, the 29th International Congress on Condition Monitoring and Diagnostic Engineering Management, Empark Grand Hotel in Xi'an, China, 20th-22nd August 2016. https://eprints.hud.ac.uk/id/eprint/29477
- Saidi, L. (2017). The deterministic bispectrum of coupled harmonic random signals and its application to rotor faults diagnosis considering noise immunity. Applied Acoustics, 122, 72–87. https://doi.org/10.1016/j.apacoust.2017.02.007
- Sugiyama, N. S., Saito, S., Beutler, F., & Seo, H.-J. (2019). A complete FFT-based decomposition formalism for the redshift-space bispectrum. Monthly Notices of the Royal Astronomical Society, 484(1), 364–384. https://doi.org/10.1093/mnras/sty3249
- Wang, H., Long, J., Liu, Z., & You, F. (2020). Fault characteristic extraction by fractional lower-order bispectrum methods. Mathematical Problems in Engineering, 2020.https://doi.org/10.1155/2020/8823389
- Wei, J., Yu, L., Zhu, L., & Zhou, X. (2022). RF fingerprint extraction method based on Ceemdan and multidomain joint entropy. Wireless Communications and Mobile Computing, 2022.https://doi.org/10.1155/2022/5326892
- Wu, X., Shi, Y., Meng, W., Ma, X., & Fang, N. (2019). Specific emitter identification for satellite communication using probabilistic neural networks. International Journal of Satellite Communications and Networking, 37(3), 283–291. https://doi.org/10.1002/sat.v37.3
- Xiong, G.-l., Zhang, L., Liu, H.-s., Zou, H.-j., & Guo, W.-z. (2010). A comparative study on apen, sampen and their fuzzy counterparts in a multiscale framework for feature extraction. Journal of Zhejiang University Science A, 11(4), 270–279. https://doi.org/10.1631/jzus.A0900360
- Xu, H.-B., Chen, G.-H., & Wang, X.-H. (2012). Fault identification of bearings based on bispectrum distribution of ARMA model and FCM method. Huanan Ligong Daxue Xuebao/journal of South China University of Technology, 40(7), 78–82.
- Xu, J., Ying, S., & Li, H. (2020). GPS interference signal recognition based on machine learning. Mobile Networks and Applications, 25(6), 2336–2350. https://doi.org/10.1007/s11036-020-01608-1
- Yu, B. (2010). Research on interference type recognition in DSSS communication systems. In Information engineering university.
- Yunusa-Kaltungo, A., Sinha, J. K., & Nembhard, A. D. (2015). Use of composite higher order spectra for faults diagnosis of rotating machines with different foundation flexibilities. Measurement, 70, 47–61. https://doi.org/10.1016/j.measurement.2015.03.041
- Zhang, K. (2020). Fingerprint feature extraction of radar signal and individual identification of radiation source. In University of electronic science and technology of China.
- Zhang, R., & Tan, Y. (2014). Intelligent fault diagnosis of rolling element bearings based on bispectrum principal components analysis. Journal of Vibration Engineering, 27(5), 763–769. https://doi.org/10.16385/j.cnki.issn.1004-4523.2014.05.007
- Zhang, W., & Raghuveer, M. (1991). Nonparametric bispectrum-based time-delay estimators for multiple sensor data. IEEE Transactions on Signal Processing, 39(3), 770–774. https://doi.org/10.1109/78.80872
- Zhao, Y., Feng, Z., & Zhu, X. (2020). Condition identification of buried drainage pipeline based on Ceemdan-de and time-frequency images recognition. In 2020 Chinese control and decision conference (CCDC) (pp. 1183–1189). IEEE.
- Zhou, Y., Chen, J., Dong, G., Xiao, W., & Wang, Z. (2012). Fault diagnosis of rolling element bearing based on cyclic bispectrum. Journal of Vibration and Shock, 31(9), 78–81. https://doi.org/10.13465/j.cnki.jvs.2012.09.016
- Zhu, K., Song, X., & Xue, D. (2014). A roller bearing fault diagnosis method based on hierarchical entropy and support vector machine with particle swarm optimization algorithm. Measurement, 47, 669–675. https://doi.org/10.1016/j.measurement.2013.09.019