
 ?Mathematical formulae have been encoded as MathML and are displayed in this HTML version using MathJax in order to improve their display. Uncheck the box to turn MathJax off. This feature requires Javascript. Click on a formula to zoom.
Abstract
This paper introduces a malware detection method based on the reorganisation of API instruction sequence and image representation in an effort to address the challenges posed by current methods of malware detection in terms of feature extraction and detection accuracy. In the first step, APIs of the same type are grouped into an API block. Each API block is reorganised according to the first invocation order of each type of API. As a measure of the API's devotion to the software sample, the number of API block entries is recorded. Second, the API codes, API devotions, and API sequential indexes are extracted based on the reorganised API instruction sequence to generate the feature image. The feature image is then fed into the self-built lightweight malware feature image convolution neural network. The experimental results indicate that the detection accuracy of this method is 98.66% and that it has high performance indicators and detection speed for malware detection.
1. Introduction
Malware is software created by an attacker specifically to gain unauthorised access to a computer and damage or destroy it. According to the statistics of authoritative organisations, the number of terminals infected with malware in China in May 2022 has reached 4.78 million, the number of counterfeit website pages has reached 16,540, and nearly 90% of the vulnerabilities are used to implement remote attacks that can steal information and cause significant harm to businesses and individuals (Miao et al., Citation2021). The prevalence of malware has posed a grave threat to network security. Once national industrial systems are compromised, a large amount of information regarding the cyber assets of critical information and networked control systems will be leaked, posing hidden threats to the security of the national industrial sector (Cai et al., Citation2022). Therefore, it is economical to detect the malware at the early stage to reduce the damage by it (Gaurav et al., Citation2022), and it is imperative to conduct research on malware detection methods.
Static detection techniques and dynamic detection techniques constitute the two primary categories of traditional malware detection methods. Static detection techniques detect malware without executing it (Potha et al., Citation2021), but they can only detect already existing malware. Dynamic detection techniques, on the other hand, can detect unknown malware more effectively by executing it, but at the expense of more system resources.
Malware detection based on conventional machine learning techniques has a complex feature selection and extraction process (Qiu et al., Citation2020). In recent years, it has been discovered that feature images of different samples of similar malware share similarities in colour, texture, and layout, and the method based on image representation generates new ideas for malware detection research. Cui et al. (Citation2018) transformed malware source codes into greyscale images and classified the greyscale images using a convolution neural network (CNN). Zhu et al. (Citation2021) converted the global structure information of malware executable files into greyscale images, extracted the opcode semantic information of code segments to generate opcode images, and then used a CNN to detect malware. Chaganti et al. (Citation2022) used EfficientNet convolutional neural networks to convert byte malware files into greyscale images for effective malware classification. Pinhero et al. (Citation2021) transformed malware into greyscale, RGB, and Markov images and analyzed the images’ textures using Gabor filters. Vasan et al. (Citation2020) converted malware binaries to RGB images for improved CNN malware detection. Jian et al. (Citation2021) converted malware byte files to RGB images and used deep neural networks to detect malware. Tekerek and Yapici (Citation2022) transformed the bytes files into grey and RGB images for classification and proposed a new CycleGAN-based data augmentation method to address the issue of unequal data size among malware families. O’Shaughnessy and Sheridan (Citation2022) employed the space-filling curve to map the binary files of malware and to produce RGB images for malware detection.
Greyscale images were used as malware feature images by researchers (Chaganti et al., Citation2022; Cui et al., Citation2018; Zhu et al., Citation2021). However, compared to RGB images, greyscale images have the downsides of difficulty in identifying cross-sectional distribution information and a reduced amount of information (Xiao et al., Citation2021). Researchers(Jian et al., Citation2021; O’Shaughnessy & Sheridan, Citation2022; Pinhero et al., Citation2021; Tekerek & Yapici, Citation2022; Vasan et al., Citation2020) selected static features when constructing malware feature images, but the number of static features is large and usually requires manual screening (Han et al., Citation2019), making it difficult to intuitively reflect the behaviour of programmes compared to dynamic features that contain rich semantic information and can intuitively (Wang et al., Citation2021).
To address the above challenges, and to detect malware accurately and effectively, this paper presents a malware detection method based on the visualisation of the recombined API instruction sequence, and the contributions of this paper are as follows.
We present a method for recombining API instruction sequences. APIs are aggregated by category into API blocks (ABlocks), which are then reordered according to the order of each API type's initial invocation (AOrder). Upon completion of the grouping refactoring, the ABlocks are arranged according to the AOrder records. The internal APIs for each ABlock are organised in the order in which a single API is called by the software. Ordered ABlocks facilitate the visualisation of API instruction sequence data. Each ABlock displays regionalised colour and texture characteristics on the feature image, which aids the classifier in detecting and classifying objects.
We present a method for representing malware images. Based on ABlocks after grouping refactoring, the API codes, API devotions, and API sequential indexes are extracted to fill the 3 channels of a feature image of API code devotion and sequential index(ImgCDS). Among them, API code can identify API categories clearly, API devotion can indicate the frequency of API calls, and API sequential index can distinguish the order in which each API is called.
We present a lightweight malware feature image convolutional neural network (MimgNN) to detect malware feature images. Compared with classical CNNs, MimgNN has fewer network layers and fewer parameters, effectively reduces the computing resources and time overhead of classifying malware feature images, and can detect malware categories more efficiently and timely.
2. Related work
APIs can best reflect the behaviour of malware and are crucial for detecting malware (Wang et al., Citation2021). The Windows APIs are a comprehensive collection of functions that manage malware's interaction with Microsoft libraries. Each type of APIs has corresponding functionality, such as CreateFile for creating and opening files, RegGetValue for returning the value of a data item in the registry, InternetOpenUrl for accessing URLs, and CreateProcess for creating remote shells. Therefore, malware feature extraction based on API instruction sequence plays an important role in malware detection. Specifically, as shown in Table , we focus on the detection of malware based on API instruction sequence using the same dataset over the last three years.
Table 1. Outline of the related work.
Chen et al. (Citation2020) select the 300 most commonly used APIs from the dataset, and divide them into 17 categories according to their functional characteristics and the degree of harm to the system. Based on the semantics and structural features extracted from the classified API sequences, a malware detection method based on a sliding local attention mechanism(SLAM) is built to detect malware. Xu et al. (Citation2020) merge the thread call sequences of each software into strings based on the file names and vectorise the strings to generate thread vector sequences. Then, the API sequence is truncated according to the length of the thread vector sequence, a long short-term memory(LSTM) network is used to extract the time series features, and a CNN classifier is output to detect the categories of malware. Screening common APIs and truncating API sequences, while both focusing on the information that accounts for the largest proportion of global information, can still cause a loss of API information. People rely excessively on expert knowledge to classify APIs, which necessitates a great deal of manual screening and input in preprocessing data (Yang et al., Citation2022a). To avoid losing API call information and to solve the problem that traditional malware detection methods rely on expert knowledge for feature extraction, which necessitates extensive manual filtering, all API categories are numbered in this paper.
Ma et al. (Citation2019) hold that most malware originates from benign software infected by malicious software such as viruses, and only a small part of the code sequence is malicious, i.e. malware code has local malicious nature. Based on it, researchers cut the whole API sequence into N-length API fragments and classify the API fragments using the LSTM model. Although local characteristics can reflect the behaviour of malware to a certain extent, the way in which malware interacts with the system is complex, such as creating modification files, modifying registries, communicating with the network, creating or modifying processes to execute code outside the current programme, etc. Only considering local characteristics and ignoring global characteristics cannot capture the full malicious intent of the software. This paper intends to extract the features of malware from the global, local and temporal perspectives, in order to solve the shortcomings of traditional malware detection and classification methods with single feature categories and only consider local or global features.
Zhang et al. (Citation2020) encode API instruction information as a graph structure, each API is a node, and the edges between nodes represent the connections between APIs. The features of API graph structure are extracted using a gating mechanism and graph convolution neural networks(GCN) to detect malware. Chai et al. (Citation2020) constructed a stacked CNN to capture the local and global semantic characteristics of API call sequences and design a joint framework based on local and global features for malware detection (LGMal), which combines CNN and GCN for malware detection. However, the GCN model is complex, and the feature extraction consumes a significant amount of computing resources. In this paper, image-based representation is used to represent the features of malware, and a lightweight CNN is used to detect the feature images to reduce the computational cost of the system. At the same time, we intend to use various image enhancement methods to enhance malicious software feature images to suppress data imbalance.
3. Overview of the malware detection method
3.1. Method architecture
The general architecture of the malware detection method is shown in Figure . The method includes four stages: sample preprocessing, feature extraction, image processing, and image classification.
Figure 1. The architecture of the malware detection method.
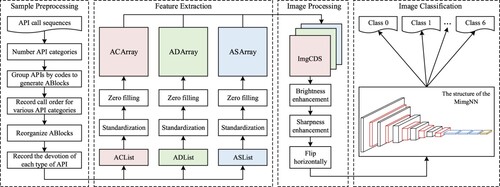
The processing process of each stage is designed as follows:
Sample preprocessing stage: Firstly, all the APIs in the dataset are numbered uniformly, and APIs with the same code are aggregated into an ABlock. Then, all the ABlocks are reordered according to the AOrder. Finally, the number of entries of the ABlock is set as the devotion of the API to the software sample.
Feature extraction stage: The API code list(ACList), API devotion list(ADList), and API sequential index list(ASList) corresponding to the software sample are extracted. Then the lists are normalised and zero-populated into feature arrays of the same size, which are called API code array(ACArray), API devotion array(ADArray), and API sequential index array(ASArray).
Image processing stage: The R channel is filled with ACArray, the G channel with ADArray, and the B channel with ASArray to generate an ImgCDS image. Then the image enhancement methods such as brightness enhancement, sharpness enhancement, and horizontally flip are performed to expand the number of samples and suppress the data imbalance problem between different kinds of software samples.
Image classification stage: The ImgCDS image is input into the MimgNN classifier to output the detection probability that the feature image belongs to each software category.
3.2. Method analysis
During feature extraction, API code is a global feature that identifies the category of an API and reflects all APIs invoked by the malware globally. As a local feature, API devotion can effectively represent the frequency of invocation of a specific type of API, and reflect the main system interaction activities of the malware. Based on the global API invocation information, it can reflect the main malicious intentions of the malware from the perspective of local characteristics. As a time series feature, API sequential index can effectively distinguish the order in which each API is invoked and describe the order in which malware performs various types of interactive activities from a time series perspective.
After the API instruction sequence is grouped and reconstructed, the same APIs are aggregated into an Ablock. Each ABlock reflects the regionalised colour and texture features on the feature image and has a clear structure, which helps the classifier detect and classify the feature image.
The 3-channel ImgCDS feature image contains three types of malware features, which can reflect the behaviour of the software from multiple perspectives. Meanwhile, ImgCDS feature images are processed by horizontal flip technology without changing the texture and colour characteristics of the original feature images. The number of feature images is expanded so that the classifier can learn the features from a sufficient number of image samples to improve the detection effect.
Compared with traditional non-image detection methods, this method considers the particularity of image structure in the process of numbering each type of API. Mapping API codes to image pixel values with the range of (0, 255] can eliminate the need for human classification of the API and extract finer-grained API features. In traditional detection methods, the extraction of long-time series features is hampered by the excessive content of the feature vectors that the classifier processes, which reduces the efficiency of detection.
4. Sample preprocessing
First, count the types of APIs called by the software sample and number each API type. Then the APIs with the same code are aggregated into an ABlock, and the number of entries in the ABlock is set as the devotion of that API to that software sample. Finally, the order in which each type of API was first called by this software sample is recorded as AOrder, and each ABlock is reordered according to the AOrder. The reorganisation of API instruction sequences is shown in algorithm 1.
The dataset used in this study is the malicious programme detection contest dataset provided by Aliyun (Zhang et al., Citation2020), and the software samples in this dataset have called 295 types of APIs, and the integers in the range of [0, 294] are used to number the types of APIs.
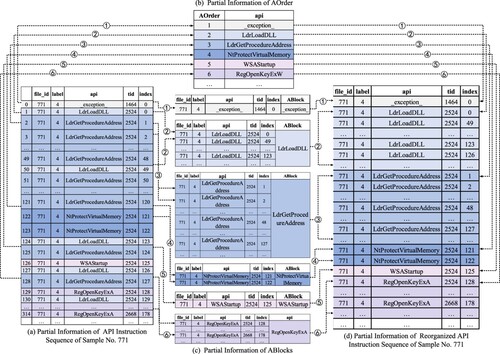
The API instruction sequence reorganisation process for the software sample with the file ID(file_id) 771 is shown in Figure . Among them, the (a) figure shows part of the API instruction sequence information of the No.771 software sample, recording the file_id, the category of the software sample(label), the name of API(api), the thread ID(tid) that calls the corresponding API, and the index(index) of the API in the corresponding thread. (b) figure shows part of the AOrder information of the software sample. (c) figure shows part of the ABlocks information of the software sample. (d) figure shows the partial API instruction sequence information after API restructuring.
Figure 2. An example of the API instruction sequence reorganisation process.
Table
Labels represent the reorganisation of the first 6 types of APIs invoked by the software sample. Taking labels
and
as an example,
indicates that the first type of API invoked by the software is the _exception_. Record the _exception_ in the AOrder, and numbered 1, indicating that the _exception_ is the first type of API called by this software sample; Then count the total times of invocations of _exception_ by this software sample, which is 1, then aggregate the _exception_ and related information into an ABlock, and the number of entries of this ABlock is 1.
indicates that the second type of API called by this software is the LdrLoadDLL. Record the LdrLoadDLL in AOrder with the number 2; Then count the total number of calls to the LdrLoadDLL, which is 48, then aggregate all LdrLoadDLLs and related information into an ABlock, and the number of entries of the ABlock corresponding to LdrLoadDLL is 48. After all APIs are recorded in ABlocks, the API instruction sequence is reorganised according to the information recorded by AOrder and ABlocks.
5. Feature extraction
Features are the essential characteristics of a class of objects that distinguish them from other classes of objects(Yang et al., Citation2022b). Feature extraction refers to learning and mining non-redundant derived values from the original data that reflect the characteristics, which can facilitate the learning and generalisation steps of the model and bring better interpretability. In the feature extraction stage, firstly, extract the ACList, ADList, and ASList from the reconstructed API instruction sequence, and then normalise and zero-populate the lists into two-dimensional feature arrays of uniform size, denoted as ACArray, ADArray, and ASArray.
5.1. The ACArray generation process
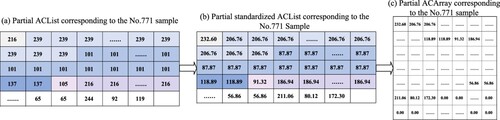
Extract the API code feature as the global feature based on the reorganised API instruction sequence, which is recorded as ACArray. First, query the corresponding codes of APIs in each ABlock; Then record the API codes corresponding to the reorganised API instruction sequence as an ACList and standardise the values of it; Finally, the standardised ACList is zero-filled and transformed into an ACArray with a size of 128 × 128. The standardisation of the ACList is calculated by the formula (1):
(1)
(1) where Anum is the number of API types; Acode is the code of the API, and the value range is [0, Anum-1]; Ancode is the standardised Acode, and the value range is (0, 255].
The process of generating an ACList of the software sample is shown in Figure . The symbols -
indicate the process of generating the ACList for the first six types of ABlocks corresponding to the software sample after the reorganisation of the API instruction sequence.
Figure 3. An example of the ACList generation process.
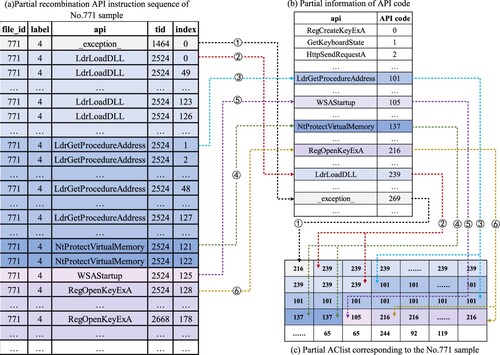
In Figure , indicates that the first type of ABlock called by the software sample is the _exception_, and the code of the _exception_ is 269, and record 269 to ACList; The number of entries of this ABlock is 1, and the recording process of
occurs once.
indicates that the second type of ABlock called is the LdrLoadDLL, its code is 239, and 239 is recorded to ACList; The number of entries of this ABlock is 48, and the recording process of
is repeated 48 times until all the corresponding codes of LdrLoadDLL in the ABlock are recorded in ACList.
The process of generating an ACArray from the ACList is shown in Figure . (a) figure represents the ACList of the software sample; (b) figure represents the result of normalising the ACList using formula (1); (c) figure represents the process of zero-padding the normalised ACList and transforming it into the ACArray of size 128 × 128.
Figure 4. An example of the ACArray generation process.
5.2. The ADArray generation process
Extract the API devotion feature as the local feature based on the reorganised API instruction sequence, which is recorded as ADArray. First, count the number of entries of each ABlock and record it as the API devotion; Then record the API devotions corresponding to the reorganised API instruction sequence as an ADList, and standardise the values of it; Finally, the standardised ADList is zero-filled and transformed into an ADArray with a size of 128 × 128. The standardisation of the ADList is calculated by the formula (2):
(2)
(2) where Adev is the devotion of each API; max(Adev) is the maximum value of Adev; Andev is the normalised Adev, and the value range is (0, 255].
The process of generating the ADList of the software sample is shown in Figure . The symbols -
indicate the process of generating an ADList for the first six types of ABlocks corresponding to the software sample after the reorganisation of the API instruction sequence. The process of generating the ADArray from ADList of the software sample is shown in Figure .
Figure 5. An example of the ADList generation process.
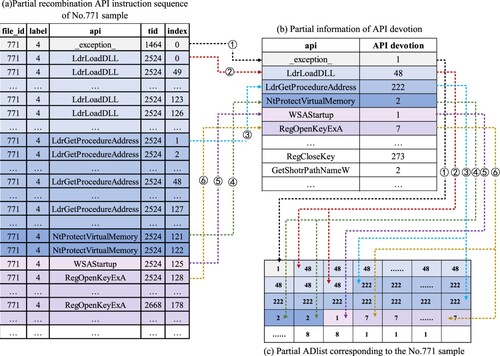
Figure 6. An example of the ADArray generation process.
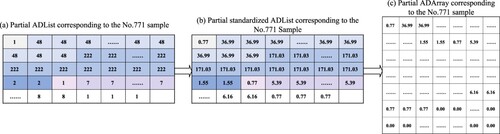
In Figure , indicates that the first type of ABlock invoked by the software sample is the _exception_, and the number of the corresponding ABlock entries is 1. Therefore, the devotion of the _exception_ to the software sample is 1, which means that the software sample calls the _exception_ once.
indicates the second type of ABlock called by the software is the LdrLoadDLL, and its corresponding number of ABlock entries is 48, so the devotion of the LdrLoadDLL to the software is 48.
5.3. The ASArray generation process
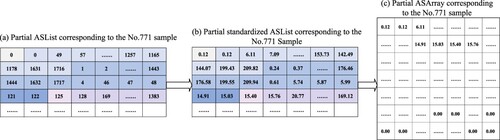
The API sequential index feature is extracted as the time-series feature based on the reorganised API instruction sequence, which is denoted as ASArray. First, the API sequence indexes corresponding to the reorganised API instruction sequence are recorded as ASList, then the ASList is standardised and zero-filled. Finally, the ASList is transformed into an ASArray with a size of 128 × 128. The standardisation of the ASList is calculated by the formula (3):
(3)
(3) where Aseq is the API sequential index value, and the value range is [0, max(Aseq)]; max(Aseq) is the maximum API sequence index value; Anseq is the normalised Aseq, and the value range is (0, 255].
The process of generating the ASList of the software sample is shown in Figure . The symbols -
indicate the process of generating the ASList of the first six types of ABlocks corresponding to the software sample. And the process of generating the ASArray from ASList of the software sample is shown in Figure .
Figure 7. An example of the ASList generation process.
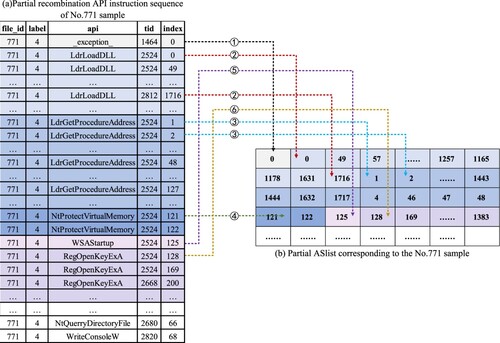
Figure 8. An example of the ASArray generation process.
In Figure , shows that the first type of ABlock called by the software sample is the _exception_, its corresponding index is 0, and record 0 to the ASList.
indicates that the second type of ABlock called by the software sample is the LdrLoadDLL, its corresponding indexes are 0, 49, 57, … , 1716, … , and the indexes are recorded in the ASList.
6. Image processing
6.1 Image generation
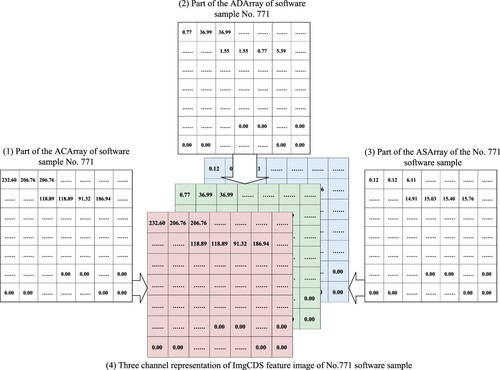
Fill three channels of the RGB image with three types of malware feature arrays to generate the ImgCDS feature image. The filling method is to fill the R channel of the ImgCDS feature image with the ACArray feature array, the G channel with the ADArray feature array, and the B channel with the ASArray feature array. The filling order starts from left to right and from top to bottom, the channel size is 128 × 128. The ImgCDS images of each type of software in the dataset are shown in Figure , and the generation process of the ImgCDS feature image is shown in Figure .
Figure 9. ImgCDS images for each software category.
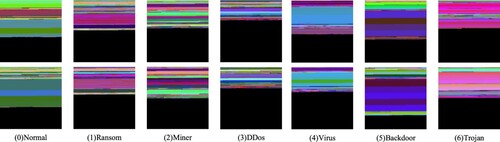
Figure 10. Example of ImgCDS image generation process.
6.2. Image enhancement
In deep learning, to avoid overfitting, sufficient data is usually needed to train the model. Besides, when the number of samples of a class is small, the ratio of classes is imbalanced, and then data enhancement is needed to expand the number of samples for a few classes(Yang et al., Citation2021). For image datasets, researchers usually use techniques such as rotation, scaling, flipping, random cropping, and colour transformations for image enhancement.
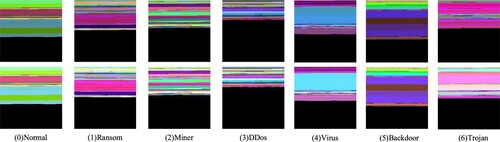
In this paper, brightness enhancement and sharpness enhancement methods are used to enhance the ImgCDS images of each software category. At the same time, the number of Ransom and Backdoor samples in the dataset is small, which are minority samples, and the sample distribution of the dataset is unbalanced. To solve this problem, we use the horizontal flipping method to process the ImgCDS images of the above two types of samples to increase the number of corresponding types of samples. The ImgCDS images of various types of the software after image enhancement are shown in Figure .
Figure 11. The example of ImgCDS images before and aftert after image enhancement.
7. Image classification
Deep learning techniques have played an increasingly significant role in malware classification over the past decade (D'Angelo et al., Citation2021). The use of neural networks enables the automatic extraction of features with multiple levels of abstraction and a higher level of generalisation than traditional machine learning approaches (Lin et al., Citation2020; Yang & Feng, Citation2021). CNN is one of the typical models in the field of deep learning. It is trained on a large amount of data to achieve accurate and stable detection results by learning image pixels (Zhang et al., Citation2021). Layers of convolution facilitate the learning of abstract and highly non-linear patterns, capture the intrinsic structure of complex data, and achieve automatic feature extraction. MimgNN is a lightweight CNN designed to detect ImgCDS images. The network architecture of MimgNN is depicted in Figure .
Figure 12. The network structure of the MimgNN.
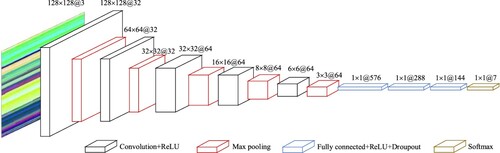
The MimgNN consists of multiple convolution layers, maximum pooling layers, and fully connected layers. The convolution layer extracts features of malware from ImgCDS feature images; The maximum pooling layer is used to reduce the feature dimensions extracted from the convolution layer, reduce the amount of computation, and improve the training speed of the network; The fully connected layer maps the high-dimensional features extracted from the convolution layers and the maximum pooling layers into a one-dimensional feature vector. The output of the Softmax layer is the probability that the sample corresponding to this ImgCDS image belongs to each software class, in which the probability Pi that the input ImgCDS image y belongs to software class i. Pi is calculated as shown in formula (4):
(4)
(4) where x is the input of the Softmax layer, w is the weight of the neuron, and k is the number of classes to be classified.
8. Experiments and results analysis
8.1. Dataset and experimental environment
The experimental sample dataset used in this paper is the malicious programme detection contest dataset provided by Aliyun. The data in the sample dataset is the API instruction sequences of executable programmes after sandbox programme simulation. The software sample categories include Normal, Ransom, Miner, DDos, Worm, Virus, Backdoor, and Trojan.
The algorithm is programmed with Python, and the hardware computing environment is configured as AMD Ryzen 7 5800H with Radeon Graphics processor, NVIDIA GeForce RTX 3060 GPU, and 32G memory.
8.2. Detection performance indicators
To accurately and comprehensively evaluate the detection performance of the malware detection method in this paper, four indicators, including accuracy(Acc), precision(Pre), recall(Rec), and F1-score(F1) are used to evaluate the detection effect of this method on malware. The indicators are shown as follows:
(5)
(5)
(6)
(6)
(7)
(7)
(8)
(8)
Among them, TP(true positive) is the quantity value of classifying positive samples as positive samples, TN(true negative) is the quantity value of classifying negative samples as negative samples, FP(false positive) is the quantity value of classifying negative samples as positive samples, and FN(false negative) is the quantity value of classifying positive samples as negative samples.
8.3. The effect of different feature combinations on the detection effect
Different feature combinations reflect the malicious behaviour of malware differently. To verify the effectiveness of the feature combinations selected in this method, comparative experiments are carried out on the detection effects under different feature combinations. 5 different feature combinations are selected:
None: Select the ACArray generated by the original API sequence without recombination as the feature, and fill the R channel;
ImgC: Fill the R channel with ACArray generated by the reorganised API instruction sequence;
ImgCD: Based on ImgC, select ADArray generated by the reorganised API instruction sequence to fill the G channel;
ImgCS: Based on ImgC, select ASArray generated by the reorganised API instruction sequence to fill the B channel;
ImgCDS: This is the feature combination selected in this paper, i.e. ACArray generated by the reorganised API instruction sequence is selected to fill the R channel, ADArray is used to fill the G channel and ASArray is used to fill the B channel.
Under the same experimental environment, the above five feature combinations are used, and the malware detection performance indicators for five groups of feature combinations are shown in Table . The bold fonts in Table indicate the maximum indicator values of columns.
Table 2. Detection performance indicators of different feature combinations.
It can be seen from Table that the order of detection accuracy of each feature combination from high to low is: ImgCDS, ImgCD, ImgCS, ImgC, and None. The structure and texture of the feature images generated under the None condition are cluttered, the structure of the feature images generated under the ImgC condition is clear, and each ABlock region is clearly delineated. The detection performance indicators of ImgC are higher than those of None, which shows that API grouping and reconstruction can significantly improve the detection results. From the detection performance indicators of ImgCD and ImgCS are higher than ImgC, it can be seen that the addition of API devotion and API sequential index can improve the detection of malware, and the features with multiple dimensions can reflect the behaviour of malware from multiple perspectives.
ImgCDS has the highest value of each detection performance indicator compared with the other four groups of feature combinations, indicating that the feature extraction method and feature combinations selected can comprehensively reflect the malicious behaviour of software samples and enable the neural network to extract more effective features. This shows ImgCDS can accurately and effectively detect malware categories.
8.4. The effect of different image enhancement methods on the detection effect
To verify the effectiveness of the image enhancement methods used in this paper, a comparison experiment is conducted on the detection effect before and after image enhancement. The ImgCDS images processed with seven image enhancement methods are input to the MimgNN for detection:
Base: Processing of ImgCDS images without using image enhancement technique.
With-B: Processing of ImgCDS images using brightness enhancement technique.
With-S: Processing of ImgCDS images using sharpness enhancement technique.
With-R: Processing of ImgCDS images of a few classes of samples using the horizontal flip technique.
Under the same experimental environment and the same parameter configuration, the ImgCDS images are processed using seven combinations of the above four image enhancement methods, respectively, and seven sets of detection performance indicators were obtained, as shown in Table .
Table 3. Detection performance indicators of different combinations of image enhancement methods.
As can be seen from Table , the detection accuracy of each combination of image enhancement methods is ranked from highest to lowest: With-BSR, With-SR, With-BS, With-BR, With-S, With-B, and Base. Compared with the Base method, the With-B and With-S methods have higher performance indicators, indicating that the use of brightness enhancement and sharpness enhancement methods can improve the detection effect. Among them, the brightness enhancement method improves the brightness of each region of the feature image. For the darker regions on the original image, the colour of the region is more obvious after the brightness enhancement. The sharpness enhancement method sharpens the colour block regions in the feature image, so that the edge distinction of each ABlock is more obvious and the structure of the feature image is clearer.
The With-BS method has higher detection performance indicators compared with With-B and With-S, indicating that simultaneous brightness enhancement and sharpness enhancement can further improve the detection Acc. The With-BR method and With-SR method further improve each detection performance indicator compared with With-B and With-S. Among them, the horizontal flip method changes the horizontal position of the feature image, which effectively expands the number of minority class samples and suppresses the data imbalance problem while the colour and texture features of the image remain unchanged. The combination of the With-BSR method has the highest performance indicators, indicating that the brightness and sharpness enhancement of the feature images and the horizontal flipping of the minority class samples can effectively improve the detection effect.
8.5. The performance comparison of different detection methods
To verify the effectiveness and validity of this method for malware detection, the method of this paper(ImgCDS), CNN-LSTM(Xu et al., Citation2020), LSTM(Ma et al., Citation2019), SLAM(Chen et al., Citation2020), SGDNet(Zhang et al., Citation2020) and LaMal(Chai et al., Citation2020) are used to detect the ImgCDS images, the detection performance indicators of the six methods are shown in Table . The bold fonts in Table indicate the maximum indicator values of columns.
Table 4. Detection performance indicators of different detection methods.
As can be seen from Table , among the six detection methods, the ImgCDS method has the highest detection Acc of 98.66%, which is 10.78%, 5.22%, 1.43%, 1.32%, and 1.36% better than LGMal, CNN-LSTM, SLAM, LSTM, and SGDNet, respectively.
In comparison to the LGMal method, the ImgCDS method has improved the Pre by 10.93%, the Rec by 10.57%, and the F1 by 10.88%; compared with the SGDNet method, the Rec and the F1 are improved. Compared with the above two methods, the ImgCDS method adds API devotion and API sequential index features, and the multi-angle features help reflect the malicious behaviour of software more comprehensively.
Compared with the CNN-LSTM method, the Pre, Rec, and F1 of the ImgCDS method are improved by 5.62%, 6%, and 5.81%; compared with the SLAM method, the detection performance indicators of the ImgCDS method are improved. Furthermore, compared with the above two types of methods, the ImgCDS method does not ignore the non-useful API classes or truncate the API sequences, thus preserving the global API information called by malware. At the same time, it does not rely on expert knowledge to classify APIs, thus reducing the error caused by manual classification on detection results.
The Pre, Rec, and F1 of the ImgCDS method are improved by 1.60%, 2.65%, and 2.67%, respectively, when compared with the LSTM method. The LSTM method only considers local API features, while the ImgCDS method considers both local and global API features, which effectively improves the detection performance indicators, given the complexity of malware-system interaction activities.
The above experimental results show that the ImgCDS method has a better comprehensive performance in malware detection.
8.6. The performance comparison of different neural network models
To verify the effectiveness of the MimgNN proposed in this paper for malware detection, under the same experimental environment, the detection performance indicators of ImgCDS images are obtained using the MimgNN with 5 classical CNNs: VGG16(Simonyan & Zisserman, Citation2015), AlexNet(Krizhevsky et al., Citation2017), DenseNet(Huang et al., Citation2017), ResNet(He et al., Citation2016), and MobileNetV2(Sandler et al., Citation2018), respectively. Furthermore, the detection performance of the 6 neural network models for feature images is shown in Table , and a comparison of the time taken and the external memory space occupied for 60 rounds of training of different network models is shown in Figure .
Figure 13. External space occupied by different network models and training time.
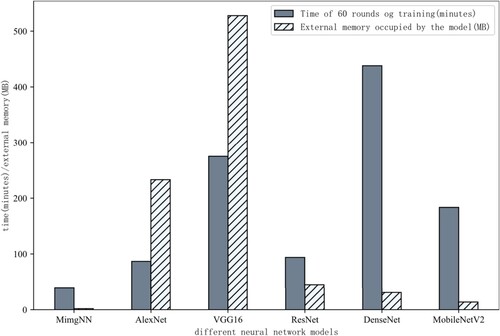
Table 5. Detection performance indicators of different neural network models.
As seen in Table , the Acc of MimgNN is 98.66%, which is 49.54%, 47.88%, 35.15%, 2.74% and 1.98% higher than the network models of MobileNetV2, DenseNet, ResNet, VGG16 and AlexNet, respectively. Meanwhile, the MimgNN has the highest Pre, Rec, and F1 among the above network models. As shown in Figure , the training time of DenseNet is the most time-consuming at 7.3024 min/round, followed by VGG16, MobileNetV2, ResNet, and AlexNet, respectively. MimgNN takes the least time at 0.6539 min/round. In terms of external storage space consumption, VGG16 occupies the largest space with 527.8639 MB, followed by AlexNet, ResNet, DenseNet, and MobileNetV2. MimgNN occupies the smallest space with 1.8906 MB.
Although DenseNet occupies less external memory space, its detection performance indicators are lower, and it requires the most time. Moreover, even though ResNet and MobileNetV2 consume less external memory space and time, the detection performance indicators are inferior. The overall performance of the three networks listed above is inadequate and unsuitable for detecting malware feature images. VGG16 has greater detection performance indicators, and the increased number of network layers improves detection performance, but it also increases model size, decreases detection efficiency, and lengthens training time. AlexNet has fewer layers and a faster training speed than VGG16, resulting in improved detection performance indicators with less training time. The MimgNN achieves the best results in the shortest amount of time and requires the least amount of external memory space when storing the model. The aforementioned results demonstrate that the proposed MimgNN has excellent overall performance in detecting malware feature images.
9. Conclusions
In this paper, we present a malware detection method based on the image representation of reorganised API instruction sequences. By grouping and reordering API instruction sequences, we extract the API code feature, API devotion feature, and API sequence index feature to fill 3 channels of an RGB image to generate a feature image and employ image enhancement technologies to expand the number of various samples. At the same time, we use a self-built lightweight CNN to detect feature images.
This method has superior detection performance indicators than multiple malware detection methods based on API instruction sequences (note that all detection methods are based on the same dataset). Compared with several classical CNNs, our proposed CNN has enhanced detection performance and faster speed in the classification task of malware feature images. Because of the fast training and testing speed of the autonomously constructed CNN, the detection method proposed by us can effectively detect the categories of malware, which effectively assisting decision-making in practice.
Our work is limited by the fact that we disrupt the original API instruction sequence, thereby losing some semantic information regarding the call sequence. In the future, we will attempt to apply technology for natural language processing to feature extraction in order to extract a more comprehensive API call sequence feature with distinct texture and colour of the feature image. All at the same, the CNN built autonomously will be further adjusted to enhance its stability in order to perform a variety of image classification tasks.
Disclosure statement
No potential conflict of interest was reported by the author(s).
Additional information
Funding
References
- Cai, S., Han, D., Yin, X., Li, D., & Chang, C. C. (2022). A Hybrid parallel deep learning model for efficient intrusion detection based on metric learning. Connection Science, 34(1), 551–577. https://doi.org/10.1080/09540091.2021.2024509
- Chaganti, R., Ravi, V., & Pham, T. D. (2022). Image-based malware representation approach with EfficientNet convolutional neural networks for effective malware classification. Journal of Information Security and Applications, 69(1), 103306:1–103306:19. https://doi.org/10.1016/j.jisa.2022.103306
- Chai, Y., Qiu, J., Su, S., Zhu, C., Yin, L., & Tian, Z. (2020). LGMal: A joint framework based on local and global features for malware detection. 2020 International Wireless Communications and Mobile Computing (IWCMC) IEEE, 463–468.
- Chen, J., Guo, S., Ma, X., Li, H., Guo, J., Chen, M., & Pan, Z. (2020). Slam: a malware detection method based on sliding local attention mechanism. Security and Communication Networks, 2020(1), 6724513:1–6724513:11. https://doi.org/10.1155/2020/6724513
- Cui, Z., Xue, F., Cai, X., Cao, Y., Wang, G. G., & Chen, J. (2018). Detection of malicious code variants based on deep learning. IEEE Transactions on Industrial Informatics, 14(7), 3187–3196. https://doi.org/10.1109/TII.2018.2822680
- D'Angelo, G., Palmieri, F., Robustelli, A., & Castiglione, A. (2021). Effective classification of android malware families through dynamic features and neural networks. Connection Science, 33(3), 786–801. https://doi.org/10.1080/09540091.2021.1889977
- Gaurav, A., Gupta, B. B., & Panigrahi, P. K. (2022). A comprehensive survey on machine learning approaches for malware detection in IoT-based enterprise information system. Enterprise Information Systems, 1–25. https://doi.org/10.1080/17517575.2021.2023764
- Han, W., Xue, J., Wang, Y., Liu, Z., & Kong, Z. (2019). MalInsight: A systematic profiling based malware detection framework. Journal of Network and Computer Applications, 125(1), 236–250. https://doi.org/10.1016/j.jnca.2018.10.022
- He, K., Zhang, X., Ren, S., & Sun, J. (2016). Deep residual learning for image recognition. In Proceedings of the IEEE conference on computer vision and pattern recognition, 770–778.
- Huang, G., Liu, Z., Van Der Maaten, L., & Weinberger, K. Q. (2017). Densely connected convolutional networks. In Proceedings of the IEEE conference on computer vision and pattern recognition, 2261–2269.
- Jian, Y., Kuang, H., Ren, C., Ma, Z., & Wang, H. (2021). A novel framework for image-based malware detection with a deep neural network. Computers & Security, 109(1), 102400:1–102400:24. https://doi.org/10.1016/j.cose.2021.102400
- Jian, Y., Kuang, H., Ren, C., Ma, Z, & Wang, H. (2021). A novel framework for image-based malware detection with a deep neural network. Computers and Security, 109, 102400.https://doi.org/10.1016/j.cose.2021.102400
- Krizhevsky, A., Sutskever, I., & Hinton, G. E. (2017). Imagenet classification with deep convolutional neural networks. Communications of the ACM, 60(6), 84–90. https://doi.org/10.1145/3065386
- Lin, G., Wen, S., Han, Q. L., Zhang, J., & Xiang, Y. (2020). Software vulnerability detection using deep neural networks: a survey. Proceedings of the IEEE, 108(10), 1825–1848. https://doi.org/10.1109/JPROC.2020.2993293
- Ma, X., Guo, S., Bai, W., Chen, J., Xia, S., & Pan, Z. (2019). An API semantics-aware malware detection method based on deep learning. Security and Communication Networks, 2019(1), 1–9. https://doi.org/10.1155/2019/1315047
- Miao, Y., Chen, C., Pan, L., Han, Q. L., Zhang, J., & Xiang, Y. (2021). Machine learning–based cyber attacks targeting on controlled information. ACM Computing Surveys, 54(7), 1–36. https://doi.org/10.1145/3465171
- O’Shaughnessy, S., & Sheridan, S. (2022). Image-based malware classification hybrid framework based on space-filling curves. Computers & Security, 116(1), 102660:1–102660:14. https://doi.org/10.1016/j.cose.2022.102660
- Pinhero, A., Anupama, M. L., Vinod, P., Visaggio, C. A., Aneesh, N., Abhijith, S., & AnanthaKrishnan, S. (2021). Malware detection employed by visualization and deep neural network. Computers & Security, 105(1), 102247:1–102247:30. https://doi.org/10.1016/j.cose.2021.102247
- Pinhero, A., Anupama, M. L., Vinod, P., Visaggio, C. A., Aneesh, N., Abhijith, S, & AnanthaKrishnan, S. (2021). Malware detection employed by visualization and deep neural network. Computers and Security, 105, 102247.https://doi.org/10.1016/j.cose.2021.102247
- Potha, N., Kouliaridis, V., & Kambourakis, G. (2021). An extrinsic random-based ensemble approach for android malware detection. Connection Science, 33(4), 1077–1093. https://doi.org/10.1080/0954-0091.2020.1853056
- Qiu, J., Zhang, J., Luo, W., Pan, L., Nepal, S., & Xiang, Y. (2020). A survey of android malware detection with deep neural models. ACM Computing Surveys, 53(6), 1–36. https://doi.org/10.1145/3417978
- Sandler, M., Howard, A., Zhu, M., Zhmoginov, A., & Chen, L. C. (2018). Mobilenetv2: Inverted residuals and linear bottlenecks. In Proceedings of the IEEE conference on computer vision and pattern recognition, 4510–4520.
- Simonyan, K., & Zisserman, A. (2015). Very deep convolutional networks for large-scale image recognition. the 3rd International Conference on Learning Representations(ICLR), 1–14.
- Tekerek, A., & Yapici, M. (2022). A novel malware classification and augmentation model based on convolutional neural network. Computers & Security, 112(1), 102515:1–102515:17. https://doi.org/10.1016/j.cose.2021.102515
- Vasan, D., Alazab, M., Wassan, S., Naeem, H., Safaei, B., & Zheng, Q. (2020). IMCFN: Image-based malware classification using fine-tuned convolutional neural network architecture. Computer Networks, 171(1), 107138:1–107138:19. https://doi.org/10.1016/j.comnet.2020.107138
- Wang, J., Zhang, C., Qi, X., & Rong, Y. (2021). A survey of Intelligent malware detection on windows platform. Journal of Computer Research and Development, 58(5), 977–994. https://doi.org/10.7544/issn1000-1239.2021.20200964
- Xiao, M., Guo, C., Shen, G., Cui, Y., & Jiang, C. (2021). Image-based malware classification using section distribution information. Computers & Security, 110(1), 102420:1–102420:14. https://doi.org/10.1016/j.cose.2021.102420
- Xu, A., Chen, L., Kuang, X., Lv, H., Yang, H., Jiang, Y., & Li, B. (2020). A hybrid deep learning model for malicious behavior detection. 2020 IEEE 6th Intl Conference on Big Data Security on Cloud (BigDataSecurity), IEEE Intl Conference on High Performance and Smart Computing,(HPSC), and IEEE Intl Conference on Intelligent Data and Security (IDS) IEEE, 55–59.
- Yang, H., & Feng, Y. (2021). A Pythagorean fuzzy Petri net based security assessment model for civil aviation airport security inspection information system. International Journal of Intelligent Systems, 36(5), 2122–2143. https://doi.org/10.1002/int.22373
- Yang, H., Wang, Z., Zhang, L., & Cheng, X. (2022a). IoT botnet detection with feature reconstruction and interval optimization. International Journal of Intelligent Systems, https://doi.org/10.1002/int.23074
- Yang, H., Zeng, R., Xu, G., & Zhang, L. (2021). A network security situation assessment method based on adversarial deep learning. Applied Soft Computing, 102(1), 107096:1–107096:9. https://doi.org/10.1016/j.asoc.2021.107096
- Yang, H., Zhang, Z., Xie, L., & Zhang, L. (2022b). Network security situation assessment with network attack behavior classification. International Journal of Intelligent Systems, 37(3), 6909–6927. https://doi.org/10.1002/int.22867
- Zhang, J., Pan, L., Han, Q. L., Chen, C., Wen, S., & Xiang, Y. (2021). Deep learning based attack detection for cyber-physical system cybersecurity: A survey. IEEE/CAA Journal of Automatica Sinica, 9(3), 377–391. https://doi.org/10.1109/JAS.2021.1004261
- Zhang, Z., Li, Y., Dong, H., Gao, H., Jin, Y., & Wang, W. (2020). Spectral-based directed graph network for malware detection. IEEE Transactions on Network Science and Engineering, 8(2), 957–970. https://doi.org/10.1109/TNSE.2020.3024557
- Zhu, X., Huang, J., Wang, B., & Qi, C. (2021). Malware homology determination using visualized images and feature fusion. PeerJ Computer Science, 7(4), 494–513. doi:10.7717/peerj-cs.494