
 ?Mathematical formulae have been encoded as MathML and are displayed in this HTML version using MathJax in order to improve their display. Uncheck the box to turn MathJax off. This feature requires Javascript. Click on a formula to zoom.
Abstract
Natural language processing text similarity calculation is a crucial and difficult problem that enables matching between various messages. This approach is the foundation of many applications. The word representation features and contextual relationships extracted by current text similarity computation methods are insufficient, and too many factors increase the computational complexity. Re-LSTM, a weighted word embedding long and short-term memory network, has therefore been proposed as a text similarity computing model. The two-gate mechanism of Re-LSTM neurons is built on the foundation of the conventional LSTM model and is intended to minimise the parameters and computation to some level. The hidden features and state information of the layer above each gate are considered for extracting more implicit features. By fully utilising the feature word and its domain association, the feature word’s position, and the word frequency information, the TF-IDF method and the χ²-C algorithm may effectively improve the representation of the weights on the words. The Attention mechanism is used in Re-LSTM to combine dependencies and feature word weights for deeper text semantic mining. The experimental results demonstrate that the Re-LSTM model outperforms baselines in terms of precision, recall, accuracy, and F1 values, all of which reach above 85% when applied to the QQPC and ATEC datasets.
1. Introduction
The fast advancement of Internet technology has resulted in a massive influx of data. Text is the most essential tangible carrier of information, and it is split into intangible and tangible carriers of information. Therefore, it is important to further explore the deeper meaning of textual information for people to access the required content quickly and accurately. Text classification and text clustering (Wang et al., Citation2021; Zhang et al., Citation2019, Citation2022) are two information retrieval techniques that use text similarity computation. Additionally, there are positions available in the field of artificial intelligence, including those in automated scoring systems (Li et al., Citation2022) and plagiarism detection (Malandrino et al., Citation2022) in the area of natural language processing, where text similarity computation is crucial. Text similarity computation is a type of text matching task that yields a numerical number for the degree of similarity between two texts (Kenter & De Rijke, Citation2015; Pu et al., Citation2017). The efficacy of similarity determination in textual information processing is heavily influenced by the approach used. As a result, it’s crucial to research and enhance text similarity computation algorithms.
A specific similarity value is the result of the text-similarity calculation. The smaller the value, the less semantic resemblance there is, and the greater the value, the more semantic similarity there is. Text similarity calculations are more challenging in complicated human language texts because of the abundance of synonyms and abbreviations as well as the highly varied grammatical structure. To solve these problems, both academia and industry have conducted a lot of research and practice and proposed a series of text similarity calculation models and methods.
Because the computation of text similarity has become a hot topic in natural language processing, various researchers both at home and abroad have thoroughly combed through the available semantic text similarity computation approaches, resulting in some great thesis. There are three primary ways of calculating text similarity at the moment. One is corpus-based approaches such as VSM (Zhang et al., 2014), LSA (Kaur & Maini, Citation2019), and LDA (David et al., Citation2003; Liu et al., Citation2019), which ignore key elements such as word order and syntactic structure to calculate similarity. Second, there are classical string statistics-based modelling methods such as N-gram (Maipradit et al., Citation2019) and Jaccard (Ayub et al., Citation2018) algorithms. They determine the similarity by comparing the number of words in the text, and the algorithms are concise but ignore the extraction of deep semantic information. The third is a deep learning-based calculation method. This method abstracts a feature representation of the word after extracting the local content of the article and fits similarity labels using a multi-layer perceptron. Some of the more common models include the Siamese network structural framework proposed by Mueller and Thyagarajan (Citation2016) and the twin neural network combining CNN and Bi-LSTM proposed by Wan et al. (Citation2016). Some scholars have also designed new depth models, such as the Xlnet model proposed by Yang et al. (Citation2019).
Although many scholars have used neural networks to improve the text-similarity algorithm to varying degrees, they have not improved the neurons of the LSTM. As a result, there are still problems such as computational complexity, inadequate extraction of word representation features, and inter-textual dependencies.
Most of the related research on text similarity calculation only considers a single text feature for similarity calculation. Sundermeyer et al. (Citation2012) applied long short-term memory networks (LSTM) to the field of literary NLP. The traditional recurrent neural network’s long-distance information dependence on input sequences was solved. Devi and Saharia (Citation2022) was able to effectively improve tweet classification accuracy using a TF-IDF weighting scheme. A Bi-LSTM model (Li & He, Citation2022) with an integrated attention mechanism was proposed to improve translation quality. Hui-Fang et al. (Citation2019) fused the term co-occurrence distance correlation and category feature to calculate short text similarity. Deng et al. (Citation2017) performed analytical computations on syntax and dependencies from the perspective of sentence structure. Yang et al. (Citation2016) used a dependency tree representation for shallow syntactic structural features to calculate similarity, but this method cannot analyze the deep semantic information of sentences. Zhang et al. (Citation2018) provided a brief text similarity computation technique based on LDA and a topic similarity factor. This method did not consider multiple text features and could not better evaluate factors such as text semantics, word order, and topic importance. It still has problems such as high computational complexity and low accuracy. An improved LSTM cell architecture was proposed by Sepas-Moghaddam et al. (Citation2021). This method is a novel recurrent joint learning strategy that uses additional gates and memory units at the cellular level. Inspired by it, improving neurons and integrating algorithms from other disciplines will also help to improve accuracy.
A Re-LSTM-based method for calculating text similarity is proposed. Re-LSTM takes into account various feature factors of the text, such as word frequency, category, and semantic information, as far as possible while reducing the computational effort. A new neuronal Re-LSTM was designed based on the traditional LSTM to reduce the parameters and simplify the computation. It has been designed as a two-gate mechanism (update gate and selection gate), both taking into account state information and hidden features from the previous layer, with increased feature extraction. Re-LSTM combines the TF-IDF algorithm with the statistical computing method χ²-C algorithm, which can better extract contextual information. The attention mechanism enhances text dependency extraction. The combination of weighted feature factors and Re-LSTM was used to calculate text similarity to reduce the time complexity and improve the accuracy of the results.
The main work of this paper is as follows:
Inspired by the neural network layer setting, a new neuronal Re-LSTM is designed based on the traditional LSTM. The double-gate mechanism used in Re-LSTM reduces the parameters and simplified the computation.
Based on the Re-LSTM, the TF-IDF algorithm combined with the statistical χ² test is proposed for feature selection, which increases the extraction of implied features. The attention mechanism used considers global-local connectivity and captures contextual dependencies to produce more nuanced semantics.
Experiments are designed on real datasets to verify the superiority of the algorithm.
The following is how the rest of the paper is organised. Section 2 describes work related to the calculation of weighted text similarity. Section 3 describes in detail the Re-LSTM model proposed in this paper. Section 4 explains the word weighting calculation method used in this paper. Section 5 explains the experimental setup and the analysis of the experimental results. Section 6 presents the conclusion.
2. Related work
Text similarity computation is one of the research hotspots in the field of NLP, and therefore the study of text similarity algorithms helps to drive the flow of scholarship in this field. This section analyses and discusses models that have been relevant to the computation of text similarity in recent years.
Text similarity calculation based on strings and corpora is a more traditional approach. Che et al. (Citation2004) developed a method for calculating edit distances that is more accurate. The basic idea is to use a large knowledge base to assign various weights to different editing operations. To improve the edit distance performance of this algorithm, it took into account both word order and partial semantic information. The study (Kaur & Maini, Citation2019) proposed and analyzed distance metrics for different strings for similarity metrics between text libraries. The study (Wu et al., Citation2021) proposed a short text similarity calculation method based on Jaccard and semantic blending, which improved the accuracy of short text similarity calculation to some extent. Zhang et al. (2014) and others used an improved vector space model (VSM) for document representation, which solved the problem of high dimensionality and lack of semantic similarity. The string-based approach is theoretically simple and easy to implement, and is mostly used for fast fuzzy text matching. The biggest drawback is that synonyms are not sufficiently considered. The corpus-based strategy takes into account semantic information between words to a certain extent, but it has some drawbacks. For example, the cost is high, the lexicon needs to be constantly updated and maintained, and the syntactic structure information is not taken into account, so the accuracy of computing long text similarity is low.
In recent years, the continuous development of deep learning techniques has helped to achieve many breakthroughs in the field of NLP. Fan et al. (Citation2018) proposed a neural feedback algorithm combining bi-directional long and short-term memory (BiLSTM) and convolutional neural networks (CNN) with k-means methods for text clustering and similarity calculation. Experiments showed that the algorithm has some noise robustness. This study (Luo et al., Citation2021) used a deep bidirectional long and short-term memory (BiLSTM) network to capture the contextual information of words and mapped sentences into low-dimensional numerical vectors, solving the problem of the high dimensionality of TCM text features and validating the engineering value of text similarity computation in TCM. Farouk (Citation2020) used discourse representation structure (DRS) to compute the structural similarity, taking into account the effect of the order of words on the results. Experiments have shown that the method can achieve better results. Many studies have shown that the use of attentional mechanisms will increase the impact of key features that can be used to measure sentences. This study (Ji & Zhang, Citation2022) obtained an enhanced semantic representation between sentences by introducing the headword attention mechanism, which effectively enhanced the accuracy of similarity computation. Yu et al. (Citation2020) proposed an attention mechanism and a multi-granularity-based Bi-LSTM model (AM-Bi-LSTM) for dealing with complex NLP in question-and-answer systems. systems in complex NLP. Jang et al. (Citation2020) proposed a hybrid Bi-LSTM-CNN model based on an attention mechanism, which appropriately blends the advantages of LSTM and CNN. The study (Qin, Citation2022) proposed the GCN-Attention English recognition method to make the output words match the predicted words as closely as possible, and the testing results revealed that the model has excellent recognition accuracy. The study (Zhang et al., Citation2022) proposed the CL-ECPE model to solve the problem of low extraction accuracy caused by the inability to fully use the original information in the data. Through contrastive learning, it enhances extraction accuracy, and experimental findings demonstrate that the model is resilient. The study (Viji & Revathy, Citation2022) proposed a hybrid approach that combined an improved BERT model with the Siamese Bi-LSTM model, resulting in higher efficiency in semantic text similarity. The study (Singh et al., Citation2022) proposed the idea of combining the TF-IDF algorithm with word embedding techniques to further dimensionality reduction of the features to improve the performance of the classifier. The study (Huan et al., Citation2022) proposes a text classification method based on CBM (Convolutional and Bi-LSTM models) model, which can extract both shallow local semantic features and deep global semantic features, significantly improving the classification accuracy. However, most of the methods are improvements to the model and still suffer from computational complexity and insufficient extraction of dependencies between texts.
In recent years, there has been a gradual increase in research on the weighting of feature representations. To address the problem of feature sparsity, the study (Shi et al., Citation2021) proposed a multiple test weighted fusion method for short text similarity calculation. A linear fusion of weighted factors was applied to the texts, making the calculation results more accurate and reasonable. The study (Bao et al., Citation2018) proposed an Attentive Siamese Long Short-Term Memory (LSTM) network for measuring semantic text similarity, which requires original sentence pairs and pre-trained word embeddings as input, rather than external resources and manual features. In particular, an attention mechanism is added to the LSTM network to capture high-level semantic information. This study (Wang & Huang, Citation2019) proposes a text classification model (CTMWT) based on a combination of Word2vec, improved TF-IDF, and convolutional neural networks to address the problems of weak semantic feature representation, the high dimensionality of text representation, word order loss and matrix sparsity of traditional machine learning text classification algorithms. It is experimentally validated that it has better classification results than traditional machine learning text classification algorithms. The study (Alshubaily, Citation2021; Karim et al., Citation2018; Yao et al., Citation2019) introduced an attention mechanism to further improve the classification results. The study (Lin et al., Citation2022) proposed a light gradient lifter regression model based on Indonesian texts, which used lexical strategies from Indonesian to enhance sentence score computation. Zhao et al. (Citation2022) proposed a method combining word2vec, a topic-based TF-IDF algorithm, and an improved convolutional neural network for news text classification, which effectively improved the classification accuracy.
3. Proposed method
3.1. TF-IDF
The TF-IDF algorithm, a statistical method commonly used in text processing to assess the importance of a word in a document, is used to calculate the initial weight of each feature word in the test sample.
According to the TF-IDF algorithm, the more the feature word appears in the text and the less it appears in the corpus, the more representative it is. TF represents the word frequency index and IDF represents the inverse text frequency index. The weight of feature word d in document t is calculated as in formula (1).
(1)
(1) Among them,
represents the word frequency of the feature word d in the document t.
represents the number of occurrences of feature word d in document t, and S represents the total number of document t feature words.
represents the inverse text frequency index of the feature word d.
represents the number of texts in the corpus that contain feature words. N represents the total number of documents in the corpus.
(2)
(2) Where
represents the normalisation factor and is calculated as in formula (2). Feature selection may be carried out effectively using the TF-IDF method.
3.2. χ² Test
The χ² test is derived from the list test, and the basic idea is to determine the theoretical correctness by observing the difference between the actual and theoretical values. According to the χ² test, the relationship between feature words and categories obeys a one-dimensional degree of freedom χ² distribution. The higher the value of the χ² statistic, the less independence between vocabulary and category. Therefore, it can be used to calculate the statistical correlation between feature words and categories.
Assuming that the domain relationship obeys a one-dimensional χ² distribution of degrees of freedom, the value of the χ² statistic is inversely proportional to the independence between feature word d and domain c. Formula (3) is the calculation method of the chi-square test of the feature word d against domain c.
(3)
(3) Where A represents the number of documents belonging to c and containing d, B represents the number of documents not belonging to c but containing d. C represents the number of documents belonging to c but not containing d, and D represents the number of documents belonging to neither c nor containing d. N represents the total number of documents.
(4)
(4) As the
values calculated for certain feature words are relatively large, they can have a large impact on the later calculations and lead to inaccurate final results. Therefore the normalisation process was carried out using formula (4).
3.3. Category Association algorithm
In the domain association algorithm, the domain in which the feature word is located is set as the positive class and the other domains as the negative class. The basic idea is to calculate the relevance of the feature word to the category based on the number of feature words in the positive and negative classes. If the number of documents in the positive class that contain the feature word d is greater than the number of documents in the negative class that contain d, it means that d is more related to the positive class. Conversely, d is more related to the negative class. The domain association factor Ca is calculated by formulas (5–7).
(5)
(5) Among them,
represents the number of documents in the positive class containing the feature d as a proportion of the total documents in the positive class.
represents the total number of documents in the positive class. Similarly,
represents the number of documents in the negative class that contain the feature d as a proportion of the total documents in the negative class.
represents the total number of documents in the negative class.
(6)
(6) Where
denotes the relevance of d to the domain in which it is located.
represents the number of documents in the positive class containing the feature d.
represents the number of documents in the negative class that contain the feature d.
(7)
(7) The domain association factor Ca is calculated by the formula (17). According to formula (17),
equals
if
is greater than
and
if
is less than or equal to
.
3.4. Improved weighting method for feature representation
The influence of different feature word lengths on the text is also different. For example, the expression of long feature words on the topic is generally greater than that of short ones. Therefore, when calculating the text feature weights, the length of the special testimony, the initial weight, and the domain association factor are combined to calculate the special testimony weights. Such as formula (8).
(8)
(8) Where
represents the length of the feature word,
represents the initial weight of the feature word, and
represents the final weight of the feature word.
The TF-IDF algorithm uses the number of occurrences of feature words in the text and corpus to efficiently calculate the importance of feature words. The χ²-C algorithm is a fusion of the χ² test and the domain association algorithm, with the aim of calculating the domain association factor Ca and obtaining category information. Firstly, a χ² test is used to calculate the χ² statistic for each word. Secondly, the χ² statistic is combined with the domain association algorithm to derive the domain association factor Ca. Finally, the final feature word weights are derived from the word frequency and category information. The algorithm takes into account both word frequency and word category information, enhancing the ability of the weights to represent words and solving the problem that traditional feature engineering usually only analyses word frequency and ignores other information when determining feature word weights.
4. Re-LSTM text similarity computation model based on weighted word embedding
4.1. Model overview
A Re-LSTM model for text similarity computation is proposed to improve the problem of inadequate extraction of word representation features and dependencies in current text similarity computation models. The weighted word embedding-based Re-LSTM text similarity calculation model is shown in Figure of this research. The model consists of six main parts: the input layer, the χ²-Attention layer, the Re-LSTM layer, the aggregation layer, the Dropout layer, and the fully connected layer.
Figure 1. Re-LSTM model structure diagram.
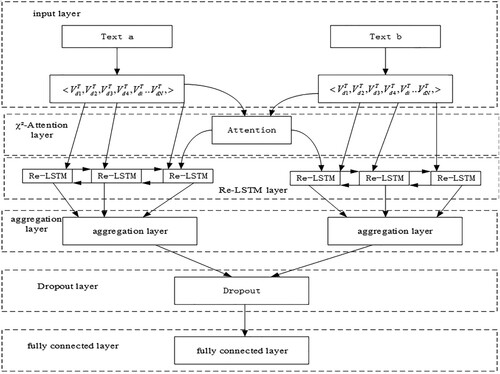
4.2. Input Layer
Each feature word in the text corresponds to a point on the vector space following word2vec model training. N-dimensional vectors can be used to represent points in a vector space. As in the formula (9).
(9)
(9) Among them,
represents a single n-dimensional word vector,
represents the feature word, and
represents the corresponding dimension. The set of word vectors is
, and the feature word weight set is
.
The text can be represented as a set of feature words as . Since each feature word corresponds to a word vector, the text can be expressed as a word vector matrix
. N is the total number of document feature words.
4.3. χ²- Attention Layer
From a great amount of data, the Attention mechanism picks out the information that is more relevant and ignores the more minor elements. It follows a basic formula where you compute the output in relation to each input, normalise it, and then add the results together. The computation follows formula (10).
(10)
(10) Where
represents the input information, which is of the form <key, value>.
represents the output.
represents the size of the text. The Re-LSTM neuron model, where the input is the current text and the output is the comparative text, fuses the Attention mechanism. The computation follows formula (11).
(11)
(11) Among them,
represents the Attention value of the i-th feature word in the text. Finally, the output
produced for the current layer and the feature word weights
computed by the χ²-C algorithm are concatenated and used as input to the following layer.
4.4. Re-LSTM Layer
An input gate, a forget gate, and an output gate make up the classic LSTM’s three gates. A layer of the sigmoid neural network filters each gate. The output of the sigmoid is a number between 0 and 1, where 0 indicates that no data is permitted to pass, 1 indicates that all data passes, and the other values indicate that some data may pass. However, the number of doors is too large, resulting in too many parameters, which makes calculations more complex and time-consuming. Moreover, each gate only considers the upper layer’s hidden feature and does not consider the upper layer state
, so the extraction of hidden features is insufficient. For this type of problem, a new neuron is designed based on the traditional LSTM. As shown in Figure .
Figure 2. Structure of a single Re-LSTM neuron.
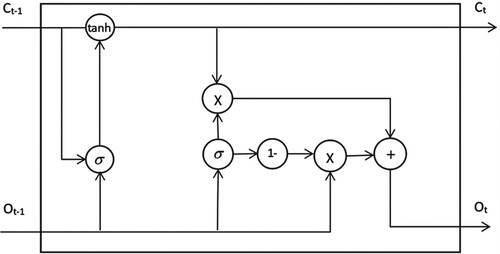
Similar to the traditional LSTM, Re-LSTM is also composed of gates. Re-LSTM is designed with two gates, namely the update gate and the selection gate. Each gate is filtered by a sigmoid function. The update gate state is calculated as in formula (12).
(12)
(12) Where
represents the value of the update gate at time t,
represents the output of the upper Re-LSTM unit. σ represents the sigmoid function,
represents the weight matrix in the update gate.
represents the current input and
represents the bias term of the update gate.
represents the state of the previous layer. The select gate state is calculated as in formula (13).
(13)
(13) Where
represents the value of the select gate at time t,
represents the weight matrix of the select gate,
represents the bias term of the select gate.
(14)
(14) As in formula (14),
represents the unit input at time t, and
is the hyperbolic tangent function representing the activation function.
represents the weight matrix in the cell state,
represents the weight of the current input
in the cell state and
represents a unit status bias item.
(15)
(15)
As in formula (15), represents the unit at time t,
represents the unit of the upper layer Re-LSTM.
(16)
(16) Where
represents the current Re-LSTM layer. The Re-LSTM has fewer parameters than the traditional LSTM, which is also more efficient, and both gates of the Re-LSTM consider the state and hidden characteristics of the preceding layer.
(17)
(17) The original data is used directly as input to the following layer, maximising textual information retention while adequately capturing the contextual information of each word. As in formulas (16) and (17) above. In response to the issue of excessively large inputs and numerous parameters leading to excessive dimensionality, the autoencoder was developed for dimensionality reduction.
4.5. Aggregation Layer and fully connected layer
The forward propagation output vector and the backward propagation output vector of the Re-LSTM are sewn together by the aggregation layer to create a new vector. As in formula (18).
(18)
(18) Where
represents the output vector of the aggregation layer,
represents the output vector of backward propagation, and
represents the output vector of forwarding propagation.
In the neural network, the fully connected layer serves as a classifier. The two-layer fully-connected layer receives the text feature vectors that the neural network has extracted, and the final binary classification is performed using the softmax activation function.
5. Experiment verification and result analysis
5.1. Experimental datasets
Two datasets were utilised to assess the performance of the Re-LSTM model in calculating text similarity. The first dataset (https://www.kaggle.com/c/quora-question-pairs/data) contains 404,290 data elements and was used in the Quora Question Pairs Competition (QQPC). The QQPC dataset is provided by quora question and answer, all of which are real questions from users. As shown in Table . Id, question1, question2, and is_duplicate are the four data items that each entry includes. When two questions are semantically similar, the value of is_duplicate is 1, otherwise, it is 0.
Table 1. QQPC dataset information.
The ATEC Ant Huabei dataset, which has 71730 data in total, is used as the second dataset (https://dc.cloud.alipay.com/index#/topic/intro?id=3). The ATEC dataset is provided by Alibaba Ant Financial, and the samples come from real application scenarios. Ant Financial has opened it as the competition data of the ATEC Developer Competition. As shown in Table , the format of each piece of data after sorting is the same as that in Table .
Table 2. ATEC dataset information.
The text was clustered using the K-means algorithm, and the k-value was adjusted to 4 in accordance with the control variables technique. This allowed us to compute the domain association factor Ca in the χ²-C algorithm. To be used in weighting calculations later, the text was annotated with categories. The experiments all use real data sets with actual application scenarios so that the experimental results can more objectively reflect the effectiveness and realism of the Re-LSTM model.
5.2. Experimental parameter settings
The experimental environment for model training is TensorFlow 1.9. The final neural network parameters were established as indicated in Figure in accordance with the performance of the Re-LSTM model following parameter adjustments in the experiment (Table ).
Figure 3. Comparative graphs for each model.
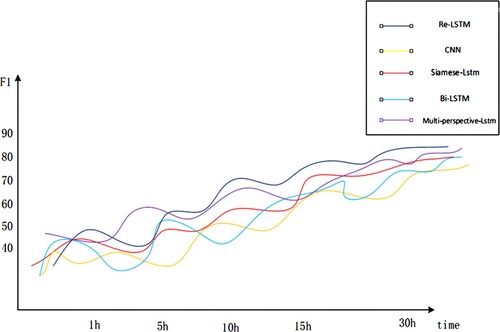
Table 3. Neural network parameter setting.
To better appropriately present the test results due to the dataset’s relatively short content, the maximum sentence length is set to 90. This article sets the sample percentage to 0.3. The meaning of the term cannot be accurately conveyed if the dimension is too small, while a dimension that is too large will complicate computations. As a result, at the word embedding layer, the feature representation of the word is set to be a 100-dimensional vector. Set dropout keep prob to 1 in the word embedding dropout layer to maintain each word’s meaning. This experiment uses two Re-LSTMs to extract text features. Each layer has 270 hidden layers, and the dropout keep prob parameter of the associated dropout layer is set to 1.
A higher batch size and a lower epoch can be chosen while training the model because this model will ultimately perform binary classification, with a batch size of 300 and an epoch of 15. Every 15 iterations, the training results are shown to highlight the results’ trend, and every 100 iterations, the model is assessed and the evaluation findings are displayed. The learning rate shows how much a parameter is updated in each iteration, and the bigger the decay rate, the quicker the learning rate falls. In this experiment, the learning rate is set to 0.01 and the decay rate is set to 0.009 to make sure that the loss function oscillates in a zone nearer to the ideal value.
5.3. Model evaluation criteria
In the tests, the Re-LSTM model evaluates the model using Accuracy (A), Precision (P), Recall (R), and F1 value.
Accuracy (A) represents the proportion of all samples in the dataset for which the model successfully finds similarities. It stands for the number of samples for which this is true. It is determined using the formula (19).
(19)
(19) Precision (P) is the proportion of samples that match all of the expected samples with a similarity of 1, calculated using the formula (20).
(20)
(20) Recall (R), determined using formula (21), is the proportion of samples having a predicted similarity of 1 to the total number of samples.
(21)
(21) The F1 value is determined by summing the means of the precision and recall variables according to the formula (22).
(22)
(22) When training the model, Table shows that TP: prediction is_duplicate is 1, the actual result is 1, indicating that the prediction is correct; FP: prediction is_duplicate is 1, the actual result is 0, indicating a prediction error; FN: prediction is_duplicate is 0, the actual result is 1, indicating a prediction error; TN: prediction is_duplicate is 0, the actual result is 0, indicating the prediction is correct.
Table 4. Confusion matrix.
5.4. Analysis of experimental results
This section shows the experimental results in detail and compares and analyses them. Four comparison model algorithms, CNN, Bi-LSTM, Siamese-LSTM, and Multi-perspective-LSTM, were employed to test the efficacy of various models in computing text similarity.
In the beginning, simply CNN and Bi-LSTM models were used to extract text features. The binary categorisation of the two texts was performed in the fully connected layer using a sigmoid function. Second, LSTM was integrated into the Siamese Network architecture to assess the similarity of the input samples. The input vector is quantised and the distance between the two output vectors is calculated using a distance metric to assess text similarity because the Siamese Network consists of two sub-networks with the same structure and weights. The Multi-perspective-LSTM model, once again, employs a multi-perspective mechanism to match each text with another sentence from a variety of angles. The LSTM is then used to combine the matched results into a fixed-length vector. Based on this vector, a fully connected layer (connected Sigmoid or Softmax) is utilised for classification and the construction of a loss function. Finally, the Re-LSTM is included in the neural network alongside the text information, combining the χ²-C algorithm with the Attention mechanism to compute the two text interaction attenuation and feature word weights. Two dropout layers were added to the Re-LSTM to prevent it from overfitting. To evaluate the degree of similarity between the two texts, classification was lastly performed in the fully connected layer.
The experimental results on the QQPC dataset and the ATEC dataset are shown in Tables and respectively. The results show that the Re-LSTM model achieves precision, recall, accuracy and F1 values of 86.21%, 85.6%, 85.57% and 84.7%, respectively, on the QQPC dataset. The precision, recall, accuracy and F1 values on the ATEC dataset reached 86.89%, 86.5%, 85.65% and 84.5%, respectively. The CNN model was the least effective compared to the remaining four models. The reason for this analysis was that the text of the dataset in the experiment was not long enough and therefore the information extracted using CNN alone was insufficient. Bi-LSTM was slightly less effective than Siamese-LSTM because Siamese-LSTM took into account the distance metric of the text vector, which was more advantageous in this experiment. Comparing the first three models, the Multi-perspective-LSTM was able to extract more accurate information and evaluate similarity from various viewpoints, but it still had the issue of not extracting enough contextual dependencies. To make the best use of the limited textual information, Re-LSTM took more factors into account and worked best experimentally. The results in Tables and indicate the usefulness and practicality of the Re-LSTM model.
Table 5. Comparison of experimental results of models based on QQPC dataset.
Table 6. Comparison of experimental results of models based on ATEC dataset.
The F1 value accounts for both precision and recall and provides a reliable assessment of each model’s performance. The comparison of the F1 value of each model is shown in Figure . The Re-LSTM model performs much better than the other models in terms of accuracy and performance when calculating text similarity, as seen by its somewhat higher F1 values overall.
Ablation experiments were created to further show the Re-LSTM model’s efficacy. In the parts that follow, this is explained in more depth, and the findings are compared and evaluated. A comparison of the results of the ablation experiments is shown in Figure .
Figure 4. Comparison of ablation experiment results.
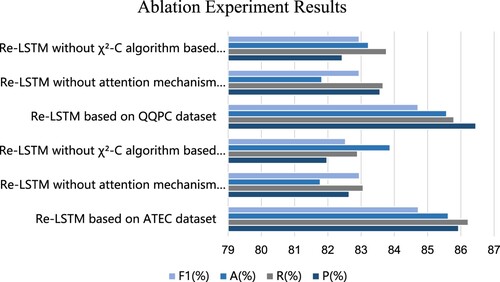
On the QQPC dataset and the ATEC dataset, Figure compares the Re-LSTM model with the Re-LSTM model without the χ²-C algorithm and without the Attention mechanism.
The Re-LSTM model without the χ²-C algorithm has poorer precision, recall, accuracy, and F1 value than the Re-LSTM, according to the QQPC dataset and the ATEC dataset. It implies that it is beneficial to compute the feature word weights more fully using the statistical calculation χ²-C algorithm, boosting the calculation’s accuracy of text similarity. The fundamental reason for this is that the χ²-C algorithm considers word frequency, word location, word length, and association data with the category of the feature words. The Re-LSTM layer receives the feature word weights as input, obtaining richer semantic information and enhancing the neural network’s capacity to compute text similarity. This enables more accurate classification in the fully connected layer and boosts the Re-LSTM model’s accuracy and overall performance.
Precision, recall, accuracy, and F1 value showed a greater improvement in the Re-LSTM model than in the Re-LSTM model without the Attention mechanism. This demonstrates that the Re-LSTM model outperforms other models on the whole and that the use of the Attention mechanism may completely capture the connections between contexts and give more semantic information, which is more useful in computing text similarity.
6. Conclusion
A word embedding-based text similarity computation model called Re-LSTM is suggested by fusing statistical computing techniques with deep neural networks to increase the performance and accuracy of text similarity calculation. The Re-LSTM neuron, a novel neuron designed based on the conventional three-gate LSTM model, employs a two-gate mechanism. Each layer of the neural network receives the feature word weights produced by combining the TF-IDF algorithm, the χ²-C algorithm, and the Attention mechanism, and the fully connected layer then classifies the results. Each layer can obtain richer semantic information based on the feature information of the words as well as the dependency information of the sentences because the model based on Re-LSTM text similarity calculation takes into account the hidden features and state information of the preceding and following layers in the temporal dimension. It overcomes the problem of high computational and temporal costs of traditional LSTM. The Re-LSTM model now has greater precision, recall, accuracy, and F1 value, according to the testing results. The single-layer Re-LSTM still has limitations in terms of retrieving textual material, and the many parameters might be a factor in the gradient expansion and disappearance problems. The next step will concentrate on developing more sophisticated neural networks and solving the gradient vanishing problem.
Disclosure statement
No potential conflict of interest was reported by the author(s).
References
- Alshubaily, I. (2021). Textcnn with attention for text classification. Computation and Language, 1–6. https://doi.org/10.48550/arXiv.2108.01921
- Ayub, M., Ghazanfar, M. A., Maqsood, M., & Saleem, A. (2018). A Jaccard base similarity measure to improve performance of CF based recommender systems. 2018 International Conference on Information Networking (ICOIN), 1–6. https://doi.org/10.1109/ICOIN.2018.8343073
- Bao, W., Bao, W., Du, J., Yang, Y., & Zhao, X. (2018). Attentive siamese LSTM network for semantic textual similarity measure. 2018 International Conference on Asian Language Processing (IALP), 312–317. https://doi.org/10.1109/IALP.2018.8629212
- Che, W., Liu, T., Qin, B., & Li, S. (2004). Similar Chinese sentence retrieval based on improved edit-distance. Gaojishu Tongxin/High Technology Letters, 14(7).
- David, M. B., Andrew, Y. N., & Michael, I. J. (2003). Latent dirichlet allocation. J Machine Learning Research Archive, 3, 993–1022. https://dl.acm.org/doi/10.5555944919.944937.
- Deng, H., Zhu, X., Qi, L. I., & Qi, P. (2017). Sentence similarity calculation based on syntactic structure and modifier. Computer Engineering, https://doi.org/10.3969/j.issn.1000-3428.2017.09.042.
- Devi, M. D., & Saharia, N. (2022). Unsupervised tweets categorization using semantic and statistical features. Multimedia Tools and Applications, https://doi.org/10.1007/s11042-022-13042-4
- Fan, Y., Gongshen, L., Kui, M., & Zhaoying, S. (2018). Neural feedback text clustering With BiLSTM-CNN-kmeans. IEEE Access, 6, 57460–57469. https://doi.org/10.1109/ACCESS.2018.2873327
- Farouk, M. (2020). Measuring text similarity based on structure and word embedding. Cognitive Systems Research, 63(1), 1–10. https://doi.org/10.1016/j.cogsys.2020.04.002
- Huan, H., Guo, Z. L., Cai, T. T., & He, Z. C. (2022). A text classification method based on a convolutional and bidirectional long short-term memory model. Connection Science, 34(1), 2108–2124. https://doi.org/10.1080/09540091.2022.2098926
- Hui-Fang, M. A., Liu, W., Zhi-Xin, L. I., & Lin, X. H. (2019). Combining coupled distance discrimination and strong classification features for short text similarity calculation. Acta Electronica Sinica.
- Jang, B., Kim, M., Harerimana, G., Kang, S., & Kim, J. (2020). Bi-LSTM model to increase accuracy in text classification: Combining Word2vec CNN and attention mechanism. Applied Sciences, 10(17), 5841–5842. https://doi.org/10.3390/app10175841
- Ji, M., & Zhang, X. (2022). A short text similarity calculation method combining semantic and headword attention mechanism. Scientific Programming, 2022, 1–9. https://doi.org/10.1155/2022/8252492
- Karim, F., Majumdar, S., Darabi, H., & Chen, S. (2018). Lstm fully convolutional networks for time series classification. IEEE Access, 6, 1662–1669. https://doi.org/10.1109/ACCESS.2017.2779939
- Kaur, H., & Maini, R. (2019). Granularity-Based assessment of similarity between short text strings. Proceedings of the Third International Conference on Microelectronics, Computing and Communication Systems, 91–107. https://doi.org/10.1007/978-981-13-7091-5_9
- Kenter, T., & De Rijke, M. (2015). Short text similarity with word embeddings. In Proceedings of the 24th ACM International on Conference on Information and Knowledge Management (CIKM ‘15). Association for Computing Machinery, New York, NY, USA, 1411–1420. https://doi.org/10.1145/2806416.2806475
- Li, X. G., Li, X. N., Chen, S., Ma, S., & Xie, F. (2022). Neural-based automatic scoring model for Chinese-English interpretation with a multi-indicator assessment. Connection Science, 34(1), 1638–1653. https://doi.org/10.1080/09540091.2022.2078279
- Li, Y., & He, W. (2022). English-Chinese machine translation model based on bidirectional neural network with attention mechanism. Journal of Sensors, 1–11. https://doi.org/10.1155/2022/5199248
- Lin, N. K., Li, J. X., & Jiang, S. Y. (2022). A simple but effective method for Indonesian automatic text summarisation. Connection Science, 34(1), 29–43. https://doi.org/10.1080/09540091.2021.1937942
- Liu, X. B., Zhang, Z., & Li, B. X. (2019). Keywords extraction method for technological demands of small and medium-sized enterprises based on LDA, 2019 Chinese Automation Congress (CAC), Hangzhou, 2855–2860. https://doi.org/10.1109/CAC48633.2019.8996936
- Luo, J., Xiong, W., Du, J., Liu, Y., Li, J., & Hu, D. (2021). Traditional Chinese medicine text similarity calculation model based on the bidirectional temporal siamese network. Evidence-Based Complementary and Alternative Medicine, 2021, 1–10. https://doi.org/10.1155/2021/2337924
- Maipradit, R., Hata, H., & Matsumoto, K. (2019). Sentiment classification using N-gram inverse document frequency and automated machine learning. IEEE Software, 36(5), 65–70. https://doi.org/10.1109/MS.2019.2919573
- Malandrino, D., De Prisco, R., Ianulardo, M., & Zaccagnino, R. (2022). An adaptive meta-heuristic for music plagiarism detection based on text similarity and clustering. Data Mining and Knowledge Discovery, 36, 1301–1334. https://doi.org/10.1007/s10618-022-00835-2
- Mueller, J., & Thyagarajan, A. (2016). Siamese recurrent architectures for learning sentence similarity. In Proceedings of the thirtieth AAAI Conference on Artificial Intelligence (AAAI'16), AAAI Press, 2786–2792. https://dl.acm.org/doi/10.55553016100.3016291
- Pu, H., Fei, G., Zhao, H., Hu, G., Jiao, C., & Xu, Z. (2017). Short text similarity calculation using semantic information. 2017 3rd International Conference on Big Data Computing and Communications (BIGCOM), 144-150. https://doi.org/10.1109/BIGCOM.2017.53
- Qin, M. Y. (2022). Application of efficient recognition algorithm based on deep neural network in English teaching scene. Connection Science, 34(1), 1913–1928. https://doi.org/10.1080/09540091.2022.2088699
- Sepas-Moghaddam, A., Pereira, F., Correia, P. L., & Etemad, A. (2021). Multi-Perspective LSTM for joint visual representation learning. 2021 IEEE/CVF Conference on Computer Vision and Pattern Recognition (CVPR), 16535–16543. https://doi.org/10.48550/arXiv.2105.02802
- Shi, C., Li, S., & Liu, B. (2021). Method for calculating short text similarity using multi-check weighted fusion. Computer Engineering, 47(2), 95–102.
- Singh, K., Devi, S., Devi, H., & KakotiMahantab, A. (2022). A novel approach for dimension reduction using word embedding: An enhanced text classification approach. International Journal of Information Management Data Insights, 2(1), 100061. https://doi.org/10.1016/j.jjimei.2022.100061
- Sundermeyer, M., Schlüter, R., & Ney, H. (2012). Lstm neural networks for language modeling. Proceedings of the 13th annual conference of the international speech communication association 2012, Portland, United States.
- Viji, D., & Revathy, S. (2022). A hybrid approach of Weighted Fine-Tuned BERT extraction with deep Siamese Bi – LSTM model for semantic text similarity identification. Multimedia Tools and Applications, 81(5), 6131–6157. https://doi.org/10.1007/s11042-021-11771-6
- Wan, S., Lan, Y., Guo, J., Xu, J., Pang, L., & Cheng, X. (2016). A deep architecture for semantic matching with multiple positional sentence representations. In Proceedings of the Thirtieth AAAI Conference on Artificial Intelligence (AAAI'16), AAAI Press, 2835–2841. https://dl.acm.org/doi/10.55553016100.3016298
- Wang, G., & Huang, X. (2019). Convolution neural network text classification model based on Word2vec and improved TF-IDF. Journal of Chinese Computer Systems, 40(5), 1120–1126.
- Wang, Q. Y., Zhu, G. L., Zhang, S. X., Li, K. C., & Chen, X. (2021). Extending emotional lexicon for improving the classification accuracy of Chinese film reviews. Connection Science, 33(2), 153–172. https://doi.org/10.1080/09540091.2020.1782839
- Wu, S., Liu, F., & Zhang, K. (2021). Communications in computer and information science. Communications in Computer and Information Science, 1363, 37–45. https://doi.org/10.1007/978-981-16-1354-8_4
- Yang, M., Li, P., & Zhu, Q. (2016). Lecture notes in computer science. International Conference on Computer Processing of Oriental Languages National CCF Conference on Natural Language Processing and Chinese Computing, 10102, 481–488. https://doi.org/10.1007/978-3-319-50496-4_40
- Yang, Z., Dai, Z., Yang, Y., Carbonell, J., Salakhutdinov, R., & Le Quoc, V. (2019). XLNet: Generalized autoregressive pretraining for language understanding. Proceedings of the 33rd International Conference on Neural Information Processing Systems, Curran Associates Inc., NY, USA, Article 517, 5753–5763. https://dl.acm.org/doi/10.55553454287.3454804
- Yao, L., Pan, Z., & Ning, H. (2019). Unlabeled short text similarity With LSTM encoder. IEEE Access, 7, 3430–3437. https://doi.org/10.1109/ACCESS.2018.2885698
- Yu, X., Feng, W., Wang, H., Chu, Q., & Chen, Q. (2020). An attention mechanism and multi-granularity-based Bi-LSTM model for Chinese Q&A system. Soft Computing, 24(8), 5831–5845. https://doi.org/10.1007/s00500-019-04367-8
- Zhang, P. Y., Chen, E. H., Xie, R. J., Cong, X. W., & Huang, B. (2018). A Jaccard base similarity measure to improve performance of CF based recommender systems. Systems Engineering and Electronics, 1–6. https://doi.org/10.1109/ICOIN.2018.8343073
- Zhang, S. X., Wu, H. Y., Xu, X., Zhu, G. L., & Hsieh, M. Y. (2022). CL-ECPE: contrastive learning with adversarial samples for emotion-cause pair extraction. Connection Science, 34(1), 1877–1894. https://doi.org/10.1080/09540091.2022.2082383
- Zhang, S. X., Yu, H. B., & Zhu, G. L. (2022). An emotional classification method of Chinese short comment text based on ELECTRA. Connection Science, 34(1), 254–273. https://doi.org/10.1080/0954-0091.2021.1985968
- Zhang, X. C., Lin-Feng, Y. U., & Zhang, Y. H. (2018). Multi-feature fusion for short text similarity calculation based on lda. Computer Science.
- Zhang, Y. J., Pei-Feng, L. I., & Zhu, Q. M. (2019). Event temporal relation classification method based on self-attention mechanism. Computer Science. Computer Science, 1–23.
- Zhao, W. D., Zhu, L., Wang, M., Zhang, X. L., & Zhang, J. M. (2022). WTL-CNN: A news text classification method of convolutional neural network based on weighted word embedding. Connection Science, 34(1), 2291–2312. https://doi.org/10.1080/09540091.2022.2117274