Abstract
With rabbit anti-bovine IgG, a reliable, highly selective and cheap method has been optimised and established for the determination of IgG in bovine colostrum. The method was based on the soluble immune complex precipitating from the liquid in the function of polyethylene glycol. Subsequently, the interference of casein, β-lactglobulin, α-lactalbumin, lactofemin and inactive IgG to the immunoassay was investigated. Finally, the assay was applied to the analysis of IgG in spiked milk samples. The limit of detection, calculated as three times of determinations’ standard deviation, was 0.07 mg/mL, with a practical working range between 0.2 and 0.8 mg/mL. The average recoveries of IgG in milk were 97.63%, 99.87%, 100.1% for 0.2 mg/mL, 0.5 mg/mL, 0.8 mg/mL, respectively. Eventually, confirmation test between immunoturbidimetry method and high performance liquid chromatography (HPLC) was carried out, and the results of the immunoassay were in accordance with that of HPLC.
Introduction
The importance of colostrum to the growth and health of newborn calfs is well recognised (Brambell, Citation1969; Burler, Citation1986; Logan, Foster & Irwin, Citation1978; Quigley & Drewry, Citation1998). In bovine colostrum, the immunoglobulin complement system provides a major antimicrobial effect against a wide range of microbes and confers passive immunity until the calfs own immune system gain its maturity. Bovine serum and lacteal secretions contain three major classes of immunoglobulins: IgG, IgM and IgA. The concentration of Igs varies from 30 to 200 mg/mL in the first colostrum (Korhonen, Syvaoja & Ahola, 1995; Stott, Fleenor & Kleese, 1981). IgG accounts for nearly 80% of the immunoglobulins in colostral whey, followed by IgM and IgA (Butler, Citation1994). All these immunoglobulins decrease within a few days to a total immunoglobulin concentration of 0.7–1.0 mg/ml, with IgG representing the predominant Ig subclass in milk. This review deals with the characteristics of bovine Igs and the complement system to be exploited as potential ingredients for health-promoting functional foods (Bielmann, Gillan & Perkins, 2010; Gay, Kronfeld & Grimsley, 2004; Korhonen, Marnila & Gill, 2000; Uruakpa, Ismond & Akobundu, 2002). Bovine colostrum and its products are usually applied as raw materials for a variety of healthy food, especially baby food, which makes it important to research and develop methodologies for accurate determination of the concentration of IgG in bovine colostrum.
Analytical methods involving immunodiffusion (Akita & Li, Citation1998; Li, Liu & Li, 2008) and high performance liquid chromatography (HPLC) (Ferreria, Citation2007; Merin, Bernstein & Bloch, 2001) have been used successfully for the detection of IgG. However, the concentration of denatured IgG probably included in detection value tested by HPLC, as a result that the detection value was not the true reflection of the active IgG concentration in bovine colostrum and its products. For immunodiffusion, the method is time-consuming, and it is not suitable for the analysis of a large number of samples (Liu & Li, Citation2006). Immunoturbidimetry method depicted in this paper is demonstrated as simple, rapid and cost-effective alternative to those traditional methods, and does not require specialised instrumentation. The method was firstly reported in 2008 (Jiang, Wu & Wang, 2008). In the paper, the interference of parameters including reaction temperature and reaction time to the method were investigated. However, the method could not detect the real bovine colostrum samples in the study. Based on the research, more parameters including sample's reaction volume, content of PEG, casein, β-lactglobulin, α-lactalbumin and lactofemin, inactive bovine IgG were investigated systematically. Afterward, the repeatability and reproducibility of the method were studied. And then, the confirmation test between the method and HPLC which was the only Chinese official standard method before 2010 was carried out. Finally, the real bovine samples could be detected by the method developed in this paper.
The principle of the method is as followed: soluble immune complex forms in the reaction between the IgG existed in bovine colostrum and rabbit anti-bovine IgG. The immune complex precipitates from the solution in the function of polyethylene glycol (PEG), which changes the turbidity of the test solution. As s result, the turbidity of the test solution is directly proportional to the content of IgG in bovine colostrum (Eckersall, Conner & Harvine, 1991).
Experimental
Chemicals, immunoreagents and instruments
Bovine colostrum were obtained from Boyuan Biological Engineering Co., Ltd (Harbin, China). Bovine IgG standard, rabbit anti-bovine IgG, lactofemin, casein, α-lactalbumin, β-lactglobulin and PEG (MW = 6000) were purchased from Sigma–Aldrich (St. Louis MO, USA). Absorbance was measured with UV spectrophotometer (Unicam, UK) at 340 nm.
Immunoturbidimetry method for immunoglobulin G
For immunoassays, the concentration of bovine IgG and rabbit anti-bovine IgG were optimised by checkerboard titration. Rabbit anti-bovine IgG (100 µg/ml, 250 µl/tube) was added to tubes in 10 mM phosphate-buffered saline (PBS, pH 7.4) containing 4% PEG, followed by 10 µl/tube of bovine IgG in PBS containing 4% PEG. After incubation at 37°C for 40 min, the absorbance of reaction solution was read at 340 nm subsequently. The standard curve was obtained by plotting the optical density (OD) value against the concentration of IgG.
Matrix interference
Milk protein mainly includes casein (75–85%), β-lactglobulin (7–12%), α-lactalbumin (2–5%) and lactofemin. Casein content in milk was about 35 mg/mL (Gao, Citation2009; Wang & Cao, Citation2008). According to the proportion of various essential proteins in milk and the protein ratio between bovine colostrum and regular milk, casein in 0.8 mg/mL, β-lactglobulin in 0.16 mg/mL, α-lactalbumin in 0.06 mg/mL, lactoferrin in 0.06 mg/mL were added to 0.4 mg/mL of IgG standard. Then the mixed solution was reacted with 0.1 mg/mL of rabbit anti-bovine IgG. Meanwhile, the reaction between 0.4 mg/mL of IgG standard and 0.1 mg/mL of rabbit anti-bovine IgG was taken as blank control. Each experiment was repeated six times (n=6), and a T test was conducted on the results between the two reactions.
To investigate the interference of inactive IgG to the immunochemical reaction, the concentrations of bovine IgG standards in 0.2 mg/mL, 0.4 mg/mL, 0.6 mg/mL, 0.8 mg/mL were inactivated for 30 min at 90°C, then the inactive bovine IgG standards were added to 0.4 mg/mL of IgG standard separately. Subsequently the four mixed solutions were reacted with 0.1 mg/mL of rabbit anti-bovine IgG. At the same time, the reaction between 0.4 mg/mL of IgG standard with 0.1 mg/mL of rabbit anti-bovine IgG was taken as the control experiment. Each experiment was repeated six times (n=6), and T tests were conducted on the results between the determinations of mixed solution including four concentrations of inactive IgG and control determinations separately.
Preparation of IgG standard and bovine colostrum samples
From a 1.0 mg/ml stock solution of IgG in 0.01 M PBS (pH 7.4), standards in range of 0.2 mg/ml to 0.8 mg/ml were prepared daily by serial dilution in PBS containing 4% PEG. Milk sample was bought from a local supermarket. The preparation of bovine colostrum was performed under the following procedures.
Liquid bovine colostrum samples: 2.0 mL of liquid colostrum sample was imbibed to centrifuge tube. After the centrifugation (1–5°C, 5000 rpm) for 30 min, the upper fat was discarded. Subsequently 1 mL of defatted bovine colostrum was diluted to 100–200 mL PBS containing 4% PEG. At last 10 µL portions were used for the test.
Solid bovine colostrum samples: after the crushing the solid colostrum samples, 0.2 g of solid colostrum sample was dissolved in 2 mL of deionised water. After the centrifugation (1–5°C, 5000 rpm) for 30 min, the upper fat was discarded. Subsequently 1 mL of defatted bovine colostrum was diluted to 50–100 mL PBS containing 4% PEG. At last 10 µL portions were used for the test.
Apparatus and chromatography
High performance liquid chromatographic analysis was performed with Waters 2695 (Waters corporation, USA) system equipped with waters 2487 ultraviolet detector (Waters corporation, USA), and samples were pretreated with National Standard Method of China (GB/T 5009. 194-2003).Chromatographic separations of IgG were performed on a Pharmacia HI-Trap Protein G column (Hewlett-Packard). A gradient programme was used with mobile phase, combining solvent A (pH 6.5, 0.05 mol/L phosphate buffer solution) and solvent B (pH w.5, 0.05 mol/L glycine–HCl buffer solution) as follows: 100% A (0–4.5 min), 100% B (4.5–15.0 min), 100% A (15–22 min), a subsequent re-equilibration time (3 min) was performed before next injection. The flow rate was 0.4 mL/min while the injection volume was 20 µL. Moreover, the detection wavelength of ultraviolet detector was set as 280 nm.
Results and discussion
Optimisation of the immunoturbidimetry
With the aim of improving immunoassay performance, the influence of several nonspecific parameters on assay characteristics was examined. Temperature is important physical parameter for the immunoassay. In general terms, the higher the temperature was, the shorter the incubation time needed. However at higher temperature, the intra-assay coefficient of variation (CV) increased evidently (Manclús & Montoya, Citation1996). Therefore, the commonly used incubation temperature of 37°C for reaction was selected and used throughout this work.
Optimisation of reaction volume for sample
When the OD value of reaction solution was tested with spectrophotometer, the result would be interfered by the residue of the previous reaction solution. Appropriate reaction volume could reduce the interference of the previous test sample. The concentration of 2 mg/mL for skimmed milk selected as the substituted sample in different volume was tested four times by spectrophotometer. The affection of different reaction volume to the test results is shown in .
Table 1. The affection of different test volume to the test results.
The test results indicated that with the smaller test volume, the parallelism of the data was imperfect. On the other hand, with the larger test volume, it will lead to the waste of IgG antibodies and antigens and increase the cost of each test. Therefore, the volume of 250 µL was chosen as the reaction volume.
Optimisation of reaction time
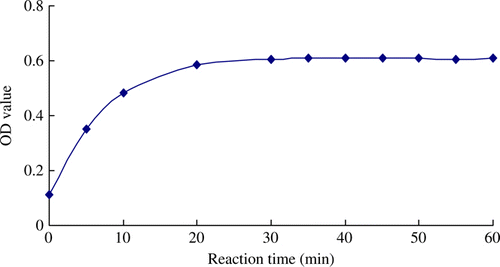
For the screening to the appropriate reaction time, the OD values of reaction complexes in different reaction time (0–60 min) were determined. The test results are shown in . It demonstrated that accompanying with the progress of the reaction in certain period (0–40 min), the absorbance of the reaction complex was increased. When the reaction processed for 40 min, the reaction equilibrium was achieved. As a result, 40 min was selected as the reaction time.
Optimisation of content of PEG
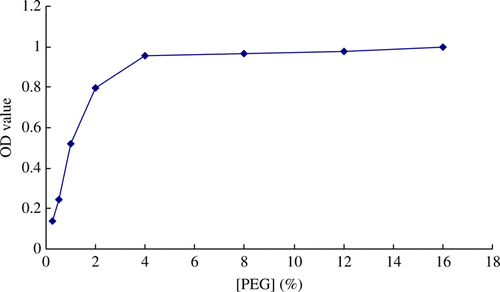
The precipitation of immune complexes from reaction solution would be affected by the content of PEG. In order to get the optimum content of PEG, the influences of various content of PEG on the precipitation (OD value of the immunoassay was set as evaluation index) were investigated. The results are given in . The results showed that the precipitation of immune complexes was affected significantly by the certain content range of PEG (0–4%). As a result, 4% PEG was selected as the optimum content in reaction buffer.
Optimisation of working concentration of IgG antibody
Maximal absorbance (Amax), dynamic range, and limit of detection are usually used as criteria to evaluate immunoassay performances. In this work, dynamic range was used as the primary criteria to evaluate the immunoassay performances, and Amax and limit of detection were also taken into account.
Different concentrations of rabbit anti-bovine IgG (25 µg/ml, 50 µg/ml, 100 µg/ml, 200 µg/ml) were chosen to react with a series of concentration of bovine IgG standard (0.05 mg/mL, 0.06 mg/mL, 0.07 mg/mL, 0.08 mg/mL, 0.09 mg/mL, 0.1 mg/mL, 0.2 mg/mL, 0.3 mg/mL, 0.4 mg/mL, 0.5 mg/mL, 0.6 mg/mL, 0.7 mg/mL, 0.8 mg/mL, 0.9 mg/mL, 1 mg/mL) in optimised condition before. Four standard curves were generated by plotting the OD values against the bovine IgG concentration, dynamic range of the four standard curves was gained subsequently. So in view of dynamic range, Amax and the limit of detection, the concentration of 100 µg/mL was selected as the working concentration.
Determination of dynamic range and detection limit of bovine IgG
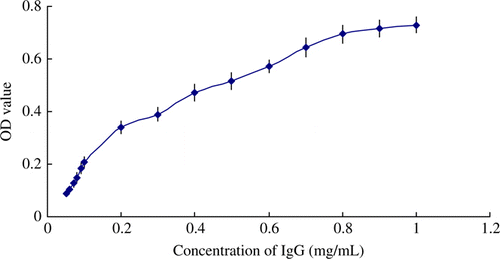
shows that standard curve of bovine IgG tested in four replicates. The OD value increased with increasing of bovine IgG concentrations. A linear correlation between the OD value and bovine IgG concentration was obtained between 0.2 and 0.8 mg/mL in the immunoassay. For detection limit, bovine colostrum powder sample was diluted to 2 mg/mL with 4% PEG buffer, and then the sample was tested by the method in 20 times. The detection limit was calculated by the three times of determination's standard deviation. In the experiment, the concentration of IgG in sample was 0. 463±0.023 mg/mL. The limit of detection was 0.07 mg/mL.
Matrix effect
The matrix effect of casein, β-lactglobulin, α-lactalbumin and lactofemin were investigated, and the results are given in . After calculation, t value was 2.200, which was less than t 0.05 (2.306, v=10). T-test results of the OD values of two reaction complexes which were the products of reaction between Rabbit anti-bovine IgG and bovine IgG solution containing four proteins, bovine IgG solution separately indicated that the difference in the OD values of the two reaction complexes was not significant (p>0.05). It showed that the matrix of casein, β-lactglobulin, α-lactalbumin and lactofemin almost did not affect the immunochemical reaction.
Table 2. OD value of each determination.
Meanwhile, the interference of inactive bovine IgG to the immunochemical reaction was studied, and the results are shown in . T-tests between determinations including each concentration of inactive IgG and controlled determinations were studied. After calculation, t values were 1.519, 2.177, 1.388 and 1.753 for inactivated IgG concentrations at 0.2 mg/mL, 0.4 mg/mL, 0.6 mg/mL and 0.8 mg/mL, which were all less than t 0.05 (2.306, v = 10). T-test results of the OD values in each two reaction complexes which were the products of reaction between Rabbit anti-bovine IgG and bovine IgG solution containing inactive bovine IgG, bovine IgG solution separately indicated that the difference in the OD values of the each two reaction complexes was not significant (p>0.05). It demonstrated that the immunochemical reaction would not be interfered by inactive bovine IgG.
Table 3. OD value of each determination.
Analysis of spiked milk samples
Because of the large amount bovine IgG existing in bovine colostrums, the calculating precision of spiked recovery would be affected. The components in colostrums and ordinary milk were similar, so ordinary milk was taken as the spiked sample. The concentration of Igs in ordinary milk was very low and relatively stable, accounting for only 1–2% of the protein, about 1–2 mg/mL (Larson, Citation1992). Therefore, the true determination value was the determination value got by the regression equation minus the original concentration.
The immunoassay established above was initially applied to detect the concentration of IgG. In order to evaluate and correct the interference caused by IgG originally existed in the milk, blank samples were tested simultaneously. The milk was prepared with the method described in Section 2.4, the same as bovine colostrum samples. Finally, the milk samples were diluted 200-fold. Subsequently, the pretreated samples were spiked with IgG at 0.2, 0.5 and 0.8 mg/ml. Then the solution was tested by the immunoassay directly. The results are given in . Precision obtained for milk meet the demand for a detection method, since most coefficients of variation were around or below 10%, and so were the recoveries (The mean was 97.63%, 99.87%, 100.1% f for 0.2 mg/mL, 0.5 mg/mL, 0.8 mg/mL, respectively).
Table 4. Determinations and recoveries of IgG from spiked milk samples.
Determination of bovine colostrum samples
Five liquid bovine colostrum samples and 10 bovine colostrum powder samples were determined by the method separately, and each determination was in five replicates. The samples were prepared with the method described in Section 2.4. Finally, the solid bovine colostrum samples were diluted to the concentration of 2 mg/mL, together with that liquid bovine colostrum samples were diluted 200-fold. Then, the concentrations of the IgG were detected with the method developed above. The test results of the liquid bovine colostrum samples and bovine colostrum powder samples are listed in and .
Table 5. Determination of IgG's content in liquid bovine colostrum samples.
Table 6. Determination of IgG's content in bovine colostrum powder samples.
Appropriate dilution for bovine colostrum sample was essential so that the concentration of IgG in pretreated test solution was within the practical working range. The recommended diluted concentration for solid bovine colostrum was 2 mg/mL, and the recommended dilution for liquid bovine colostrum was the dilution of 200 times. Of course, appropriate adjustments were necessary in detection of actual samples.
Precision
Repeatability
Four different samples of bovine colostrum powder were prepared with the method described in Section 2.4. Subsequently, the solid bovine colostrum samples were diluted to the concentration of 2 mg/mL with 4% PEG buffer. Then, the samples were determined by the method separately, and each determination was in five replicates. Each variation coefficients of the samples’ determinations were calculated and given in . The results showed that the range of variation coefficient was 2.03–3.60%, which indicated that the immunoassay had good repeatability.
Table 7. Repeatability results of the immunoassay.
Reproducibility
Eight different samples of bovine colostrum powder were prepared with the method described in Section 2.4, and the samples were diluted with 4% PEG buffer to the concentration of 2 mg/mL. Meanwhile, the samples were measured four times by different testers in certain interval. Subsequently, coefficients of variation of the samples’ determinations were calculated, and the results are given in . The results indicated that the method had good performance in reproducibility, since all coefficients of variation of the eight samples were below 10%.
Table 8. Reproducibility results of the immunoassay.
Confirmation test
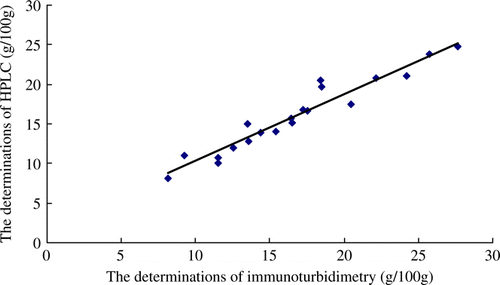
Twenty bovine colostrum powder samples were analysed both by immunoturbidimetry method and HPLC method. The methods for sample preparation were described in Sections 2.4 and 2.5. The correlation results between were immunoturbidimetry method and HPLC method are shown in . Regression equation between immunoturbidimetry method and HPLC method was established. The result was given as follows: y = 0.843x + 1.893. Correlation between the two methods showed a good linear relationship, with R 2 values was 0.930.
Conclusions
The application of the immunoassay to the determination of IgG in bovine colostrum samples showed good characteristics with simple operation, good specificity and celerity, which indicated the potential of this approach for routine analysis of IgG in bovine colostrum samples. The study proved that method is a promising alternative or complementary method for the determination of pesticides residue. This test could be a valuable model for optimisation of immunoturbidimetry method for nutrition components of concern in functional foods or drinks.
Acknowledgements
This study was supported by Drafting Project of Chinese Agricultural Standard (2007-124) and Fundamental Research Funds for Chinese Central Public-interest Institution (No. 0032011011). The authors expressed sincere gratitude to Chinese Ministry of Agriculture for the financial support. The authors state that there are no conflicts of interest. Contribution made by each author to the research is as follows: M.J. is a PhD researcher who contributed to the design of immunoassay experiment. Z.J. is the professor, specialist in the detection of nutrition component. H.S. and F.J. provided technical assistance for the HPLC analysis. T.C. helped to finish the statistical analysis and revise the paper. J.W. is the professor and is an expert in the study of nutritional application and food safety.
References
- Akita , E.M. and Li , C.E. 1998 . Isolation of bovine immunoglobulin G subclasses from milk, colostrum, and whey using immobilized egg yolk antibodies . Journal of Dairy Science , 81 : 54 – 63 .
- Bielmann , V. , Gillan , J. , Perkins , N. , Stidmore , A. , Godden , S. and Leslie , K. 2010 . An evaluation of Brix refractometry instruments for measurement of colostrum quality in dairy cattle . Journal of Dairy Science , 93 : 3713 – 3721 .
- Brambell , F.W. 1969 . The transmission of immune globulins from the mother to the foetal and newborn young . Proceedings of the Nutrition Society , 28 : 35 – 41 .
- Burler , J.E. 1986 . Biochemistry and biology of ruminant immunoglobulins . Progress in Veterinary Microbiology and Immunology , 2 : 1 – 53 .
- Butler , J.E. 1994 . Passive immunity and immunoglobulin diversity. In Indigenous Antimicrobial Agents of Milk-recent Developments . IDF Special Issue 9404 , 4 : 14 – 50 .
- Eckersall , P.D. , Conner , J.G. and Harvine , J. 1991 . An immunoturbidimetric assay for canine C-reactive protein . Veterinary Research Communication , 15 : 17 – 24 .
- Ferreria , I. 2007 . Chromatographic separation and quantification of major human milk proteins . Journal of Liquid Chromatography & Related Technologies , 30 : 499 – 507 .
- Gao , H.D. 2009 . How to improve the content of protein in milk . Feeding management , 8 : 29
- Gay , L.S. , Kronfeld , D.S. , Grimsley , C.A. , Dascanio , J. , Ordakowski-Burk , R.K. and Splan , R. 2004 . Retinol, beta-carotene and beta-tocopherol concentrations in mare and foal plasma and in colostrum . Journal of Equine Veterinary Science , 24 : 115 – 120 .
- Jiang , Z.M. , Wu , G. , Wang , J. and Tian , B. 2008 . Bovine clostrum immunoglobulinG determination by immunoturbidimetry Method . Chinese Food Science , 29 : 298 – 300 .
- Korhonen , H. , Marnila , P. and Gill , H.S. 2000 . Milk immunoglobulins and complement factors . British Journal of Nutrition , 84 : S75 – S80 .
- Korhonen , H. , Syvaoja , E.L. , Ahola , L.H. , Sivela , S. , Kopola , S. and Husu , J. 1995 . Bactericidal effect of bovine normal and immune serum, colostrum and milk against helicobacter pylori . Journal of Applied Microbiology , 78 : 655 – 662 .
- Larson , B.L. 1992 . “ Immunoglobulins of the mammary secretions ” . In Advanced dairy chemistry 1-proteins , Edited by: Fox , P.F. 231 – 254 . London : Elsevier Science Publishers .
- Li , Z.Q. , Liu , C.L. , Li , M. and Wang , J.W. 2008 . Modified single immunediffusion method and detection of the content of IgG in bovine colostrum . China Dairy Cattle , 3 : 41 – 44 .
- Liu , C.L. and Li , Z.Q. 2006 . Comparative study on detection of bovine colostrums IgG with immunogold and single immunediffusion methods . Journal of Jilin Agricultural University , 28 : 458 – 461 .
- Logan , E.F. , Foster , W.H. and Irwin , D. 1978 . A note on bovine colostrum as an alternative source of immunoglobulin for lambs . British Journal of Nutrition , 26 : 93 – 96 .
- Manclús , J.J. and Montoya , A. 1996 . Development of enzyme-linked immunosorbent assays for 3, 5, 6-trichloro-2-pyridinol. 2. Assay optimization and application to environmental water samples . Journal of Agricultural and Food Chemistry , 44 : 3710 – 3716 .
- Merin , U. , Bernstein , S. , Bloch , D.A. , Yagil , R. , Creveld , C. and Linder , P. 2001 . A comparative study of milk serum proteins in camel (Camelus dromedarius) and bovine colostrum . Livest Production Science , 67 : 297 – 301 .
- Quigley , J.D. and Drewry , J.J. 1998 . Nutrient and immunity transfer from cow to calf pre- and postcalving . Journal of Dairy Science , 81 : 2779 – 2790 .
- Stott , G.H. , Fleenor , W.A. and Kleese , W.C. 1981 . Colostral immunoglobulin in two fractions of first milking postpartum and five additional milkings . Journal of Dairy Science , 64 : 459 – 465 .
- Uruakpa , F.O. , Ismond , M.A. and Akobundu , E.N. 2002 . Colostrum and its benefits: a review . Nutrition Research , 22 : 755 – 767 .
- Wang , X.S. and Cao , D.Q. 2008 . Determination of casein content in several milk daily consumed . Journal of Qiqihar Medical College , 29 : 320 – 322 .


