
Abstract
An indirect competitive chemiluminescent enzyme immunoassay method was developed for screening malachite green (MG). Assay conditions, including the concentration of coating, antibody dilution, incubation time, dilution buffer, ionic strength and pH, were optimised. Under the optimised conditions, coating antigen concentration was 125 ng/mL; and dilution fold of antibody was 40,000. The 50% inhibition values of 0.22 ng/mL for MG were achieved with a limit of detection of 0.01 ng/mL, the linear range was from 0.03 ng/mL to 3.27 ng/mL. The assay showed a little cross-reactivity of 3.4%, 2.7% and 1.0% with methylene blue, brilliant green and crystal violet, respectively, and negligible cross-reactivity with other analogues of MG. The developed method has been used to quantify MG in seafood samples. The recovery of MG ranged from 82.43% to 108.0% at four concentrations (0.1, 1, 3 and 5 ng/mL), and the coefficients of variation were less than 13%. A comparison results between the high-performance liquid chromatography and the developed assay showed good relativity. The results indicated that the assay was a sensitive and stable method for screening MG.
Introduction
Malachite green (MG) is used as triphenylmethane dye in the textile and paper industries, as a colouring agent and also as a food additive (Schnick, Citation1988; Singh, Gupta, Singh, & Sinha, Citation2011). It has never been authorised as a veterinary medicine.
Due to its effectiveness and relatively low cost, it was introduced as a procurable agent for freshwater fish, it had been used extensively in the aquaculture industry as one of the most efficacious fungicides, parasiticides, disinfectant and bacteriocides (Bergwerff & Scherpenisse, Citation2003; Cha, Doerge, & Cerniglia, Citation2001; Guo, Gai, Hao, Duan, & Wang, Citation2011; Hao, Kim, & Chiang, Citation2000; Van de Riet, Murphy, Pearce, Potter, & Burns, Citation2005). And it still was found in national residues monitoring plans conducted in the EU and the USA.
The effectiveness of MG against proliferative kidney disease has rapidly expanded its illegal use in the culture of fish eggs, fingerlings and adult fish. MG and its metabolite have negative effects on the immune and reproductive systems and potential mutagenicity and teratogenicity properties (Bueno et al., Citation2010; He et al., Citation2010; Li, Shen, Liang, He, & He, Citation2011; Oplatowska, Donnelly, Majithiya, Glenn Kennedy, & Elliott, Citation2011; Singh et al., Citation2011). The residues found in farmed fish products may also originate from environmental pollution due to dyestuff discharged into streams without pretreatment (Pourreza & Elhami, Citation2007). Residues of MG are not permitted in food of animal origin in China, the USA and European Commission (Shen et al., Citation2011), and its use has been banned completely in the aquaculture industry.
Therefore, surveillance of MG in aquaculture products is necessary due to the potential misuse and the probability of environmental contamination of waterways and for the purpose of human health protection. Commission Decision 2004/25/EC stated that analytical methods for the determination of MG residues in aquaculture products must meet a minimum required performance limit of 2 µg/kg (EC, Citation2004).
In response to concerns regarding the health risks associated with the use of MG, an increasing number of methods have been developed in recent years for their determination. Quantitative analysis of MG in fish tissue today is usually performed by immunoassay method, liquid chromatography–mass spectrometry, gas chromatography–mass spectrometry and capillary electrophoresis (Anderson, Turnipseed, & Roybal, Citation2006; Bahram, Keshvari, & Najafi-Moghaddam, Citation2011; Bilandzic, Varenina, Kolanovic, Oraic, & Zrncic, Citation2012; Tao et al., Citation2011; Tsai, Chan, Lin, Chang, & Chia, Citation2006; Van de Riet et al., Citation2005; Villar-Pulido, Gilbert-López, García-Reyes, Martos, & Molina-Díaz, Citation2011).
Although these methods are sensitive, they are time-consuming and expensive; they need complex sample preparation steps including solvent extraction, liquid–liquid extraction, column chromatographic cleanup and high cost of instruments and equipment. Compared with chromatographic techniques, immunoassays are rapid, specific and sensitive analytical methods, which are cost and time effectiveness. Immunoassays have been used to determine MG (Xing et al., Citation2009; Yang et al., Citation2007). Moreover, chemiluminescence (CL) is a highly sensitive method, which can display simplicity, sensitivity, low detection limits, wide linear dynamic ranges, non-radioactive pollution and speed of response with low cost and portable instrumentation.
The CL immunoassay is a combination of sensitive CL detection and specific immunosorbent assay. The chemiluminescence enzyme immunoassay (CLEIA), in which enzyme labels are detected by CL substrates, such as the luminol/peroxide/enhancer system for horseradish peroxidase (HRP) or dioxetane-based substrates for alkaline phosphatase, is one of the most sensitive immunoassay detection systems (Knopp Citation2006; Magliulo et al., Citation2005). In recent years, CLEIA has been widely applied in different samples such as sulfonamide residues in chicken muscle and pig muscle, zearalenone, aflatoxin B1 and dexamethasone in food products (Liu, Fang, Zhang, Zheng, & Wang, Citation2009; Vdovenko, Gribas, Vylegzhanina, & Sakharov, Citation2012; Wang et al., Citation2013; Yu, Gribas, Vdovenko, & Sakharov, Citation2013).
In this paper, we have developed an indirect competitive CLEIA based on a polyclonal antibody and HRP-labelled secondary antibody CL system to detect MG residues in seafood. To our knowledge, little information has been reported on the production of antibodies against MG and the development of a related CLEIA. The application of the method to different kinds of seafood, the validation and comparison of analytical results to those obtained by high-performance liquid chromatography (HPLC) method prove the method's suitability of screening MG and help to curb the illegal use of MG.
Materials and methods
Apparatus
Chemiluminescent intensity was recorded using a Wallac 1420 VICTOR3 multilabel counter (PerkinElmer, USA). Plates were washed in a Multiskan MK2 microplate washer (Thermo Scientific, Hudson, USA) to flush unattached substance away. Opaque high-binding 96-well plates were purchased from Shenzhen Jincanhua Industrial Co., Ltd. (Shenzhen, China). HPLC–UV analysis was carried out on the LC-20 AT HPLC system (Shimadzu, Japan).
Reagents
Ovalbumin (OVA), bovine serum albumin (BSA), dicyclohexylcarbodiimide (DCC), N-hydroxysuccinimide (NHS), MG, methylene blue (MB), brilliant green (BG), crystal violet, leuco malachite green (LMG), leuco crystal violet (LCV) and Astrazon orange (AO) standards; HRP and HRP-conjugated goat anti-rabbit IgG (secondary antibody) were obtained from Sigma-Aldrich (St. Louis, USA). Oxammonium hydrochloride, paratoluenesulfonic acid, acetonitrile, methylene dichloride and Tween-20 were obtained from Tianjin Damao Chemical Reagent Co., Ltd. (Tianjin, China). The Super Signal West Pico CL substrate (luminol/enhancer, A; stable peroxide buffer, B) was obtained from Pierce Protein Research Products (Thermo Fisher Scientific Inc., Illinois, USA). The anti-MG polyclonal antibody was prepared in our laboratory. All other reagents were of analytical grade and obtained from a local chemical supplier (Yunhui Trade Co., Ltd., Guangzhou, China).
Buffers
The following buffers were used: (1) coating solution, carbonate buffer (100 mmol/L, pH 9.6) and (2) blocking solution, 5% skim milk in phosphate buffered saline containing 0.05% Tween-20 (PBST); phosphate buffer (20 mmol/L, pH 7.0); phosphate buffered saline (PBS, 20 mmol/L, pH 7.4) and PBST (PBS containing 0.05% Tween-20, pH 7.4).
Preparation of the haptens
The LMG haptens were prepared according to the earlier literature (Shen et al., Citation2008). Purified haptens of LMG (5 g), H2O (10 mL), PbO2 (5 g) and concentrated hydrochloric acid (1 mL) were mixed in round-bottomed flask (100 mL). The mixture was stirred gently at ambient temperature overnight. The reaction product was washed with methanol; diatomite chromatography was used to purify haptens initially and then silica gel column was used as final purification in order to obtain MG haptens.
Preparation of hapten–protein conjugates
Hapten was coupled to BSA or OVA, to synthesise immunogen (hapten–BSA) and plate-coating antigen (hapten–OVA), via the active ester method. Briefly, hapten (0.1 mmol), NHS (14.4 mg) and DCC (27.5 mg) were dissolved in dimethylformamide (DMF) (1000 µL). The mixture was stirred gently at 4°C overnight, and then centrifuged at 10,956 × g for 5 min. The supernatant (900 µL) was added in drops to BSA (68 mg) or OVA (90 mg) in 9 mL PBS (0.1 mol/L, pH 7.4). The mixture was stirred at 4°C for 12 h and then dialysed against PBS (0.01 mol/L, pH 7.4) at 4°C for two days to obtain immunogen (hapten–BSA) and plate-coating antigen (hapten–OVA).
Preparation of polyclonal antibodies
Antibodies were raised via an intramuscular injection of immunogen (hapten–BSA) given to two New Zealand white rabbits for immunogen, weighing 1.5–2.0 kg. In brief, immunogen (0.5 mg) was dissolved in saline and emulsified with an equal volume of Freund's complete adjuvant. The rabbit (housed at the Guangdong Medical Laboratory Animal Center) was immunised four times using emulsified immunogen, at intervals of 28 days. Freund's incomplete adjuvant was used for the booster muscle injection. Blood from the rabbits was collected on the eighth day after the fourth immunisation. The obtained antiserum was isolated by centrifugation and stored at –20°C until use. Negative serum was obtained from an unimmunised rabbit.
Calibration curves
Calibration curves were prepared for quantification. MG standard solution (1000 ng/mL) was prepared from a 1 mg/mL stock solution in methanol and diluted with PBS to provide a series of standards containing 39.45, 13.15, 4.05, 1.35, 0.45, 0.15, 0.05, 0.017 and 0 ng/mL of MG.
Immunoassay procedure
Plates were coated with MG–OVA (125 ng/mL, 100 µL/well) in carbonate buffer overnight at 37°C after washing two times with PBST and blocking with 5% skim milk in PBST (120 µL/well) for 3 h at 37°C. After removing the liquid, the plates were dried at 37°C overnight. Individual MG standards or samples (50 µL/well) were added to the wells followed by the addition of anti-MG antibody diluted (1:40,000, 50 µL/well). The plate was incubated for 40 min at 37°C. After washing five times with PBST, 100 µL of HRP-conjugated goat anti-rabbit IgG (secondary antibody; 1:8000) was added and further incubated for 20 min at 37°C. After washing five times with PBST, the CL substrate (50 µL of A and 50 µL of B) was added. The plate was shaken gently for 1 min at room temperature and the CL intensity was recorded [expressed as relative light unit (RLU)]. Competitive curves were obtained by plotting inhibition rate against the logarithm of analyte concentration. Sigmoid curves were generated using OriginPro 8.0 software (OriginLab Corp., Northampton, MA, USA).
Sample preparation
Blank samples of seafood (2 g) were homogenised; a MG standard solution and 0.36 mol/L oxammonium hydrochloride (0.4 mL), 1.0 mol/L paratoluenesulfonic acid (0.6 mL) and 0.05 mol/L ammonium acetate (1.0 mL) were added, and the mixture shaken strongly for 10 seconds, acetonitrile (4.0 mL) was added, then the mixture shaken for 10 min. The samples were centrifuged at 4000 × g for 5 min and the homogenisation process was repeated. The supernatants were combined and methylene dichloride was added (4.0 mL) under shaking for 5 seconds, and then lower solution was dried under a steam of nitrogen at 40°C. The residue was dissolved in PBS (2.0 mL) and n-hexane (2.0 mL). The sample was shaken for 1 min and then centrifuged at 4000 × g for 5 min, and lower solution was determined.
Evaluation of recovery
Diluted MG analytical standard solutions in methanol (1 µg/mL) were added to the samples of seafood up to final concentrations of 0.1, 1, 3 or 5 ng/mL. The samples were then subjected to pretreatment as described above. The final solution was used for CLEIA analysis.
HPLC confirmation
HPLC method was developed on C18 column with UV detection at the wavelength of 618 nm. The mobile phase consisted of (1) acetonitrile and (2) 0.05 mol/L ammonium acetate (pH 4.5) in the ratio of 80:20 (v/v). The flow rate of the mobile phase was 1 mL/min and an aliquot of 20 µL of each sample was injected into the HPLC system, and the retention time is 4.7 min.
Samples were spiked with MG at three concentrations (20, 40 and 80 ng/mL) for CLEIA and HPLC analysis. The solution was determined directly by HPLC after sample preparation, while diluted 25-fold with PBS for CLEIA analysis.
Results and discussion
Optimisation of CLEIA
To improve the performance of the assay and the sensitivity of the immunoreaction, several experimental parameters, including the coating concentration, antibody dilution, competitive reaction time, dilution buffer, ionic strength and pH, were investigated. For each condition, standard curves for MG were established using the concentration of MG and the RLU.
RLUmax and IC50 values were acquired from the standard curves, where IC50 was a 50% decrease in RLUmax. The IC50 value and RLUmax/IC50 ratio were used to evaluate the effect of different parameters on CLEIA performance. Lower IC50 values and higher RLUmax/IC50 ratios indicated increased sensitivity of the assay (Botchkareva et al., Citation2003; Pang et al., Citation2008).
Optimisation of coating concentration and antibody dilution ratios
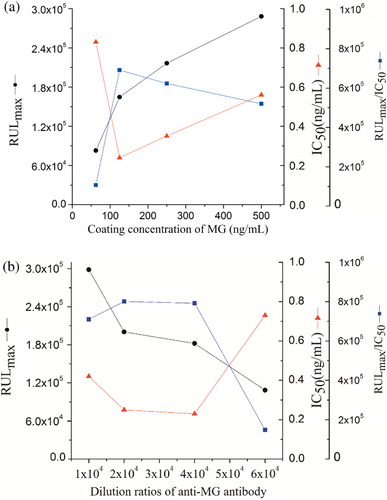
Dilution ratios of the coating concentration (1 mg/mL) and the antibody were investigated using standard curves ranging from 62.5 to 500 ng/mL and 10,000 to 60,000, respectively (). The IC50 value first decreased and then increased as the dilution ratios of the coating concentration increased, and the reverse was observed for the RLUmax/IC50 ratio (). The same trend was observed for the dilution ratio of the primary antibody (). The highest level of sensitivity was obtained with coating concentration and antibody dilution ratios of 125 ng/mL and 1:40,000, respectively.
Optimisation of reaction times
In order to evaluate the effect of varying competitive reaction times of the medium on assay performance, competitive reaction times of 20, 30, 40, 50 and 60 min were investigated. The RLUmax/IC50 ratio reached a peak and then stabilised after an incubation period of 40 min (), indicating that an incubation time of 40 min is sufficient for the antibody–antigen interaction to reach equilibrium.
Optimisation of the dilution buffer, ionic strength and buffer pH
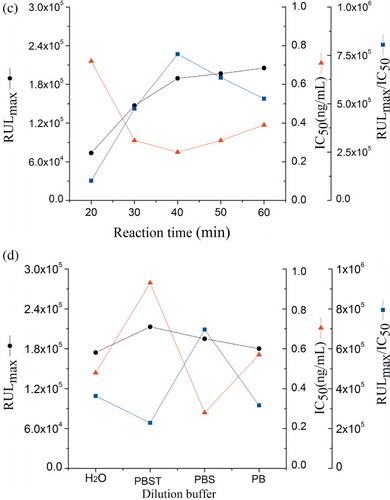
Antigen–antibody binding is characterised by weak intermolecular bonds that can be affected by the dilution buffer, ionic strength and pH value (Long, Shi, He, Sheng, & Wang, Citation2009). The standard solutions of MG were investigated in different buffers: PB (20 mmol/L, pH 7.0), PBS (20 mmol/L, pH 7.4) and PBST (PBS containing 0.05% Tween-20, pH 7.4), as well as deionised water. The highest sensitivity and maximum RLUmax/IC50 value were obtained with PBS ().
Immunoassays were carried out at increasing PBS concentrations varying from 0.005 to 0.03 mol/L at constant pH. The result showed that the RLUmax/IC50 value increased gradually when buffer concentrations increased from 0.005 to 0.02 mol/L and then decreased. Therefore, 0.02 mol/L of PBS was selected as the optimal concentration due to the maximal RLUmax/IC50 and minimum IC50 ().
Five pH values (5.4, 6.4, 7.4, 8.4 and 9.4) of PBS were tested. The effect of pH on the assay performance (IC50, RLUmax and RLUmax/IC50) is shown in . The results indicated that the IC50 value was stable in between 6.4 and 7.4 nearly, and the RLUmax/IC50 ratio was decreased rapidly below pH 6.4 or above 7.4. It was the most favourable at pH 6.4 of analyte solution for the MG immunoassay based on physical properties of MG.
Analytical parameters of the optimised immunoassays
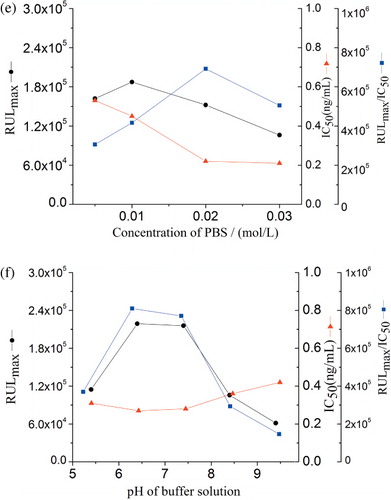
Dose-dependent inhibition rate curves obtained with the CLEIA using the optimised conditions are presented in . The limit of quantification (LOQ), determined as the concentration causing 20–80% inhibition of maximal CL intensity, was 0.03–3.27 ng/mL, the IC50 value was 0.22 ng/mL. The limit of detection (LOD) is the smallest concentration of the analyte that produces a signal that can be significantly distinguished from zero for a given sample matrix, with a stated degree of confidence. There is a general consensus in favour of selecting the dose which inhibits 10% of the binding of the antibody with the enzyme tracer at 90% inhibition (IC10; Guo, Gui, & Wang, Citation2007; Hennion & Barcelo, Citation1998; Xu et al., Citation2012). In this study, the LOD for MG was 0.01 ng/mL.
Cross-reactivity
When developing an immunoassay system, it is not sufficient to not only prove its efficacy in buffer or given matrices, but also several other examinations are required. Specificity should be considered one of the most important factors for an immunoassay. The specificity of the proposed anti-MG polyclonal antibody was evaluated by analysing the extent of cross-reactivity with six structurally related compounds: MB, BG, crystal violet, LMG, LCV and AO. The lower the cross-reactivity, the more specific the antibody is; consequently the immunoassay becomes more reliable and acceptable. The anti-MG polyclonal antibody showed some cross-reactivity with MB (3.4%), BG (2.7%) and crystal violet (1.0%), but negligible cross-reactivity with other analogues (). In this case, the polyclonal antibodies obtained showed high specificity for MG. Thus, the antibodies were useful for the selective detection of MG.
Table 1. Cross-reactivity of MG antisera with analogues.
Aquaculture tissue sample analysis
To assess the precision of the assay, aquaculture tissue samples (negative for MG), including fish and shrimp, were spiked with MG at five different concentrations (0.05, 0.15, 0.45, 1.35 and 4.05 ng/mL). The samples were treated following the procedure described. The mean value (±SD) and the coefficient of variation (CV) of the concentration of MG in the different samples, determined from replicate analyses (n = 4) in the same run (intra-assay) and in separate runs (inter-assay; Even, Sandusky, Barnard, Mistry, & Sinha, Citation2007), are shown in . The intra-assay precision values (measured as CV%) and the inter-assay values were all below 13%. These results indicate an acceptable degree of parallelism and precision, when the assay is applied to real samples.
Table 2. Intra-assay and inter-assay precision at different concentration of MG.
Determination of recovery
To determine the sensitivity and reproducibility of the proposed CLEIA, recovery tests from spiked samples were performed. Samples were spiked with MG at four concentrations (0.1, 1, 3 and 5 ng/mL) and diluted 2-fold with PBS for CLEIA analysis. Each sample was evaluated three times in duplicate to verify the repeatability. The results are shown in .
Table 3. Recoveries of MG from spiked fish and shrimp by CLEIA.
The recovery values from seafood samples ranged from 82.43% to 108.0%, and the mean recovery values of intra-assay and inter-assay were 93.77% and 93.5%, respectively. The CV values ranged from 5.36% to 12.5%, and the mean CV values of intra-assay and inter-assay were 9.17% and 8.6%, respectively. The reproducibility of this assay is acceptable for use in screening.
Validation assay
In this part, CLEIA was compared with HPLC by the determination of MG in seafood. Eight seafood samples were determined by CLEIA and HPLC. The values obtained from the two detection systems fit an excellent linear relationship (), with a regression equation of y = 0.9003x + 2.2196 and correlation coefficient of 0.992, further confirming the reliability of the CLEIA.
Table 4. Analytical result of indirect competitive CLEIA and HPLC methods (n = 4).
Conclusions
A sensitive, simple, quick and specific CLEIA using luminol system for HRP was developed and applied to monitor and measure MG residues in seafood. On this point, based on an enhanced CL system, CLEIA method offered significantly higher sensitivity, with an IC50 value of 0.22 ng/mL, 10 times greater than that obtained with traditional enzyme-linked immunosorbent assay (ELISA) method (Xing et al., Citation2009), and small detection limit was 0.01 ng/mL. The CLEIA showed higher dynamic range of linearity (0.03–3.27 ng/mL) than the ELISA (Yang et al., Citation2007), some cross-reactivity with MB (3.4%), BG (2.7%) and crystal violet (1.0%), but negligible cross-reactivity with other analogues. The recovery values for spiked seafood samples ranged from 82.43% to 108.0%, the CV values were less than 13% and the mean CV values of intra-assay and inter-assay were 9.17% and 8.6%, respectively. Good agreement was obtained between the CLEIA and HPLC methods for screening MG. Therefore, the CLEIA method developed should have potential applications for the real-time, large-scale screening of trace levels of MG residues in seafood.
Funding
This work was supported by National Natural Science Foundation of China [grant number 31201361]; the Science and Technology Project of Guangzhou City [grant number 11BppZXcc2100021]; the Science and Technology Project of Guangdong Province [grant numbers 2010A032000001-4, 2012A020100002]; the National Spark Program [grant number 2012GA780001] and the Program of Pearl River Young Talents of Science and Technology in Guangzhou, China [grant number 2013J2200080].
Additional information
Funding
References
- Anderson, W. C., Turnipseed, S. B., & Roybal, J. E. (2006). Quantitative and confirmatory analyses of malachite green and leucomalachite green residues in fish and shrimp. Journal of Agricultural and Food Chemistry, 54, 4517–4523. doi: 10.1021/jf0532258
- Bahram, M., Keshvari, F., & Najafi-Moghaddam, P. (2011). Development of cloud point extraction using pH-sensitive hydrogel for preconcentration and determination of malachite green. Talanta, 85, 891–896. doi: 10.1016/j.talanta.2011.04.074
- Bergwerff, A., & Scherpenisse, P. (2003). Determination of residues of malachite green in aquatic animals. Journal of Chromatography B, 788, 351–359. doi: 10.1016/S1570-0232(03)00042-4
- Bilandzic, N., Varenina, I., Kolanovic, B. S., Oraic, D., & Zrncic, S. (2012). Malachite green residues in farmed fish in Croatia. Food Control, 26, 393–396. doi: 10.1016/j.foodcont.2012.02.001
- Botchkareva, A. E., Eremin, S. A., Montoya, A., Manclus, J. J., Mickova, B., Rauch, P., … Girotti, S. (2003). Development of chemiluminescent ELISAs to DDT and its metabolites in food and environmental samples. Journal of Immunological Methods, 283, 45–57. doi: 10.1016/j.jim.2003.08.016
- Bueno, M. J. M., Herrera, S., Uclés, A., Agüera, A., Hernando, M. D., Shimelis, O., … Fernández-Alba, A. R. (2010). Determination of malachite green residues in fish using molecularly imprinted solid-phase extraction followed by liquid chromatography-linearion trap mass spectrometry. Analytica Chimica Acta, 665, 47–54. doi: 10.1016/j.aca.2010.03.001
- Cha, C. J., Doerge, D. R., & Cerniglia, C. E. (2001). Biotransformation of malachite green by the fungus Cunninghamella elegans. Applied and Environmental Microbiology, 67, 4358–4360. doi: 10.1128/AEM.67.9.4358-4360.2001
- EC. (2004). Commission Decision 2004/25/EC, as regards the setting of minimum required performance limits (MRPLs) for certain residues in food of animal origin. Official Journal of European Union, L6, 38–39.
- Even, M. S., Sandusky, C. B., Barnard, N. D., Mistry, J., & Sinha, M. K. (2007). Development of a novel ELISA for human insulin using monoclonal antibodies produced in serum-free cell culture medium. Clinical Biochemistry, 40, 98–103. doi: 10.1016/j.clinbiochem.2006.10.004
- Guo, Y. R., Gui, W. J., & Wang, S. T. (2007). Development and performance testing of Chloramphenicol ELISA kit. J CIFST, 7, 118–123.
- Guo, Z. Y., Gai, P. P., Hao, T. T., Duan, J., & Wang, S. (2011). Determination of malachite green residues in fish using a highly sensitive electro-chemiluminescence method combined with molecularly imprinted solid phase extraction. Journal of Agricultural and Food Chemistry, 59, 5257–5262. doi: 10.1021/jf2008502
- Hao, O. J., Kim, H., & Chiang, P. C. (2000). Decolorization of wastewater. Environmental Science & Technology, 30, 449–505. doi: 10.1080/10643380091184237
- He, H., Yang, S., Yu, K., Ju, Y., Sun, C., & Wang, L. (2010). Microwave assisted induced catalytic degradation of crystal violet in nano-nickel dioxide suspensions. Journal of Hazardous Materials, 173, 393–400. doi: 10.1016/j.jhazmat.2009.08.084
- Hennion, M. C., & Barcelo, D. (1998). Strengths and limitations of immunoassays for effective and efficient use for pesticide analysis in water samples: A review. Analytica Chimica Acta, 362, 3–34. doi: 10.1016/S0003-2670(97)00608-9
- Knopp, D. (2006). Immunoassay development for environmental analysis. Analytical and Bioanalytical Chemistry, 385, 425–427. doi: 10.1007/s00216-006-0465-7
- Li, G. Y., Shen, D., Liang, X. F., He, Y., & He, S. (2011). Effects of malachite green on the mRNA expression of detoxification-related genes in Nile tilapia (Oreochromis niloticus) and other major Chinese freshwater fishes. Environmental Toxicology, 28, 137–145. doi: 10.1002/tox.20706
- Liu, J. W., Fang, G. Z., Zhang, Y., Zheng, W. J., & Wang, S. (2009). Development of a chemiluminescent enzyme-linked immunosorbent assay for five sulfonamide residues in chicken muscle and pig muscle. Journal of the Science of Food and Agriculture, 89, 80–87. doi: 10.1002/jsfa.3413
- Long, F., Shi, H. C., He, M., Sheng, J. W., & Wang, J. F. (2009). Sensitive and rapid chemiluminescence enzyme immunoassay for microcystin-LR in water samples. Analytica Chimica Acta, 649, 123–127. doi: 10.1016/j.aca.2009.07.026
- Magliulo, M., Mirasoli, M., Simoni, P., Lelli, R., Portanti, O., & Roda, A. (2005). Development and validation of an ultrasensitive chemiluminescent enzyme immunoassay for aflatoxin M1 in milk. Journal of Agricultural and Food Chemistry, 53, 3300–3305. doi: 10.1021/jf0479315
- Oplatowska, M., Donnelly, R. F., Majithiya, R. J., Glenn Kennedy, D., & Elliott, C. T. (2011). The potential for human exposure, direct and indirect, to the suspected carcinogenic triphenylmethane dye Brilliant Green from green paper towels. Food and Chemical Toxicology, 49, 1870–1876. doi: 10.1016/j.fct.2011.05.005
- Pang, G. F., Zheng, F., Fan, C. L., Li, Y., Ji, X. X., & Wang, M. L. (2008). Determination of 450 pesticides and related chemical residues in drinking water-LC-MS-MS method. Chinese national standard methods (GB/T 23214–2008). Beijing: Chinese Standard Press.
- Pourreza, N., & Elhami, S. (2007). Spectrophotometric determination of malachite green in fish farming water samples after cloud point extraction using nonionic surfactant Triton X-100. Analytica Chimica Acta, 596, 62–65. doi: 10.1016/j.aca.2007.05.042
- Schnick, R. A. (1988). The impetus to register new therapeutants for aquaculture. The Progressive Fish-Culturist, 50, 190–196. doi: 10.1577/1548-8640(1988)050%3C0190:TITRNT%3E2.3.CO;2
- Shen, Y. D., Deng, X. F., Xu, Z. L., Wang, Y., Lei, H. T., Wang, H., … Sun, Y. M. (2011). Simultaneous determination of malachite green, brilliant green and crystal violet in grass carp tissues by a broad-specificity indirect competitive enzyme-linked immunosorbent assay. Analytica Chimica Acta, 707, 148–154. doi: 10.1016/j.aca.2011.09.006
- Shen, Y. D., Wang, Y., Sun, Y. M., Lei, H. T., Wang, H., & Xiao, Z. L. (2008). Design, synthesis and identification of leuco-malachite green haptens and complete antigens. Food Science, 29, 263–266 (in Chinese).
- Singh, K. P, Gupta, S., Singh, A. K., & Sinha, S. (2011). Optimizing adsorption of crystal violet dye from water by magnetic nanocomposite using response surface modeling approach. Journal of Hazardous Materials, 186, 1462–1473. doi: 10.1016/j.jhazmat.2010.12.032
- Tao, Y. F., Chen, D. M., Chao, X. Q., Yu, H., Pan, Y. H., Liu, Z. L., … Yuan, Z. H. (2011). Simultaneous determination of malachite green, gentian violet and their leuco-metabolites in shrimp and salmon by liquid chromatography tandem mass spectrometry with accelerated solvent extraction and auto solid-phase clean-up. Food Control, 22, 1246–1252. doi: 10.1016/j.foodcont.2011.01.025
- Tsai, C. H., Chan, P. H., Lin, C. H., Chang, T. C., & Chia, C. T. (2006). A new approach for the detection of a nonfluorescent compound by CE-resonance Raman spectroscopy based on the sweeping-MEKC mode. Electrophoresis, 27, 4688–4693. doi: 10.1002/elps.200600393
- Van de Riet, J. M., Murphy, C. J., Pearce, J. N., Potter, R. A., & Burns, B. G. (2005). Determination of malachite green and leucomalachite green in a variety of aquacultured products by liquid chromatography with tandem mass spectrometry detection. Journal of AOAC International, 88, 744–749.
- Vdovenko, M. M., Gribas, A. V., Vylegzhanina, A. V., & Sakharov, I. Y. (2012). Development of a chemiluminescent enzyme immunoassay for the determination of dexamethasone in milk. Analytical Methods, 4, 2550–2554. doi: 10.1039/c2ay25278c
- Villar-Pulido, M., Gilbert-López, B., García-Reyes, J. F., Martos, N. R., & Molina-Díaz, A. (2011). Multiclass detection and quantitation of antibiotics and veterinary drugs in shrimps by fast liquid chromatography time-of-flight mass spectrometry. Talanta, 85, 1419–1427. doi: 10.1016/j.talanta.2011.06.036
- Wang, Y. K., Yan, Y. X., Ji, W. H., Wang, H. A., Zou, Q., & Sun, J. H. (2013). Novel chemiluminescence immunoassay for the determination of zearalenone in food samples using gold nanoparticles labeled with streptavidin-horseradish peroxidase. Journal of Agricultural and Food Chemistry, 61, 4250–4256. doi: 10.1021/jf400731j
- Xing, W., He, L., Yang, H., Sun, C., Li, D., & Yang, X. (2009). Development of a sensitive and group-specific polyclonal antibody-based enzyme-linked immunosorbent assay (ELISA) for detection of malachite green and leuco-malachite green in water and fish. Journal of Agricultural and Food Chemistry, 89, 2165–2173. doi: 10.1002/jsfa.3695
- Xu, Z. L., Sun, W. J., Yang, J. Y., Jiang, Y. M., Campbell, K., Shen, Y. D., … Sun, Y. M. (2012). Development of a solid-phase extraction coupling chemiluminescent enzyme immunoassay for determination of organophosphorus pesticides in environmental water samples. Journal of Agricultural and Food Chemistry, 60, 2069–2075. doi: 10.1021/jf300225b
- Yang, M. C., Fang, J. M., Kuo, T. F., Wang, D. M., Huang, Y. L., & Liu, L. Y. (2007). Production of antibodies for selective detection of malachite green and the related triphenylmethane dyes in fish and fishpond water. Journal of Agricultural and Food Chemistry, 55, 8851–8856. doi: 10.1021/jf071195y
- Yu, F. Y., Gribas, A. V., Vdovenko, M. M., & Sakharov, I. Y. (2013). Development of ultrasensitive direct chemiluminescent enzyme immunoassay for determination of aflatoxin B1 in food products. Talanta, 107, 25–29. doi: 10.1016/j.talanta.2012.12.047