
Abstract
A convenient and specific competitive enzyme-linked immunosorbent assay (ELISA) for nadifloxacin (NDF) was developed. The modified 1-ethyl-3-(3-dimethylaminopropyl) carbodiimide (EDC) method was employed to synthesise the artificial antigen of NDF. The indirect competitive ELISA developed to detect NDF has a concentration at 50% inhibition (IC50) of 0.72 ng/mL and a limit of detection of 0.04 ng/mL. This ELISA kit could be used as a screening method to detect and control the illegal content of NDF in food products. In this study, the kit was applied to NDF detection in chicken muscle and produced a satisfactory result with recovery rates from samples spiked with NDF of 92% (10 ng/mL) and 101% (50 ng/mL).
Introduction
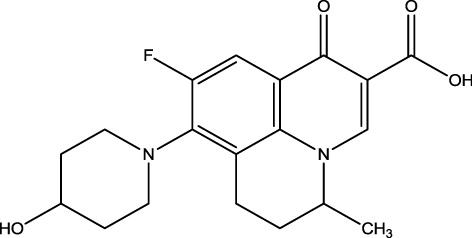
Quinolones are synthetic antimicrobial agents that widely used in variety and human medicine in special for the treatment of respiratory diseases, urinary tract infections and enteric bacterial infections. Quinolones act by inhibiting DNA gyrase in bacterial cells (Zhang, Ren, & Bao, Citation2009). Fluoroquinolones (FQ) are derived from the quinolone nalidixic acid which has a fluorine atom attached to the central ring system, a piperazine moiety at position 7 and a fluorine atom at position 6. An example is nadifloxacin (NDF; ), which is atypical of FQs that are active against aerobic gram positive, gram negative and anaerobic bacteria including Staphylococcus aureus, Propionibacterium acnes and Staphylococcus epidermidis (Kalantre & Pishwikar, Citation2012). It is a fluoroquinolone antibiotic used for the treatment of acne vulgaris (common skin disease usually starting around puberty, which mostly effects the face, the back, and the chest).
NDF exerts antibacterial action as well as acts to suppress neutrophil chemotaxis and superoxide formation. Its antibacterial effect is mediated by inhibiting the formation of supercoiled DNA by DNA gyrase (topoisomerase II), an enzyme responsible for bacterial DNA replication. It is highly active against skin isolates of P. acnes (El-Shal, Attia, & Abdulla, Citation2013; Junza et al., Citation2010; Ross et al., Citation2001). In Japan, NDF cream is widely used and has been found to have no severe adverse effects such as nephrotoxicity, hepatotoxicity, agitation, pseudomembranous colitis, inflammation or cartilage formation for methicillin-resistant S. aureus (MRSA) in young children (Kimata, Citation1999).
However, improper use of veterinary drugs is the cause of potential adverse health effects due to the risk of entering into the food chain and the appearance of residues in food products of animal origin. Moreover, excessive use of antibiotics could cause for the appearance of antimicrobial resistance mechanisms in bacteria causing human diseases which is the cause of a great concern within the health authorities and the society in general (Catry, Laevens, Devriese, Opsomer, & Kruif, Citation2003; Harrison, Citation2000). Other factors contributing to antimicrobial resistance are the localization and size of the microbial population, and the age, immunity and contact intensity of the host.
Nowadays, food supply is regulated and many governments have strictly limited the levels of these substances in foodstuffs and in raw materials used in food manufactured. To safeguard human health, the EU regulation have established safe maximum residues limits (MRLs) for residues of veterinary drugs in animal tissues entering the human food chain (Companyó, Granados, Guiteras, & Prat, Citation2009; EU Regulation No. 37/2010, Citation2010). EU regulation has set an MRL for quinolone in range 30–100 ng/mL, respectively, in milk and edible tissues (Junza, Amatya, Barrón, & Barbosa, Citation2011).
A method for the detection of NDF in drug substances and in selected dosage form by high performance liquid chromatography (HPLC) has been developed by Devhadrao (Citation2012); Jinfeng, Jialong, and Chen (Citation2006) developed a method of detecting NDF in cream by HPLC, meanwhile Kumar et al. (Citation2010) determined NDF in microemulsion and drug formulation by thin layer chromatographic. In the past decade, HPLC has been widely used for the detection of FQs in animal origin food; however, these methods are not suitable for large number of sample and is time consuming and complex. In this study, we used enzyme-linked immunosorbent assay (ELISA) method to determine NDF. ELISA has been widely used as a screening tool in environmental and agriculture to measure trace residue analysis since it needs less time and less sample preparation.
In the present study, we aimed to establish a robust ELISA to detect FQs residues in food matrix in a faster and simple procedure. Modified NDF was selected as the hapten. A sensitive monoclonal antibody (mAb) was obtained, and the resulting ELISA was tested robustness by the analysis of samples of chicken muscle.
Materials and methods
Chemicals and materials
NDF and other FQs standards were purchased from J&K scientific (Shanghai, China). Complete Freund's adjuvant (FCA), incomplete Freund's adjuvant (FIA) and enzyme immunoassay-grade horseradish peroxidase-labelled goat anti-mouse immunoglobulin were obtained from Sigma (St. Louis, MO, USA). Gelatin was obtained from Beijing Biodee Biotechnology Co., Ltd. (Beijing, China). Tetramethylbenzidine (TMB) and horseradish peroxidase (HRP) were purchased from Aladdin Chemistry Co., Ltd. (Shanghai, China). All reagents for cell fusion were gotten from Sunshine Biotechnology Co., Ltd. (Nanjing, China). Bovine serum albumin (BSA) and ovalbumin (OVA) were obtained from Solarbio Science & Technology, Co, Ltd, (Beijing, China). Other reagents and chemicals were obtained from the National Pharmaceutical Group Chemical Reagent Co., Ltd. (Shanghai, China).
Solution and buffer
Coating buffer contained 0.01 M sodium carbonate in water adjusted to pH 9.6 by pH metre. The ELISA substrate solution was prepared by mixing 2 mL of 0.06% (w/v) TMB in glycol with 10 mL of 0.1 M citrate phosphate buffer (pH 5.0) containing 1.8 µL of 30% hydrogen peroxide. The ELISA stop solution was 2 M sulphuric acid. All other buffers were prepared based on 0.01 M phosphate-buffered saline (PBS, pH 7.4) such as blocking buffer (0.2% w/v gelatin in coating buffer), washing buffer (PBS containing 0.05% v/v Tween 20, PBST) and antibody dilution buffer (PBS containing 0.1% w/v gelatin and 0.05% v/v Tween 20).
Antigen preparation
NDF was conjugated to BSA and OVA using the active ester method (Duan & Yuan, Citation2001). A mixture of 5 mg of NDF, 7.98 mg of carboxyl-reactive carbodiimide crosslinker (EDC) and 4.79 mg of N-Hydroxysuccinimide (NHS) were added to 1 mL of dimethylformamide (DMF) and incubated for 24 h in dark chamber (solution 1). OVA (16 mg) or BSA (12.58 mg) was mixed with 3 mL of 0.01M PBS (solution 2). Solution 1 was slowly added to solution 2 with stirring and the mixture was stirred continuously for 8 h at room temperature. The resulting supernatant was dialyzed against PBS for two days with four changes of PBS solution during this period to remove free NDF. The ultraviolet absorption spectrum was used to check the conjugation of protein and NDF.
Monoclonal antibody preparation
Female BALB/c mice (6–8 weeks old) were subcutaneously immunised with the NDF–KLH conjugate. FCA was used for the first immunisation and FIA was used in the subsequent boost injection. Mice were immunised every three weeks with 100 µg for the first immunisation and dose of 50 µg for the remainder. Blood samples from the immunised mice were measured by ELISA, and the mouse with the highest titre was sacrificed and its splenocytes were fused with Sp 2/0 murine myeloma cells, after which hybridomas were screened using an indirect ELISA. The selected hybridoma cells were expanded and injected into BALB/c mice to produce the monoclonal antibody (Deng et al., Citation2012). Ascites was harvested and purified using the caprylic acid–ammonium sulphate precipitation method (Kuang et al., Citation2013). The purified antibody solution was divided into small aliquots and stored at −20°C until further use.
ELISA development
NDF–OVA was used as the coating antigen and the checkerboard method was used to optimise the concentration of antigen and mAb. The microtitre plate wells were coated using carbonate buffer containing NDF–OVA at 100 µL per well. The coated plates were incubated overnight at 4°C. The plates were then washed three times with PBST and blocked with blocking buffer (250 µL per well). After 2 h incubation at 37°C, the plates were washed, and treated sample solution or standard solution was added to the wells according to experimental design (50 µL per well). Next, the mAb solution was added to each well (50 µL per well) and then the plates were incubated at 37°C for 30 min. After washing, HRP-labelled goat anti-mouse immunoglobulin diluted with antibody dilution buffer at a ratio of 1:3000 was added (100 µL/well) to the microtitre plates, and they were incubated for a further 30 min after which the plates were thoroughly washed four times. Finally, freshly prepared TMB substrate solution was added to plates (100 µL/well) and allowed to react at 37°C for 15 min in darkness. At the end of this period, 2 M sulphuric acid was used to stop the chromogenic reaction (50 µL/well). Absorbance was measured at 450 nm in a microplate reader. Effects of salt strength and pH of the assay buffer were tested to evaluate the performance of this ELISA. Assay buffer of 0.01 M PBS covered the pH range from 5.0 to 8.0 and sodium chloride (NaCl) content ranging from 0% to 3.2% (m/v) were evaluated to optimise ELISA detection.
Evaluation of ELISA
Standard calibration curves with NDF concentration between 0.03 and 24.3 ng/mL were established under optimised conditions. The limit of detection or the least detectable dose was evaluated as the concentration of NDF giving a 20% inhibition (Sun, Liu, Kuang, & Xu, Citation2013). Twelve different FQs were assessed for cross-reactivity with the mAb.
Sample detection
Chicken analysis
Negative chicken muscle samples were homogenised and aliquot of 5 g was weighed for each analysis. Extraction solvent (5 mL) consisting of a 1:1 (v/v) mixture of methanol and PBS was mixed with meat samples. After 30 s vortex, the mixture was vigorously shaken for 30 min. Then, the supernatants were obtained after centrifugation at 4100g for 10 min. Supernatant aliquot (0.5 mL) was diluted to 5 mL with assay buffer and then centrifuged at 2300g for 10 min before ELISA analysis.
Results and discussion
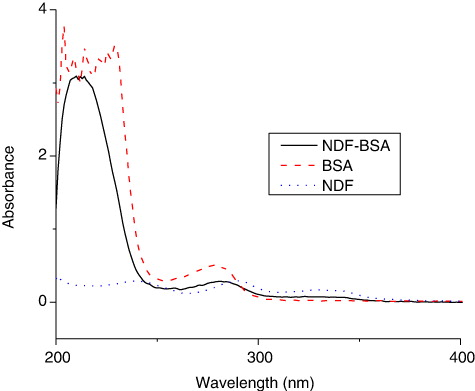
Ultraviolet absorption spectrum () showed that NDF molecule has absorbance peaks at 239, 290 and 329 nm while protein BSA has maximum absorbance at 278 nm. The conjugates of NDF–BSA were found at typical absorbance peaks of 259 and 281 nm, which represented the characteristic peaks from NDF and BSA. Hence, the conjugation between NDF and BSA was successful. NDF with molecular mass 360.379 g/mol is not able to stimulate the immune response in animals, and the conjugation with carrier protein BSA is a key step to produce activated B-cell clone. The conjugates of NDF–BSA were used as immunogen and NDF–OVA conjugates were used as coating antigen in this experiment. Five immunizations later, a mouse producing high-titre antibody was selected for cell fusion. Antibody from selected hybridoma was characterised high titre (1:16000).
Note: NDF molecule has absorbance peaks at 239, 290 and 329 nm while protein BSA has maximum absorbance at 278 nm. While, the conjugates of NDF–BSA were found typical absorbance peak at 259 and 281 nm.
According to the checkerboard results, the coating antigen concentration was 0.5 µg/mL and the mAb concentration was 0.25 µg/mL in this study. The antibody was raised against a hapten of the NDF derivatives. Hence, the maximum optical density (ODmax) and 50% inhibition rate (IC50) for NDF detection were calculated based on assay buffer of various different pH values (Zhang et al., Citation2013). The optimal condition based on ODmax and IC50 for NDF was 1.01 ng/mL at pH 7 () while the highest IC50 was at pH 5 (1.08 ng/mL). Based on the ODmax and IC50 value, the ELISA has good sensitivity to NDF in neutral buffer. To maximise sensitivity and ODmax value, subsequent tests were carried out in assay buffer of pH 7.
Table 1. Effect pH on ELISA performance. Values are expressed as mean ± standard deviation (n = 3).
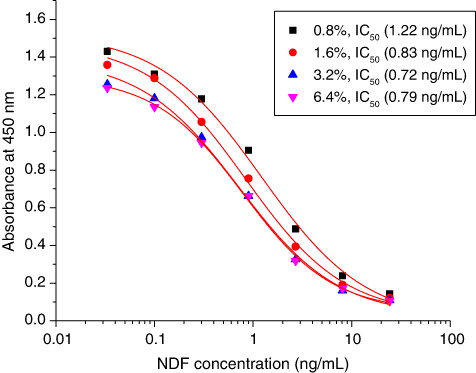
Immunoassay performance was investigated in assay buffer containing NaCl at concentrations of 0.8%, 1.6%, 3.2% and 6.4% () to evaluate the effect of ionic strength. It was observed that at higher concentration of NaCl content between 0.8% and 6.4%, the ODmax value decreased. Based on these data, the obvious of OD value at the highest test NDF concentration for all NaCl fortified groups () demonstrated that appropriate ionic strength was beneficial to reduce the non-specific binding in ELISA analysis. Based on ODmax and IC50 value, a 3.2% NaCl content in the assay buffer was selected to obtain best sensitivity.
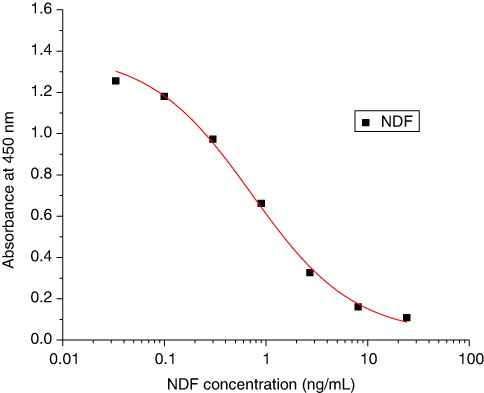
Initial considerations for the design of a hapten immunogen that would elicit production antibodies capable of cross-reacting with a range of quinolone and fluoroquinolone antimicrobials included the need to effect a link to the carrier protein at a point in the hapten distal to the 4-quinolone carboxylic acid moiety. The standard inhibition curves for NDF were established in . The IC50 values were 0.72 ± 0.203 ng/mL and the LOD values were 0.04 ng/mL. Based on the checkboard with 12 FQs (data not shown), NDF assays showed high specificity with less than 1% cross reaction with other quinolones tested.
Note: Standard curve of NDF in optimised conditions (assay buffer pH 7.0, containing 3.2% NaCl). Each point was calculated based on six repeats.
Fortified samples were detected and the results were summarised in . The recovery of NDF in chicken muscle sample at two fortified levels (10 and 50 ng/mL) was 93% and 101%. The coefficient of variation (CV) value was up to 9.89% (intra-assay) and 9.51% (inter-assay). This result indicates that the proposed ELISA has good potential in FQ analysis in the future.
Table 2. Analysis of fortified chicken muscle with NDF.
Conclusion
We describe the preparation of a specific and sensitive antibody to NDF with an IC50 of 0.721 ng/mL. The indirect competitive ELISA method developed with this antibody had an LOD value of 0.04 ng/mL and was suitable for future use as a rapid screening method for detecting FQ residues in samples. When a spike in the chicken muscle sample was tested, the ELISA standard curve for NDF was established, and the recoveries of 10 and 50 ng/mL samples were 93% and 101%, respectively, showing satisfactory results.
Additional information
Funding
References
- Catry, B., Laevens, H., Devriese, L. A., Opsomer, G., & Kruif, A. (2003). Antimicrobial resistance in livestock. Journal of Veterinary Pharmacology and Therapeutics, 26(2), 81–93. doi:10.1046/j.1365-2885.2003.00463.x
- Companyó, R., Granados, M., Guiteras, J., & Prat, M. D. (2009). Antibiotics in food: Legislation and validation of analytical methodologies. Analytical and Bioanalytical Chemistry, 395, 877–891. doi:10.1007/s00216-009-2969-4
- Deng, X., Liu, L., Ma, W., Xu, C., Wang, L., & Kuang, H. (2012). Development and validation of a sandwich ELISA for quantification of peanut agglutinin (PNA) in foods. Food and Agricultural Immunology, 23, 265–272. doi:10.1080/09540105.2011.617358
- Devhadrao, N. V. (2012). Analytical method development and validation of nadifloxacin in drug substance and selected dosage form by HPLC. Belgaum: KLE University.
- Duan, J., & Yuan, Z. (2001). Development of an indirect competitive ELISA for ciprofloxacin residues in food animal edible tissues. Journal of Agricultural and Food Chemistry, 49, 1087–1089. doi:10.1021/jf000091j
- El-Shal, M. A., Attia, A. K., & Abdulla, S. A. (2013). β-Cyclodextrin modified carbon paste electrode for the determination of gemifloxacin and nadifloxacin. Journal of Advanced Scientific Research, 4, 25–30.
- EU Regulation No. 37/2010. (2010). Official Journal of the European Union L, 15, 1–L15.
- Harrison, P. T. C. (2000). Links between environment and health: Possible future directions. Science of the Total Environment, 249(1–3), 103–105. doi:10.1016/S0048-9697(99)00514-8
- Jinfeng, Z., Jialong, M., & Chen, W. (2006). Determination of nadifloxacin cream by HPLC. China Pharmacist, 6, 11.
- Junza, A., Amatya, R., Barrón, D., & Barbosa, J. (2011). Comparative study of the LC-MS/MS and UPLC-MS/MS for the multi-residue analysis of quinolones, penicillin and cephalosporins in cow milk, and validation according to the regulation2002/657/EC. Journal of Chromatography B, 879, 2601–2610. doi:10.1016/j.jchromb.2011.07.018
- Junza, A., Amatya, R., Pérez-Burgos, R., Gokce, G., Grzelak, E., Barrón, D., & Barbosa, J. (2010). Residues of β-lactams and quinolones in tissues and milk samples. Confirmatory analysis by liquid chromatography–mass spectrometry. Ovidius University Annals of Chemistry, 21, 109–122.
- Kalantre, U. L., & Pishwikar, S. A. (2012). Development and validation of multiwavelength method for simultaneous estimation of nadifloxacin and ibuprofen in formulated hydrogel. International Journal of PharmTech Research, 4, 1575.
- Kimata, H. (1999). Effect of nadifloxacin on atopic dermatitis with methicillin-resistant Staphylococcus aureus in young children. European Journal of Pediatrics, 158, 949–949. doi:10.1007/s004310051251
- Kuang, H., Xing, C., Hao, C., Liu, L., Wang, L., & Xu, C. (2013). Rapid and highly sensitive detection of lead ions in drinking water based on a strip immunosensor. Sensors, 13, 4214–4224. doi:10.3390/s130404214
- Kumar, A., Sinha, S., Agarwal, S., Ali, J., Ahuja, A., & Baboota, S. (2010). Validated stability indicating thin layer chromatographic determination of nadifloxacin in microemulsion and bulk drug formulations. Journal of Food & Drug Analysis, 18, 358–365.
- Ross, J. I., Snelling, A. M., Eady, E. A., Cove, J. H., Cunliffe, W. J., Leyden, J. J., … Oshima, S. (2001). Phenotypic and genotypic characterization of antibiotic-resistant Propionibacterium acnes isolated from acne patients attending dermatology clinics in Europe, the USA, Japan and Australia. British Journal of Dermatology, 144, 339–346. doi:10.1046/j.1365-2133.2001.03956.x
- Sun, F., Liu, L., Kuang, H., & Xu, C. (2013). Development of ELISA for melamine detection in milk powder. Food and Agricultural Immunology, 24(1), 79–86. doi:10.1080/09540105.2011.641170
- Zhang, X., Feng, M., Liu, L., Xing, C., Kuang, H., Peng, C., … Xu, C. (2013). Detection of aflatoxins in tea samples based on a class-specific monoclonal antibody. International Journal of Food Science & Technology, 48, 1269–1274. doi:10.1111/ijfs.12086
- Zhang, H., Ren, Y., & Bao, X. (2009). Simultaneous determination of (fluoro)quinolones antibacterials residues in bovine milk using ultra performance liquid chromatography–tandem mass spectrometry. Journal of Pharmaceutical and Biomedical Analysis, 49, 367–374. doi:10.1016/j.jpba.2008.10.043