
Abstract
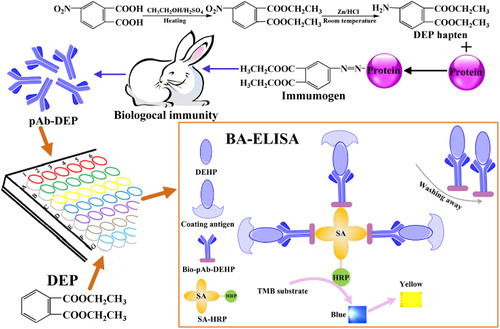
An indirect competitive biotin–streptavidin enzyme-linked immunosorbent assay (BA-ELISA) has been established for the determination of diethyl phthalate (DEP) in wine samples. A highly sensitive and specific polyclonal antibody (pAb-DEP) targeting DEP was prepared. Under optimized conditions, good linearity was achieved within a range of 0.021–9.512 μg·L−1. The limit of detection (IC10) was 0.0079 μg·L−1 and the median inhibitory concentration (IC50) was 0.443 μg·L−1. Besides, the BA-ELISA was highly selective, with low cross-reactivity values with DEP analogs (below 5%). Finally, the concentrations of DEP in wine samples ranged from 5.93 μg·L−1 to 59.15 μg·L−1 by BA-ELISA. Satisfactory recoveries (89.19–112.33%) and variation coefficient values (5.81–9.43%) were successfully obtained. The consistency between the results of BA-ELISA and gas chromatography–mass spectrometry (GC–MS) was 97.48%, which further confirmed that the proposed BA-ELISA immunoassay is reliable, rapid, sensitive, and accurate for monitoring DEP in wine samples.
Introduction
Phthalic acid diesters (PAEs) are a group of compounds that are widely used as additives and plasticizers in various commercial and personal care products to improve flexibility, long durability, and general handling properties (Schettler, Citation2009). And yet, PAEs are ubiquitous endocrine disrupting chemicals that can cause birth defects, sexual dysfunction, cancers, and possibly heart disease in living species through direct mechanisms or interaction with peroxisome proliferator-activated receptor (Diamanti-Kandarakis et al., Citation2009). Based on the above potential risks of the health and environment related to PAEs, the Council of the European Union, the US Environmental Protection Agency and many other countries' government departments make policy on regulation of PAEs (110th United States Congress, Consumer Product Safety Improvement Act [CPSIA], Citation2008; Fontelles & Clarke, Citation2005; Wu et al., Citation2012). Moreover, previous studies have shown that PAEs are widely distributed at detectable levels in foodstuff samples (Cao, Citation2010). Although the PAEs levels in wine samples have attracted much attention, little data are available on the pollution levels and the residual concentrations of these PAEs in wine samples for our study region: Shanghai, China. Hence, it is enormous important for monitoring wine samples in Shanghai, China.
As one of the PAEs family, diethyl phthalate (DEP) is an increasing widely and commonly used as plasticizer and additive, and then it is an important source of human exposition (Wang, Su, & Yang, Citation2013). So far, several analytical methods, such as gas chromatography–mass spectrometry (GC–MS; Schecter et al., Citation2013), gas chromatography-flame ionization detection (Batlle & Nerín, Citation2004), gas chromatography-low resolution-mass spectrometry with electron impact ionization (Fierens et al., Citation2012), gas chromatography-electron capture detector (Holadová, Prokůpková, Hajšlová, & Poustka, Citation2007), high performance liquid chromatography (Kataoka, Ise, & Narimatsu, Citation2002), liquid chromatography-photodiode array detector (Page & Lacroix, Citation1995), etc. were used to detect DEP in environmental samples. Although the above instrument analysis methods are accurate, the instruments are much more time-consuming, expensive, and require more skill to operate. However, the traditional ELISA is a rapid, ease-of-operation, cost-effective, and reliable screening methods for the determination of environmental contaminants in real samples, and has been developed for detecting PAEs (Wei et al., Citation2011; Zhang, Cong, Sheng, & Liu, Citation2010; Zhang, Liu, Zhuang, & Hu, Citation2012; Zhang, Yu, Wang, Hu, & Liu, Citation2013). To improve the sensitivity of ELISA, chemiluminescence immunoassay, fluorescence-enzyme immunoassay have been developed based on traditional ELISA assays for detecting PAEs (Zhang & Sheng, Citation2010; Zhang, Liu, Cong, Liu, & Hu, Citation2011; Zhang, Wang, & Zhuang, Citation2006, Citation2007). Accompanying with the above improved ELISA methods, biotin–streptavidin enzyme-linked immunosorbent assay (BA-ELISA) has been paid more attention by many scholars, because it can reduce the nonspecific reaction with reagents based on higher affinity and specificity between streptavidin and biotin (Blake & Weimer, Citation1997). Besides, BA-ELISA has eightfold higher sensitivity than the traditional ELISA using the same antibody and coating antigen (Wang, Zhang, Gao, Duan, & Wang, Citation2010), However, there are no reports of detecting DEP by BA-ELISA in the wine samples.
Therefore, in this study, a highly specific, rapid and sensitive indirect competitive BA-ELISA has been established for the determination of DEP in wine samples. First, a specific polyclonal antibody (pAb) targeting DEP was obtained based on optimal immunization primarily. Subsequently, to reduce background interference, several physiochemical factors that influence assay performance, such as optimal coupling concentration of DEP coating antigen and bio-pAb-DEP, incubation time, blocking solution, the concentration of streptavidin-HRP, organic solvent, pH of the buffer, and ionic strength were studied and optimized. Under the optimized conditions, the proposed BA-ELISA immunoassay was implemented to determine DEP in wine samples purchased from Auchan (China) Investment Co. Ltd in Shanghai, China. Finally, the BA-ELISA results about DEP in wine samples were further compared with those by GC–MS analysis.
Materials and methods
Reagents and solutions
The standard of dimethyl phthalate (DMP), DEP, dipropyl phthalate (DPrP), dibutyl phthalate (DBP), diisobutyl phthalate (DIBP), di-(2-ethyl hexyl) phthalate (DEHP), disononyl phthalate (DINP) (100.00%) were purchased from Accustandard, Inc (New Haven, Connecticut, USA). The organic materials for DEP hapten synthesis were purchased from J&K Chemical (Beijing, China). Hapten was purified through column chromatography using silica gel (40 μm average particle size) from Shanghai Sanpont Co. Ltd. (Shanghai, China). Biotinylated N-hydroxysuccinimide ester (BNHS), Freund's complete adjuvant (CFA), and Freund's incomplete adjuvant (IFA) were purchased from Sigma-Aldrich Co. LLC (St. Louis, MO, USA). Dimethyl sulfoxide (DMSO), dimethyl formamide (DMF), 25% glutaraldehyde solution, ammonium sulfate, coomassie brilliant Blue G250, Tween 20, NaHCO3, Na2CO3, KCl, NaCl, Na2HPO4, KH2PO4·12H2O, 3, 3′, 5, 5′-tetramethylbenzidine (TMB), hydrogen peroxide (H2O2), and polyethylene glycol 20,000 (PEG 20,000) were purchased from Sinopharm Chemical Reagent Co. Ltd. (Shanghai, China). Bovine serum albumin (BSA), Ovalbumin (OVA), and streptavidin-horseradish peroxidase (SA-HRP) was purchased from Sangon Co. Ltd. (Shanghai, China). All reagents were of analytical grade unless specified otherwise.
Materials and instruments
Fourier transform infrared spectrometry was performed on a Nicolet 6700 instrument (Thermo Fisher Scientific, Inc., USA). The 1H Nuclear Magnetic Resonance (NMR) Spectrometer was an Avance III 400MHz instrument (Bruker, Inc., Switzerland) with CDCl3 solution. Ultraviolet-visible (UV-vis) spectra were obtained on a DU-800 spectrophotometer (Beckman Coulter, Inc., Brea, CA). Ultra-pure water used was prepared using a Milli-Q System (18.2 kΩ; Millipore, Bedford, MA, USA). Polystyrene 96-well microtiter plates were purchased from Sango Biotech Co. Ltd (Shanghai, China). Immunoassay absorbance was measured with a Multiskan photometer in dual-wavelength mode (450–630 nm) purchased from Thermo LabSystems (Vantaa, Finland). GC–MS analysis was performed on GCMS-QP2010 gas chromatography and mass spectrometer (Shimadzu Scientific Instruments, Inc., Japan), which equipped with an HP-5MS fused silica capillary column capillary column (30 m × 0.25 mm × 0.25 μm). The column temperature program was 60°C held for 1 min, to 160°C at 6°C·min–1 held for 1 min, to 280 at 10°C·min–1 held for 1 min, and then at 10°C·min–1 to 300°C held for 6 min.
Buffers and solutions
Phosphate-buffered saline (PBS: NaCl 137 mmol·L−1, KCl 2.7 mmol·L−1, Na2HPO4 10 mmol·L−1, KH2PO4 2 mmol·L−1, pH 7.40), borate buffer (Na2B4O7 10 mmol·L−1, pH 9.16), carbonate buffer solution (CBS: Na2CO3 15 mmol·L−1, NaHCO3 34.9 mmol·L−1, pH 9.60), PBST (PBS with 0.05% Tween 20, pH 7.40).
Preparation of DEP hapten, immunogen, and coating antigen
Synthesis of DEP hapten
DEP molecules do not contain functional groups that can connect with proteins directly. Therefore, DEP hapten must be synthesized firstly as Yanaihara described (Yanaihara, Kato, Nagasawa, & Kodaira, Citation2002). The results of the hapten synthesis and characterization are given below.
Diethyl 4-aminophthalate (4-DEAP), M.w.: 237.25, m.p.: 90–92°C. IR (KBr) ν (cm−1): 3466.06, 3369.16 (-NH2 stretching vibration), 3227.98 (C-H, Ar stretching vibration), 2980.89, 2927.48 (C-H stretching vibration), 1720.18 (C=O absorption band), 1630.07, 1564.19, 1449.97 (C=C skeletal vibration), 1449.97 (d-OCH2-absorption band), 1257.81, 1068.87 (C-O-C absorption band), 833.75 (C-H, Ar plane bending vibration). 1H-NMR (CDCl3); δ 7.73 (1H, d, ArH), 6.73 (1H, d, ArH), 6.67 (1H, d, ArH), 4.36 (2H, q, -O-CH2-), 4.30 (2H, q, -O-CH2-), 4.26 (2H, q, -NH2), 1.39 (3H, t, -CH3), 1.33 (3H, t, -CH3) ppm.
Preparation of immunogen and coating antigen
As a contact portion between hapten and carrier protein, linking arm could become an antigenic determinant to determine the specificity of conjugating with antibody (Goodrow & Hammock, Citation1998). In order to reduce the specific binding caused by linking arm, different coupling methods are often used for preparing immunogen and coating antigen. In hence, the diazotization method and the glutaraldehyde method were used to couple hapten to the carrier proteins using the terminal amino group on a DEP hapten molecule in this study. UV-vis spectrophotometer was used to identify all conjugates, and then the coupling ratios were estimated based on mole absorbance ε and calculated using the following equation (Liu, Feng, Chen, & Qian, Citation2000; Monroe, Citation1984):
Preparation of biotinylated pAb-DEP (Bio-pAb-DEP)
Rabbit polyclonal anti-DEP antibodies (pAb-DEP) were prepared as follows: two male New Zealand white rabbits were immunized with BSA-DEP through subcutaneous and intramuscular injections with the immunogen. The initial immunization was performed by injecting 1mg of BSA-DEP dissolved in 0.5 mL normal saline and emulsified with 0.5 mL of CFA. Twenty days after the injections, the rabbits were boosted six times at two-week intervals by injecting a solution of 1 mg of the immunogen dissolved in 0.5 mL normal saline and emulsified with 0.5 mL of IFA. The serum titer was determined by ELISA. After antiserum titer outreached 60,000 with immunization for three months, pAb-DEP was separated and purified from rabbit serum through ammonium sulfate precipitation method, and subsequently was dialyzed against PBS for five days, freeze-dried, and stored at –20°C.
Bio-pAb-DEP was prepared as follows: 5.0 mg of pAb-DEP was dissolved in CBS at the concentration of 1.0 mg·mL−1. The above solution was mixed with 1.0 mg·mL−1 BNHS in DMSO in the mass ratio of 1:10. The mixture was stirred for four hours at room temperature and then dialyzed against PBS for three days, and was stored at –20°C.
Heterologous indirect competitive BA-ELISA
Heterologous indirect competitive ELISA, based on the immobilization of coating antigens, was performed in 96-well microplates as follows: the microplates were coated with the coating antigen in 100 μL of CBS overnight at 4°C. After three times washing (200 μL/tube of PBST), the unbound active sites were blocked with 200 μL/tube of blocking reagent, and were incubated at 37°C for 60 min. After a second washing step, the DEP standard or sample (50 μL/tube) and Bio-pAb-DEP (50 μL/tube) were added and the mixture was incubated for 60 min at 37°C. After another washing step to remove unbound Bio-pAb-DEP, SA-HRP (dilution 1:1000, 100 μL/tube) was added and the mixture was incubated for 60 min at 37°C. After an additional five times washing, 100 μL of TMB substrate solution was added. The enzymatic reaction was stopped by adding 50 μL of 2 mol·L−1 sulphuric acid after 15 min sufficient color development. The absorbance of each well was immediately recorded in dual-wavelength mode (450 nm as test and 630 nm as the reference).
The results were represented as inhibition (%). The standard curve of BA-ELISA was determined by plotting inhibition (%) against the logarithm of the standard concentration of DEP and negative control, and the linear range was used for quantification of DEP concentration in the samples. The IC50, the concentration at which a compound inhibited a particular phenomenon by 50%, was used to evaluate the sensitivity of the methods. Analogously, the limit of detection (LOD) was evaluated in terms of IC10.
Cross-reactivity (CR)
The specificity of the optimized BA-ELISA assay was evaluated by measuring CR of the Bio-pAb-DEP using a group of DEP structural analogs. The CR values were calculated as follows:
Sample preparation
All the wine samples were purchased from Auchan (China) investment Co. Ltd. in Shanghai, China. Further details of these samples were provided in the . Besides, these samples collected in this study were all popular brands that leaded by a wide margin in Shanghai market.
To avoid PAEs contamination, all glassware used in the study were immersed with acetone for at least 30 min, and then were washed with hexane three times. All the blanks, standards, spiked samples, and real samples (100 mL) were undergone similar extraction method as follows: after evaporating through the boiling water bath and cooling to room temperature, all of wine samples were dissolved in 2 mL hexane. After incubation 5 min at 28°C on a rotary shaker (250 rpm), the upper layer was removed and evaporated to dry under nitrogen. The treated sample was divided into two fractions: one reconstituted with 1 mL PBS solution with 5% DMSO (v/v) prior to analysis by BA-ELISA, and the other reconstituted with 1 mL hexane for GC–MS analysis.
Results and discussion
Characterization of immunogen, coating antigen, and antibody
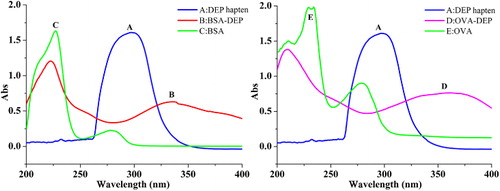
To develop a highly sensitive and specific immunoassay, the amino group of DEP was the most available for coupling with the protein. Conjugates of DEP to protein BSA were prepared via diazo coupling to form immunogen BSA-DEP. Meanwhile, the amino group was then coupled with proteins to synthesize OVA-DEP used as the coating antigen through efficient glutaraldehyde method. From the UV spectrum (), several characteristic absorption peaks of DEP hapten, protein, and conjugates appeared at 295 nm (for hapten), 227 and 278 nm (for BSA), and 234, 241, and 268 nm (for OVA). However, it was known that the diazo bond has a characteristic UV absorption peak between 300 and 350 nm (Guan et al., Citation2015). From the UV-vis absorption spectrum of BSA-DEP, in addition to the main absorbance peaks at 222 nm, BSA-DEP had a typical peak at 336 nm which was characteristic of the diazo bond. Besides, OVA-DEP showed obvious absorbance at 210 and 360 nm, and these characteristic peaks of OVA-DEP had obvious shift compared with unconjugated DEP hapten and OVA, indicating that the DEP hapten was successfully conjugated to OVA. The results revealed that the DEP hapten was conjugated into the protein successfully. Moreover, the coupling ratio was calculated using the Equation Equation(1) above. The coupling ratio was 16 for BSA-DEP and was 21 for OVA-DEP.
The immunogen BSA-DEP was injected into New Zealand White rabbits, which improved immunity for 15 weeks, with the highest antibody titer at 1:120,000. The concentration of immunogen, coating antigen, and pAb-DEP was determined by coomassie blue staining, i.e. 2.62 mg·mL−1, 1.04 mg·mL−1 and 3.60 mg·mL−1, respectively.
Optimisation of BA-ELISA
To develop a sensitive immunoassay method, several parameters were optimized. First, the concentrations of coating antigen and Bio-pAb-DEP were determined using a checkerboard assay. In this immunoassay, different blocking solutions, such as gelatin, OVA, skimmed milk powder (SMP), PEG 20,000, and polyvinyl alcohol (PVA), were dissolved in PBS and their background values were compared. Otherwise, the effects of different ionic strengths, pH in PBS buffer, concentrations of SA-HRP, incubation time, and solvent matrix effects were determined from the DEP standards and the relative antibody titers in PBS. All determinations were performed repeat eight times and the mean absorbance values were calculated. The IC50 and the maximum absorbance (Amax) were used to assess the optimum conditions for the assays (Hao et al., Citation2009).
As the primary influencing factor, the optimum concentrations for Bio-pAb-DEP and the coating antigen were used to improve the sensitivity of the immunoassay. According to checkerboard titration, the optimum reagent concentrations were those that resulted in the maximum absorbance (A0) of approximately 1.0 and the lowest antibody and coating antigen concentrations. The optimal concentrations of OVA-DEP was 8.38 μg·mL−1 and Bio-pAb-DEP was at 1:200 dilution (4.86 μg·mL−1) (see ).
Table 1. Optimal concentrations of Bio-pAb-DEP and OVA-DEP.
Given that blocking is advantageous to eliminate unoccupied sites on the tubes, so different blocking solutions, such as gelatin (0.1%, 0.5%, and 1%), 1% OVA, 1% SMP, 1% PEG20,000, 1% PVA in PBS were compared (shown in ). An optimum blocking reagent should achieve the minimal background interference, i.e. the lowest absorbance value. From , 0.5% gelatin blocking solution achieved the minimal background interference (0.073). The background values of the other blocking solutions as follows: 0.1% gelatin (0.093), 1% gelatin (0.081), 1% OVA (0.106), 1% SMP (0.132), 1% PEG20,000 (0.108), 1% PVA (0.098). Therefore, 0.5% gelatin was selected as the blocking solution in the follow-up experiments.
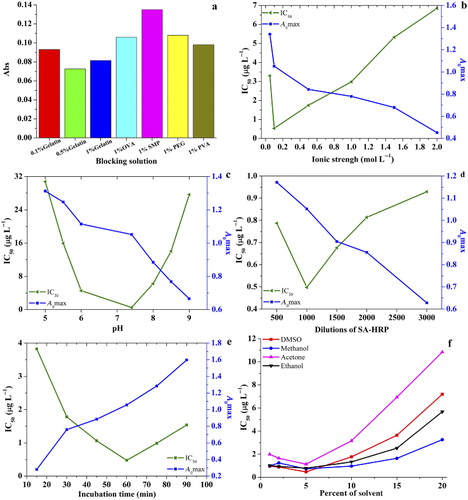
Immunoassay performance was determined under different ionic strengths (NaCl concentrations ranging from 0.05 mol·L−1 to 2.00 mol·L-1; shown in ). A0max decreased from 1.339 to 0.453 with increasing salt concentration. Salt concentrations lightly affected the sensitivity, with the IC50 ranging from 0.513 μg·L−1 to 6.846 μg·L−1. The lowest IC50 (0.513 μg·L−1) was obtained at an ionic strength of 0.10 mol·L−1. Hence, a salt concentration of 0.10 mol·L−1 was selected for the buffer in the competition assay.
The antibody–antigen binding reaction is under a dynamic balance, so this reaction is characterized by weak intermolecular bonds, and is easily affected by pH. So, the pH of optimum assay buffer was adjusted to 5.00–9.00. It was found that the pH had an insignificant effect on the sensitivity of the assay (shown in ). The A0max values decreased with increasing pH, the IC50 and A0max varied in the ranges of 0.508–30.794 μg·L−1 and 0.666–1.313 A.U., respectively. The best combination of IC50 and A0max (IC50 = 0.508 μg·L−1, A0max = 1.052), was obtained at pH 7.40. Thus, pH 7.40 was used in the competitive immunoassay.
In addition, the dilutions of SA-HRP (500, 1000, 1500, 2000, and 3000) were investigated, and then the dilution of 1000 was determined (IC50 = 0.496 μg·L−1, A0max = 1.050, shown in ). Furthermore, immunoassay performance was also determined by different incubation time (incubation times ranging from 15 to 90 min). From , we can see that although A0max value increased with incubation time increasing, the lowest IC50 (0.475 μg·L−1) was obtained at 60 min. Hence, an incubation time of 60 min was selected for the competitive reaction between antigen and antibody.
Considering that different organic solvents' concentrations make a difference in the matrix effect about resulting interference, so four water miscible organic solvents (DMSO, methanol, acetone, and ethanol) were added into immunoassay system (shown in ). These results indicated that lower amounts of organic solvent (<5%) negatively affected the performance of the assay, and the PBS solution containing 5% DMSO (v/v) which obtained the lowest IC50 value 0.452, was used to improve the analyte solubility in the future assay.
Sensitivity and stability of BA-ELISA
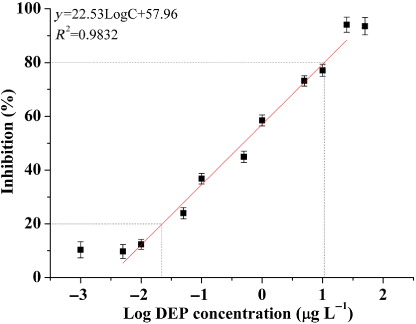
Under optimal conditions, a series of diluted concentrations of DEP standard sample (0 μg·L−1, 0.001 μg·L−1, 0.005 μg·L−1, 0.01 μg·L−1, 0.05 μg·L−1, 0.1 μg·L−1, 0.5 μg·L−1, 1 μg·L−1, 2.5 μg·L−1, 5 μg·L−1, 10 μg·L−1, 25 μg·L−1, 50 μg·L−1) were reacted using the indirect competition BA-ELISA to construct standard curve (showed in ). Correlation coefficient of DEP standard curve was 0.9832; besides, the slope and intercept were 22.53 and 57.96, respectively, i.e. Y = 22.53LogCDEP + 57.96. The linear working range, which is determined as the concentration range that causes 20–80% color inhibition (Wang et al., Citation2010), i.e. 0.021–9.512 μg·L−1. The LOD of the DEP assay, represented as IC10, i.e. 0.0079 μg·L−1; and the IC50, which is a key criterion for evaluating the sensitivity of BA-ELISA, was 0.443 μg·L−1.
Otherwise, the stability of the proposed BA-ELISA was determined by running the BA-ELISA procedures for eight individual times with seven concentrations of DEP (0.05 μg·L−1, 0.1 μg·L−1, 0.5 μg·L−1, 1 μg·L−1, 2.5 μg·L−1, 5 μg·L−1). The intra-assay repeatability was estimated after performing over 10 replicates, and inter-assay repeatability was evaluated over several weeks. And the results of variation coefficient (CV) were shown in . The intra-assay CV was <10.55% and the inter-assay CV was <12.67%, indicating the good stability and reproducibility of the proposed BA-ELISA.
Table 2. The variability of intra-assay and inter-assay test.
Specificity of BA-ELISA
The specificity of immunoassay can be generally evaluated in the ability of the antibodies to combine with only the target molecule, i.e. CR indirectly. The CR values were evaluated using some similar structure analogs about DEP, such as DMP, DPrP, DBP, DIBP, DEHP, DINP, 4-DENP, and 4-DEAP, were calculated using Equation Equation(3). The chemical structures of these analogs and the CR results were shown in . Although DEP derivatives 4-DENP and 4-DEAP showed higher CR values (i.e. 14.52% and 15.89%, respectively), 4-DENP and 4-DEAP are not present in wine samples (such as foodstuff, water and soil, etc.). In all cases, there was a low CRs (below 5%) between DEP and other structurally similar compounds, indicated that the pAb-DEP exhibited high affinity and were suitable for the specific determination of DEP at low levels.
Table 3. CR of Bio-pAb-DEP with DEP structural analogs.
Determination of DEP in wine samples and recovery tests
The proposed BA-ELISA was used to detect DEP residues in wine samples collected from Auchan (China) Investment Co. Ltd. in Shanghai, China. DEP was found in all the samples, and the concentrations ranged from 5.93 ± 0.068 μg·L−1 to 59.15 ± 0.099 μg·L−1 (. The concentrations of DEP in white liquor were much higher than beer samples. It may be caused by the migration behavior of PAEs during the longer fermentation and storage period. Besides, these samples were also tested on GC–MS to evaluate the precision of BA-ELISA: consistency (linear regression equation Y = 0.81X + 0.76, R2 = 0.9748, ) was observed between the two methods. This indicated that the BA-ELISA could offer a practical approach for screening of DEP in real samples. The p value from the paired sample t test for the comparisons of the two methods was 0.048. That is mean, at the 0.05 level, the difference was statistically significant. In a general, the BA-ELISA results were slightly higher than the GC–MS results. The difference may be caused by the nonspecific absorbance of reagents used in the method, including Bio-pAb-DEP and SA-HRP. In addition, pAb had CR for other PAEs present in the samples, which contributed to the BA-ELISA-derived concentrations.
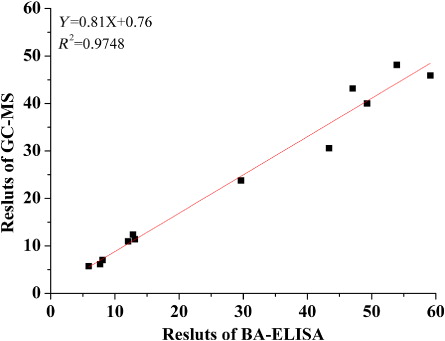
Table 4. Concentration of DEP in wine samples by BA-ELISA and GC–MS.
The recovery of the spiked samples and the CV were calculated to evaluate the accuracy and precision of BA-ELISA. Three samples (samples B1 and W1) were spiked with DEP standard concentrations ranging from 0.05 to 100 μg·L–1 before extraction. Moreover, the spiked samples were treated as described before, and then were tested six times using BA-ELISA and GC–MS for comparison. showed that the average recoveries of BA-ELISA were ranged from 89.19% to 112.33%, the CV was 5.81–9.43% (below 15%). Meanwhile, GC–MS showed recovery rates of 92.61–107.25% and CVs of 2.69–5.50%.
Table 5. Recovery of DEP detected by BA-ELISA and GC–MS in spiked wine samples.
Conclusions
This study first developed a highly sensitive and effective indirect competitive BA-ELISA for the rapid detection of DEP in wine samples on the basis of specific pAb-DEP. Several physicochemical factors that influenced the performance of proposed BA-ELISA were studied and optimized. Under optimized conditions, the IC50 value and the LOD of the assay were 0.443 μg·L–1 and 0.0079 μg·L−1, respectively. This established BA-ELISA could selectively determinate DEP against a number of structural analogs, with negligible CR below 5%. The BA-ELISA was used to detect the presence of DEP in wine samples, and satisfactory recoveries (89.19–112.33%) and CVs (5.81–9.43%) were achieved for DEP from the spiked samples. Meanwhile, compared with GC–MS, a satisfied correlation coefficient of 0.9748 was obtained by practical sample detection. These results confirmed that this method would be a useful option for the sensitive and selective detection of DEP in real wine samples.
Supplemental data
Supplemental data for this article can be accessed at http://dx.doi.org/10.1080/09540105.2015.1027666
Supplementary_Material.pdf
Download PDF (194.7 KB)Acknowledgments
We gratefully acknowledge the National Natural Science Foundation of China (Project Nos. 21177082 and 21477074), Shanghai Jiao Tong University Science, and Technology Innovation Special Fund Development Projects for their financial support.
Disclosure statement
In order to comply with the ethical requirements, all the authors of this article declare that they have no conflict of interest. We declare that the laboratory animals cared or used in the experiment were following the institutional and national guidelines. And this article does not contain any studies with humans.
References
- 110th United States Congress, Consumer Product Safety Improvement Act (CPSIA). (2008). Prohibition on sale of certain products containing specified phthalates. Retrieved from http://www.cpsc.gov/cpsia.pdf
- Batlle, R., & Nerín, C. (2004). Application of single-drop microextraction to the determination of dialkyl phthalate esters in food simulants. Journal of Chromatography A, 1045(1), 29–35. doi:10.1016/j.chroma.2004.06.001
- Blake, M. R., & Weimer, B. C. (1997). Immunomagnetic detection of Bacillus stearothermophilus spores in food and environmental samples. Applied and Environmental Microbiology, 63, 1643–1646. doi:10.0099-2240/97/$04.0010
- Cao, X. L. (2010). Phthalate esters in foods: Sources, occurrence, and analytical methods. Comprehensive Reviews in Food Science and Food Safety, 9(1), 21–43. doi:10.1111/j.1541-4337.2009.00093.x
- Diamanti-Kandarakis, E., Bourguignon, J.-P., Giudice, L. C., Hauser, R., Prins, G. S., Soto, A. M., … Gore, A. C. (2009). Endocrine-disrupting chemicals: An Endocrine Society scientific statement. Endocrine Reviews, 30, 293–342. doi:10.1210/er.2009-0002
- Fierens, T., Servaes, K., Van Holderbeke, M., Geerts, L., De Henauw, S., Sioen, I., & Vanermen, G. (2012). Analysis of phthalates in food products and packaging materials sold on the Belgian market. Food and Chemical Toxicology, 50, 2575–2583. doi:10.1016/j.fct.2012.04.029
- Fontelles, J. B., & Clarke, C. (2005). Directive 2005/84/EC of the European Parliament and of the Council of 14 December 2005 amending for the 22nd time Council Directive 76/69/EEC on the approximation of the laws, regulations and administrative provisions of the Men Der States relating to restrictions on the marketing and use of certain dangerous substances and preparations (phthalates in toys and childcare articles). Official Journal of the European Union, 48, 40–43.
- Goodrow, M. H., & Hammock, B. D. (1998). Hapten design for compound-selective antibodies: ELISAS for environmentally deleterious small molecules. Analytica Chimica Acta, 376(1), 83–91. doi:10.1016/S0003-2670(98)00433-4
- Guan, D., Guo, L., Liu, L., Kong, N., Kuang, H., & Xu, C. (2015). Development of an ELISA for nitrazepam based on a monoclonal antibody. Food and Agricultural Immunology. Advance online publication. doi:10.1080/09540105.2014.998637
- Hao, X. L., Kuang, H., Li, Y. L., Yuan, Y., Peng, C. F., Chen, W., … Xu, C. L. (2009). Development of an enzyme-linked immunosorbent assay for the α-cyano pyrethroids multiresidue in Tai lake water. Journal of Agricultural and Food Chemistry, 57, 3033–3039. doi:10.1021/jf803807b
- Holadová, K., Prokůpková, G., Hajšlová, J., & Poustka, J. (2007). Headspace solid-phase microextraction of phthalic acid esters from vegetable oil employing solvent based matrix modification. Analytica Chimica Acta, 582(1), 24–33. doi:10.1016/j.aca.2006.09.005
- Kataoka, H., Ise, M., & Narimatsu, S. (2002). Automated on-line in-tube solid-phase microextraction coupled with high performance liquid chromatography for the analysis of bisphenol A, alkylphenols, and phthalate esters in foods contacted with plastics. Journal of Separation Science, 25(1–2), 77–85. doi:10.1002/1615-9314(20020101)25:1/2<77::AID-JSSC77>3.0.CO;2-3
- Liu, S. Z., Feng, D. H., Chen, M. J., & Qian, C. F. (2000). Study on highly specific enzyme-linked immunosorbent assay for carbofuran. Chinese Journal of Analytical Science, 16, 373–378. doi:10.3969/j.issn.1006-6144.2000.05.005
- Monroe, D. (1984). Enzyme immunoasay. Analytical Chemistry, 56, 920A–931A. doi:10.1021/ac00272a719
- Page, B. D., & Lacroix, G. M. (1995). The occurrence of phthalate ester and di-2-ethylhexyl adipate plasticizers in Canadian packaging and food sampled in 1985–1989: A survey. Food Additives & Contaminants, 12, 129–151. doi:10.1080/02652039509374287
- Schecter, A., Lorber, M., Guo, Y., Wu, Q., Yun, S. H., Kannan, K., … Birnbaum, L. S. (2013). Phthalate concentrations and dietary exposure from food purchased in New York State. Environmental Health Perspectives, 121, 473–479. doi:10.1289/ehp.1206367
- Schettler, T. (2009). Human exposure to phthalates via consumer products. International Journal of Andrology, 29(1): 134–139. doi:10.1111/j.1365-2605.2005.00567.x
- Wang, L., Zhang, Y., Gao, X., Duan, Z., & Wang, S. (2010). Determination of chloramphenicol residues in milk by enzyme-linked immunosorbent assay: Improvement by biotin–streptavidin-amplified system. Journal of Agricultural and Food Chemistry, 58, 3265–3270. doi:10.1021/jf903940h
- Wang, R., Su, P., & Yang, Y. (2013). Optimization of ionic liquid-based microwave-assisted dispersive liquid–liquid microextraction for the determination of plasticizers in water by response surface methodology. Analytical Methods, 5, 1033–1039. doi:10.1039/C2AY26313K
- Wei, C., Ding, S., You, H., Zhang, Y., Wang, Y., Yang, X., & Yuan, J. (2011). An immunoassay for dibutyl phthalate based on direct hapten linkage to the polystyrene surface of microtiter plates. PloS One, 6(12), e29196. doi:10.1371/journal.pone.0029196
- Wu, M. T., Wu, C. F., Wu, J. R., Chen, B. H., Chen, E. K., Chao, M. C., … Ho, C. K. (2012). The public health threat of phthalate-tainted foodstuffs in Taiwan: The policies the government implemented and the lessons we learned. Environment International, 44, 75–79. doi:10.1016/j.envint.2012.01.014
- Yanaihara, N., Kato, I., Nagasawa, S., & Kodaira, T. (2002). U.S. Patent No. 6,399,318. Washington, DC: U.S. Patent and Trademark Office.
- Zhang, M., Cong, Y., Sheng, Y., & Liu, B. (2010). A direct competitive enzyme-linked immunosorbent assay by antibody coated for diethyl phthalate analysis. Analytical Biochemistry, 406(1), 24–28. doi:10.1016/j.ab.2010.06.040
- Zhang, M., Liu, B., Cong, Y., Liu, S., & Hu, Y. (2011). Development of highly specific fluorescence immunoassay and enzyme-linked immunosorbent assay for detection of dimethyl phthalate in water samples. Food and Agricultural Immunology, 22, 297–309. doi:10.1080/09540105.2011.575124
- Zhang, M., Liu, S., Zhuang, H., & Hu, Y. (2012). Determination of dimethyl phthalate in environment water samples by a highly sensitive indirect competitive ELISA. Applied Biochemistry and Biotechnology, 166, 436–445. doi:10.1007/s12010-011-9439-0
- Zhang, M., & Sheng, Y. (2010). An indirect competitive fluorescence immunoassay for determination of dicyclohexyl phthalate in water samples. Journal of Fluorescence, 20, 1167–1173. doi:10.1007/s10895-010-0663-8
- Zhang, M., Yu, X., Wang, Y., Hu, Y., & Liu, S. (2013). A highly sensitive indirect competitive enzyme-linked immunosorbent assay (ic-ELISA) by antigen coating for diethyl phthalate analysis in foods. Food Analytical Methods, 6, 1223–1228. doi:10.1007/s12161-012-9529-9
- Zhang, M. C., Wang, Q. E., & Zhuang, H. S. (2006). A novel competitive fluorescence immunoassay for the determination of dibutyl phthalate. Analytical and Bioanalytical Chemistry, 386, 1401–1406. doi:10.1007/s00216-006-0703-z
- Zhang, M. C., Wang, Q. E., & Zhuang, H. S. (2007). Determination of dibutyl o-phthalate by antigen-coated competitive fluorescence immunoassay. Analytical Letters, 40(1), 127–137. doi:10.1080/00032710600952564