
ABSTRACT
Tylosin (TYL) and tilmicosin (TIM) are macrolide antibiotics, and maximum residue limits (MRLs) have been set to control their illegal usage in food. We developed a sensitive indirect competitive enzyme-linked immunosorbent assay and rapid immunochromatographic strip (ICS) test to simultaneously detect TYL and TIM based on an innovative hapten (TYL-carboxymethoxylamine hemihydrochloride). The monoclonal antibody 2B3 was obtained with the isotype IgG1, and TYL and TIM had half maximal inhibitory concentrations of 0.57 and 2.10 ng/ml, respectively. The cross-reactivity values were 100%, 27.57%, 97.43%, and 62.42% for TYL, TIM, desmycosin, and acetylisovaleryl tylosin, respectively. By optimizing, the standard dilution buffer was based on 0.8% NaCl, pH 7.4 and 5% acetonitrile. The recoveries ranged from 89.37% to 112.00% in the honey samples, which suggests that the assay would be reliable in the analysis of real honey samples. In addition, an ICS was developed for qualitative, semi-quantitative, and spot detection analysis, with cut-off values of 5 and 15 ng/ml for TYL and TIM in phosphate-buffered saline, and 10 and 20 ng/ml for TYL and TIM in honey, respectively. The results show that these assays can be used to analyze real samples with the strictest MRL being 50 ng/ml for both TYL and TIM.
Introduction
Macrolide antibiotics are natural fermentative products extracted from the culture broths of certain microorganisms, and usually possess a 14-, 15-, or 16-membered lactone ring. Tylosin (TYL; ), a 16-membered lactone macrolide, is a mixture of macrolide antibiotics produced by a strain of Streptomyces fradiae, which contains TYL A, TYL B (desmycosin (DES)), TYL C, TYL D, with the main compound, TYL A, comprising no less than 80% (Roets, Beirinckx, & Quintens, Citation1993). Tilmicosin (TIM; ) is a semi-synthetic macrolide antibiotic that was produced by modification of the aldehyde group in DES (), and is a novel and effective veterinary antibiotic. TYL has a potent antimicrobial spectrum covering a wide range of Gram-positive bacteria, selected Gram-negative bacteria, pathogenic Mycoplasma, Rickettsia, and Chlamydia. Furthermore, TIM is highly effective against Pasteurella and Actinobacillus pleuropneumoniae, and is used to treat pneumonia in pigs, cattle, and poultry (Kirst, Citation1994). The antimicrobial activity of TYL and TIM is due to the interaction between the large ring macrolide and the large ribosomal subunit, which behaves like a typical inhibitor of peptidyl transferase, with the result being protein synthesis inhibition (Dinos & Kalpaxis, Citation2000). However, TYL-resistant enterococci have also been found to be resistant to erythromycin, and cross-resistance has been found to some other antibiotics important in human medicine (Gautier-Bouchardon, Reinhardt, Kobisch, & Kempf, Citation2002; Regulation, Citation1998). For the long-term interests of human health, maximum residue limits (MRLs) for TYL and TIM have been established by the Codex Alimentarius Commission, European Commission, and some authorities of other countries (Commission, Citation2009; Regulation, Citation2010). The MRLs of TYL and TIM have not been set in honey, but there is evidence that tylosin tartrate is highly effective for controlling American foulbrood in apiculture (Alippi et al., Citation1999). TYL A degrades in acidic media such as honey, yielding DES, which has a half-life of approximately 4 months at 34°C, and the DES appears to remain stable, with only a slight degradation over time (Kochansky, Citation2004). As a result, the amounts of TYL and TIM residues in honey should be paid high attention.
Figure 1. Chemical structure of TIM, DES, and ATYL.
Table 1. Chemical structure of TYL.
For the sake of consumers, it is vital to assess and control the antibiotic residues in foodstuffs. Several methods have been developed for monitoring TYL and TIM residues, such as fluorescence immunoassay (Bang-Ce, Songyang, Peng, & Xiao-Hong, Citation2008; Su et al,. Citation2011; Wei et al., Citation2013), microbiological assay (Litterio, Calvinho, Flores, Tarabla, & Boggio, Citation2007; Nouws et al., Citation1999; Pol-Hofstad, Driessen-Van Lankveld, Tomassen, De Jong, & Van Egmond, Citation2008), electrochemical enzyme-linked immunosorbent assay (ELISA) (Ammida et al., Citation2004; Draisci et al., Citation2001), thin-layer chromatography coupled to microbiological detection (Vincent Gizzi, Holst, Jong, & Michard, Citation2007), high-performance liquid chromatography (HPLC) (Clark, Dowling, & Boison, Citation2009; Prats, Francesch, Arboix, & Perez, Citation2002; Zheng et al., Citation2011), and HPLC coupled with mass spectrometry (HPLC-MS) (Juan, Moltó, Mañes, & Font, Citation2010; Nozal Nalda et al., Citation2006; Thompson, Noot, Calvert, & Pernal, Citation2003). However, most of these assays are time consuming and require expensive equipment, specialized technical personnel, and complicated sample pre-treatment and, thus, are unsuitable for extensive screening and field detection. Meanwhile, several researchers have published studies on ELISA and immunochromatographic assay for detecting TYL and TIM simultaneously, which have the advantages of low cost, high sensitivity, high throughput, and ease of operation (Le, He, Niu, Chen, & Xu, Citation2013; Zhang, Citation2013; Zhang, Liu, Wang, Chai, & Wang, Citation2012).
In the present work, the hapten was prepared with a one-step reaction using the raw material of tylosin tartrate, and a high-affinity monoclonal antibody (MAb) was generated to simultaneously recognize TYL and TIM. Both indirect competitive ELISA (ic-ELISA) and the immunochromatographic strip (ICS) method were assessed for honey sample screening.
Materials and methods
Reagents and apparatus
Tylosin tartrate (potency: ≥800 units/mg) was purchased from Aladdin Chemistry Co., Ltd. (Shanghai, China), and DES (95%) was obtained from Toronto Research Chemicals Inc. (Ontario, Canada). TIM (95%), carboxymethoxylamine hemihydrochloride (CMO, 98%), and 2-(N-morpholino) ethanesulfonic acid monohydrate (MES, 99%) were bought from J&K Scientific Ltd. (Beijing, China). Acetylisovaleryl tylosin tartrate (potency: 812 units/mg) was purchased from Hubei Widely Chemical Technology Co., Ltd. (Wuhan, China). Bovine serum albumin (BSA; MW 67,000 Da), ovalbumin (OVA; MW 45,000 Da), 1-ethyl-3-(3-dimethylaminopropyl)carbodiimide (EDC), N-hydroxysuccinimide (NHS), complete Freund's adjuvant (FCA), incomplete Freund's adjuvant (FIA), gelatin, and 3,3 ′,5,5′-tetramethylbenzidine (TMB) were obtained from Sigma Chemical Company (St. Louis, MO, USA). Enzyme immunoassay grade horseradish peroxidase-labeled goat anti-mouse immunoglobulin was supplied by Jackson ImmunoResearch Laboratories, Inc. (Shanghai, China). The reagents for cell fusion were obtained from Thermo Fisher Scientific Inc. (Shanghai, China). All other chemicals used in this research were obtained from Sinopharm Chemical Reagent Co., Ltd. (Shanghai, China), and all were of analytical or HPLC grade. The materials for preparing the ICS were obtained from JieYi Biotech. Co., Ltd. (Shanghai, China).
The Microplate reader was bought from Thermo Fisher Scientific Inc. (Beijing, China). The Cary 60 UV-Vis Spectrophotometer was obtained from Agilent Technologies Co., Ltd. (Santa Clara, CA, USA). Milli-Q Advantage A10 Water Purification System was from Merck Millipore Co., Ltd. (Darmstadt, Germany). The High-speed refrigerated centrifuge used in this research was from Heal Force Bio-Meditech Holdings Limited (Shanghai, China). XYZ Rapid test dispenser HM3035 employed to prepare the strips was supplied by Shanghai Kinbio Tech Co., Ltd. (Shanghai, China).
Buffer solutions
The basic assay buffer was phosphate-buffered saline (PBS, 0.01 M, pH 7.4). Several buffers were based on PBS, such as the washing buffer (PBS containing 0.05% v/v Tween 20 [PBST]) and antibody dilution buffer (PBST containing 0.1% w/v gelatin). The coating buffer (CBS, 0.05 M, pH 9.6) was 0.05 M carbonate buffer. The blocking buffer was made by adding 0.2% w/v gelatin to the CBS. Solution A was composed of 9.33 g citric acid, 36.8 g Na2HPO4, and 180 µl of 30% H2O2 per 1000 ml, and solution B was prepared by adding 0.06% (w/v) TMB to glycol. The substrate solution was made by mixing A with B at a ratio of 5:1 (v/v), and was used fresh at room temperature. The stop solution was 2 M sulfuric acid. And 0.1 M MES buffer was made by dissolving 1.95 g of MES in approximately 90 ml of deionized water, adjusting the pH to 6.0 with 0.5 M NaOH, and adding water to make up the solution to 100 ml.
Synthesis of haptens and conjugated antigen
From the method described by Peng et al. (Citation2012) for the synthesis of hapten, an innovative modification was devised. The tylosin tartrate was directly reacted with CMO to derive a carboxy group without the acid hydrolysis reaction, which made the synthesis procedure easier to carry out. The synthesis mechanism is shown in . The TYL (100 mg; 0.094 mmol) and 15 mg CMO (0.12 mmol) were dissolved in a 5 ml solution containing 0.02 M NaHCO3 and methanol at a ratio of 1:1 (v/v). The reaction lasted for 12 h at 60°C. The solution was poured into a bottle, and then an evaporator was used to dry the liquid at 50°C under reduced pressure. Alternatively, the solution can be dried by blowing nitrogen gas into the bottle in a 50°C waterbath. The conjugated antigens were obtained using the active ester method (Li et al., Citation2014): 4.5 mg of hapten, 1.0 mg of NHS, and 2.0 mg of EDC were dissolved in 1 ml of N,N-dimethylformamide and 0.2 ml MES buffer, which was stirred constantly for 6 h at room temperature to make the activated solution. The BSA (5 mg) or 10 mg of OVA was dissolved in 2 ml of 0.1 M carbonate buffer to make the protein solution. Then, the activated solution was added dropwise to the protein solution, with the mixture reacting overnight. Finally, the mixture was purified by dialysis against 0.01 M PBS, changing the dialysate three times a day for 3 days. Specific changes in the UV spectrum of the conjugate in comparison with the carrier spectrum or by interaction with antibodies in ELISA can be used to confirm successful coupling. Then, the immunogen or the coating antigen was stored at −20°C until further use.
Figure 2. Synthesis mechanism of TYL-CMO.
MAb preparation procedure
Female BALB/c mice (aged 6–8 weeks) were used for the immunization. The immunogen TYL-CMO-BSA (100 µg, 1 mg/ml) was emulsified in the same volume of FCA, and then injected subcutaneously at several points on the backs of the mice for the first immunization. Every fourth week, 50 µg of the immunogen was emulsified completely with FIA for the booster immunization. Seven to 10 days after the third booster immunization, 50 μl of blood was taken from the tails of the mice, and then serum separated from the blood was dissolved in antibody dilution buffer, and analyzed by ic-ELISA. After five immunizations, the mouse with the best inhibition and proper titer was chosen for cell fusion. The spleen was removed from the mouse under aseptic conditions, and the splenocytes were collected and fused with SP2/0 myeloma cells at the amount ratio of 5–10:1 using a polyethylene glycol-promoted method. The supernatants from the hybridomas were obtained for screening. Positive hybridomas with the expected inhibition were subcloned three times by the limiting dilution method to ensure its monoclonal origin. The target cell strains were expanded cultured, and the collected cells were injected intraperitoneally into BALB/c mice whose enterocoelia had been protected by liquid paraffin for at least 1 week to produce ascites (Xing, Hao, Liu, Xu, & Kuang, Citation2014). Ascites were purified using the caprylic acid and the ammonium sulfate precipitation method (Kuang et al., Citation2013). The concentration of the MAb was detected by UV–visible spectroscopy. The class and subclass isotypes of the purified MAbs were determined with a mouse MAb isotyping kit.
Procedure of indirect ELISA and ic-ELISA
The methods for the indirect ELISA and ic-ELISA were similar to those described in our previous paper (Liu, Yan, Zhang, Kuang, & Xu, Citation2015). Firstly, 96-well plates were coated with 100 μl coating antigen (TYL-CMO-OVA, 0.1 μg/ml) diluted in 0.05 M CBS (pH 9.6) for each well, and the plates were incubated for 2 h at 37°C or overnight at 4°C. The plates were washed three times with PBST, and then blocked with 200 μl blocking buffer for 2 h at 37°C or overnight at 4°C. After washing three times using PBST, the plates were dried at 37°C for 30 min for storage and further use, or followed by the addition of 50 μl of the purified antibody or antiserum diluted in antibody dilution buffer immediately, incubated at 37°C for 30 min in the case of indirect ELISA. For the ic-ELISA, 50 μl of the standard or sample extracts were added, followed by 50 μl of the MAb or antiserum. After washing three times, the plates were incubated with 100 μl peroxidase-labeled goat anti-mouse antibodies diluted in antibody dilution buffer at a dilution ratio of 1:3000 for 30 min at 37°C. One hundred microliters of substrate solution was added to each well after washing four times, and then incubated for 15 min at 37°C. Finally, 50 μl of stop solution was added to stop the reaction. The absorbance was measured at 450 nm with a Microplate reader.
Several factors that could potentially improve the sensitivity of the immunoassay were assessed, including the NaCl concentration of the assay buffer (0%, 0.4%, 0.8%, 1.6%, and 3.2%; m/m), the pH values of the assay buffer (pH 5.2, 6.2, 7.4, 8.2, and 9.6), and the acetonitrile concentration in the assay buffer (0, 5%, 10%, 20%, and 30%; v/v). The parameter Amax/IC50 was used to determine the optimal conditions, where Amax is the maximum absorbance when no standard was added, and IC50 was the concentration of the standard at the half inhibition of Amax.
Specificity and sensitivity assessment
The specificity of the MAb was assessed by cross reactivity (CR). The CR values were tested with the addition of different concentrations of structurally similar analogs, including TIM, DES, acetylisovaleryl tylosin (ATYL; ), avermectin, ivermectin, erythromycin, neomycin, kanamycin, and streptomycin. The CR values were calculated using the following formula:
The sensitivity was evaluated by the IC50, and IC20 was used as the detection limit of the assay (LOD).
Synthesis of gold nanoparticles
Colloidal gold nanoparticles were prepared according to the procedure described in our previous work using the classical sodium citrate reduction method (Kuang et al., Citation2011). All glassware were immersed in aqua regia (HCl/HNO3, v/v = 3), and then rinsed thoroughly with Milli-Q water before use. Briefly, 12.5 ml of HAuCl4·4H2O (4 g/l) was added into an erlenmeyer flask with 450 ml ultrapure water, and then stirred vigorously at 300°C for 30 min. Freshly prepared 2% (w/v) trisodium citrate solution (3.5 ml) was quickly added during the boiling and stirring state. After boiling for 2 min, the color of the solution changed from colorless to black and quickly changed to wine red, and then the mixture was boiled for an additional 20 min. After cooling to room temperature, it was stored at 4°C until further use. Colloidal gold particles were characterized by transmission electron microscopy, and a nearly uniform particle size of 25 nm was observed; UV–visible spectrometry showed a maximum absorption peak at 524 nm.
Colloidal gold-labeled MAb preparation
The colloidal gold-labeled MAb method was described in our recent work (Guo et al., Citation2015). One milliliter of colloidal gold nanoparticle solution was added to 4 µl (0.1 mol/l) K2CO3 to obtain a suitable pH 8.8. Then, 10 µg antibody (0.2 mg/ml) diluted in borate buffer (0.002 M, pH 8.2) was added dropwise with mild shaking; the reaction lasted for 2 h at room temperature. The BSA (50 μl; 10% w/v) was then added to block any unreacted positions, and reacted for another 2 h. Finally, the mixture was centrifuged at 8000 rpm for 25 min. The precipitate was washed with gold-labeled resuspension buffer twice, and then concentrated to 0.1 ml with gold-labeled resuspension buffer containing 0.02% NaN3, and 4°C for storage.
Preparation of ICS
The XYZ Rapid test dispenser was used to spray control and test lines on the nitrocellulose (NC) membrane with the goat anti-mouse IgG and coating antigen (0.06 mg/ml TYL-CMO-OVA), respectively. The NC membrane was dried in a vacuum oven at 37°C for 6 h. Ten microliters of the colloidal gold-labeled MAb was added to the conjugated pad, and was then dried at 37°C for 1 h. Afterwards, the conjugated pad, NC membrane, sample pad, and absorbent pad were glued onto a polyvinyl chloride self-adhesive backing sheet, and then assembled into a plastic cassette for further use.
Test strip assay
The principle of the assay is that if there is no TYL or TIM in the sample, the colloidal gold-labeled MAb will be captured by the coating antigen, with the test line turning red, while the excess MAb will be captured by the goat anti-mouse IgG, with the control line also turning red. Conversely, if the sample contains TYL or TIM, the colloidal gold-labeled MAb will conjugate with both the free standard and coating antigen, leading to a weaker color or the color disappearing at the test line according to the amount of standard, although the control line remains red.
Sample preparation
Honey samples, which were TYL- and TIM-free (as determined by HPLC), were used for the spiked samples. For the ELISA, 1 g of the honey sample was dissolved in 1 ml CBS and 2 ml acetonitrile, and mixed by shaking for 5 min. The mixture was then centrifuged for 10 min at 3000 rpm. The supernatant was evaporated under gentle nitrogen flow and dissolved in 2 ml PBS for analysis. The dilution ratio was two-fold. Another method is direct dilution, with a 50-fold dilution in the TYL-spiked sample and a 30-fold dilution in the TIM-spiked sample. Each analysis was repeated three times, with three replicates for each concentration.
The honey samples used in the test strip were directly diluted four-fold with PBS.
Results and discussion
Characterization of hapten and conjugated antigen
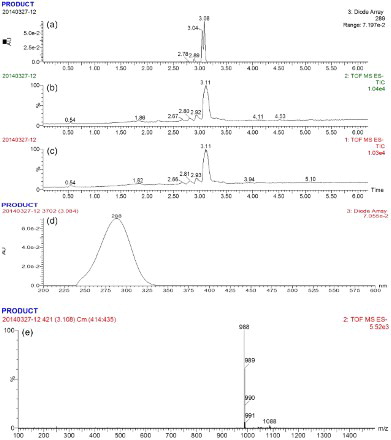
Due to its small molecular weight, TYL cannot be used directly as an antigen. In order to conjugate with the carrier protein (BSA or OVA), a hapten was derived containing the carboxylic group. The hapten was obtained by the reaction between the aldehyde groups at the C20 position of TYL and the amine of CMO under alkaline conditions. The hapten was analyzed using HPLC-MS. As shown in (a), an absorption signal peak appeared on the chromatogram at an absorbance of 289 nm at about 3.1 min. (b),(c) clearly shows a strong mass signal peak, which provides evidence that the target appeared mainly at 3.1 min. Furthermore, (d) shows that the absorbance spectrogram at 3.08 min had the same peak style as that of TYL. It can be inferred from (e) that a fragment with a molecular weight of 988 ([M+1]−) Da is the predominant fragment in the chromatogram, indicating that the synthesis of the hapten of TYL-CMO was successful.
Figure 3. HPLC-MS analysis and identification of TYL-CMO: (a)–(d) the liquid chromatogram spectrum of TYL-CMO; (e) the mass spectrum of TYL-CMO.
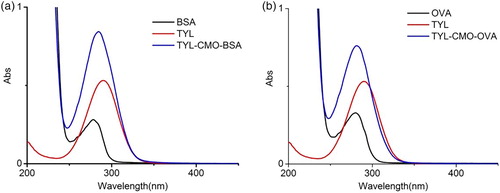
The TYL-CMO was conjugated to BSA and OVA using the active ester method, and the UV–visible absorption spectra is shown in . The hapten had a maximum absorbance peak at 289 nm, while the carrier proteins (BSA or OVA) exhibited obvious absorbance peaks at 278 nm. The conjugation resulted in a moderate rise and shift of the protein peak from 278 to 289 nm, which is due to the combined effect of the protein and TYL. These results confirm the successful conjugation of the immunogen and coating antigen.
Figure 4. The UV–visible spectroscopy of TYL, protein and conjugated antigens: (a) confirmation of immunogen (TYL-CMO-BSA); (b) confirmation of coating antigen (TYL-CMO-OVA).
Optimization of ic-ELISA
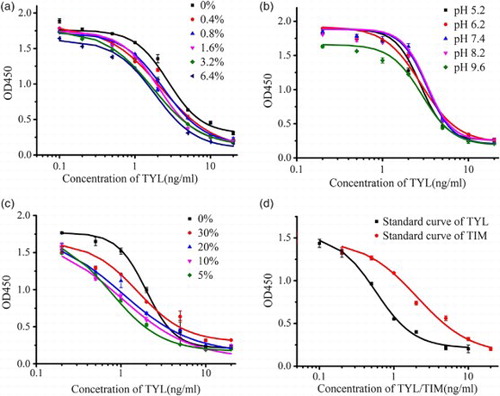
The concentrations of the coating antigen (TYL-CMO-OVA) and MAb were 0.1 and 0.0625 μg/ml, respectively. The ionic strength (NaCl content), pH value of the assay buffer, and acetonitrile concentration can change the protein conformation and influence the binding between the antigen and antibody. Therefore, these factors need to be optimized. As shown in (a), the maximum optical density (OD) value decreased quite slowly with increasing concentration of NaCl in the assay buffer. The maximum OD value was still more than 1.5 when the concentration of NaCl had been increased up to 6.4% (m/v). Therefore, a NaCl concentration of 0.8% in the assay buffer was chosen to maintain near-physiological conditions. (b) shows that at pH 9.6, the OD value was lower compared to other pH conditions. Additionally, the pH had little effect on the IC50. Thus, pH 7.4 was selected as the best pH value to maintain near-physiological conditions. (c) shows that the acetonitrile concentration had little effect on the maximum OD. However, it is worth mentioning that the IC50 was lower when acetonitrile was added, with better linearity range. Taking convenience and environmental factors into consideration, 5% acetonitrile was chosen. During the optimization process, the antibody was found to stable enough to bear various conditions, which made it easier for it to be applied in ELISA and the test strip. The IC50 value was calculated under the optimized conditions shown in (d), with TYL at 0.57 ng/ml and TIM at 2.10 ng/ml. The LODs were 0.24 and 0.65 ng/ml for TYL and TIM, respectively.
Figure 5. Optimization of standard dilution buffer for ic-ELISA: (a) NaCl content in PB; (b) pH value; (c) acetonitrile content; (d) standard curve of the TYL and TIM by optimized ic-ELISA.
As shown in , the CR values of the analogs and related compounds were determined by ic-ELISA. The antibody had the highest affinity for TYL (100%), followed by DES (97.43%), ATYL (62.42%), and TIM (27.57%); the CR values of the other compounds were less than 1%, indicating no CR. Burkin and Galvidis (Citation2012) reported that the sugar substituents mycarose and mycinose may be the key recognition epitopes for the antibody. The CR results provide evidence that mycinose is an important recognition site because the four analogs that possessed mycinose were all recognized by the MAb. The difference in CR may have been caused by steric hindrance of the 3,5-dimethylpiperidinyl at the C20 position of TIM and the substituents of isovaleryl of ATYL. The reason why DES had quite high CR was because mycarose deficiency in DES did not influence much the binding between the antibody and antigen. Some other macrolides, including avermectin, ivermectin, and erythromycin, and some aminoglycosides, including neomycin, kanamycin, and streptomycin, were also analyzed, and indicated no CR.
Table 2. CR of analogues and related compounds.
Spiked and recovery tests by ic-ELISA
Taking the sensitivity and convenience into consideration, the honey samples were spiked with standards using two different methods. One used acetonitrile for extraction, while the other was a direct dilution method. The TYL was spiked at 1, 2, and 4 ng/ml and 30, 50, and 80 ng/ml (diluted 50-fold for direct addition), while TIM was spiked at 2, 4, and 10 ng/ml, and 30, 50, 80 ng/ml (diluted 30-fold for direct addition). From , it is clear that the recovery of TYL from the honey samples ranged from 90.64% to 112.00%, while the recovery of TIM ranged from 89.37% to 105.78%. The coefficients of variation were less than 13.6%; thus, this is a reliable method for the detection of TYL and TIM residues in honey.
Table 3. Recovery determined by ic-ELISA in honey sample (n = 3).
Spiked and recovery tests using the ICS
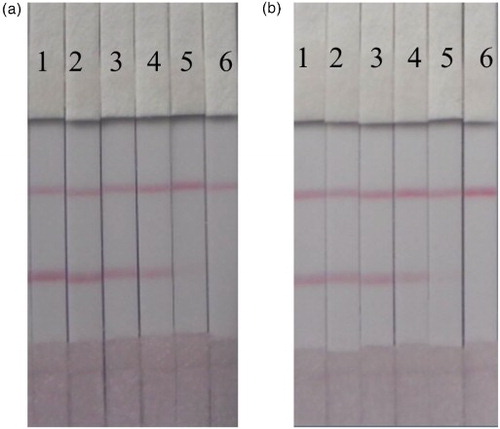
The test strip was tested in both the PBS matrix and honey samples. The honey samples were diluted four-fold prior to analysis, and were spiked with TYL and TIM at different concentrations. As shown in , the cut-off values in PBS were 5 and 15 ng/ml for TYL and TIM, respectively. shows that the cut-off values in the four-fold diluted honey sample were 2.5 and 5 ng/ml, which were then converted to actual cut-off values of 10 and 20 ng/ml for TYL and TIM, respectively. The samples can be analyzed by the ICS within 5 min, meanwhile the pre-treatment and operation are quite simple.
Figure 6. ICS result in PBS: (a) TYL (1 = 0 ng/ml, 2 = 0.5 ng/ml, 3 = 1 ng/ml, 4 = 2.5 ng/ml, 5 = 5 ng/ml, and 6 = 10 ng/ml); (b) TIM (1 = 0 ng/ml, 2 = 1 ng/ml, 3 = 2.5 ng/ml ppb, 4 = 5 ng/ml, 5 = 10 ng/ml, and 6 = 15 ng/ml).
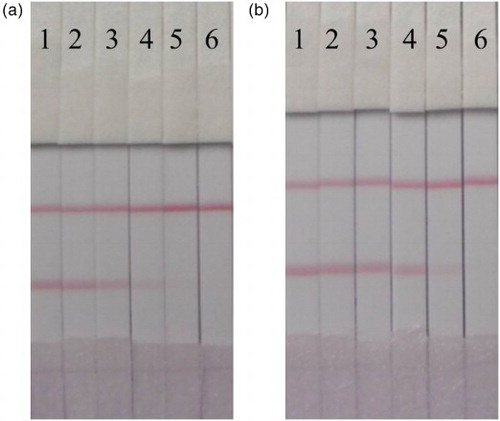
Figure 7. ICS assay result in honey sample: (a) TYL (1 = 0 ng/ml, 2 = 0.1 ng/ml, 3 = 0.25 ng/ml, 4 = 0.5 ng/ml, 5 = 1 ng/ml, and 6 = 2.5 ng/ml); (b) TIM (1 = 0 ng/ml, 2 = 0.25 ng/ml, 3 = 0.5 ng/ml, 4 = 1 ng/ml, 5 = 2.5 ng/ml, and 6 = 5 ng/ml).
Conclusion
We prepared a MAb (2B3) that can simultaneously recognize TYL and TIM based on the innovative hapten TYL-CMO, with IC50 values of 0.57 and 2.10 ng/ml, respectively. The isotype was found to be IgG1 using a mouse MAb isotyping kit. CR values were 100%, 27.57%, 97.43%, and 62.42% for TYL, TIM, DES, and ATYL, respectively. We established a method of ic-ELISA to simultaneously detect TYL and TIM in honey samples. Furthermore, the recoveries ranged from 89.37% to 112.00% in the honey samples. In addition, an ICS method was developed with cut-off values for TYL and TIM of 5 and 15 ng/ml, respectively. The test strip analysis can be completed within 5 min, and thus meets the requirements of simplicity, efficiency, on-site detection, and ease of visualization.
Disclosure statement
No potential conflict of interest was reported by the authors.
Funding
This work is financially supported by the Key Programs from MOST [2012BAD29B05, 2012BAD29B04], and grants from Natural Science Foundation of Jiangsu Province, MOF and MOE [BK20140003, 201310135].
Reference
- Alippi, A. M., Albo, G. N., Leniz, D., Rivera, I., Zanelli, M. L., & Roca, A. E. (1999). Comparative study of tylosin, erythromycin and oxytetracycline to control American foulbrood of honey bees. Journal of Apicultural Research, 38(3–4), 149–158.
- Ammida, N. H., Volpe, G., Draisci, R., Delli Quadri, F., Palleschi, L., & Palleschi, G. (2004). Analysis of erythromycin and tylosin in bovine muscle using disposable screen printed electrodes. Analyst 129(1), 15–19.
- Bang-Ce, Y., Songyang, L., Peng, Z., & Xiao-Hong, L. (2008). Simultaneous detection of sulfamethazine, streptomycin, and tylosin in milk by microplate-array based SMM-FIA. Food Chemistry, 106(2), 797–803.
- Burkin, M., & Galvidis, I. (2012). Simultaneous separate and group determination of tylosin and tilmicosin in foodstuffs using single antibody-based immunoassay. Food Chemistry, 132(2), 1080–1086.
- Clark, C. R., Dowling, P. M., & Boison, J. O. (2009). Development and validation of a method for determination of tilmicosin residues in equine plasma and tissues using hplc. Journal of Liquid Chromatography & Related Technologies, 32(19), 2839–2856.
- Commission, C. A. (2009). Compendium of methods of analysis identified as suitable to support Codex MRLs. 32nd session.
- Dinos, G. P., & Kalpaxis, D. L. (2000). Kinetic studies on the interaction between a ribosomal complex active in peptide bond formation and the macrolide antibiotics tylosin and erythromycin. Biochemistry, 39(38), 11621–11628.
- Draisci, R., Delli Quadri, F., Achene, L., Volpe, G., Palleschi, L., & Palleschi, G. (2001). A new electrochemical enzyme-linked immunosorbent assay for the screening of macrolide antibiotic residues in bovine meat. Analyst, 126(11), 1942–1946.
- Gautier-Bouchardon, A., Reinhardt, A., Kobisch, M., & Kempf, I. (2002). In vitro development of resistance to enrofloxacin, erythromycin, tylosin, tiamulin and oxytetracycline in Mycoplasma gallisepticum, Mycoplasma iowae and Mycoplasma synoviae. Veterinary Microbiology, 88(1), 47–58.
- Guo, J., Liu, L., Xue, F., Xing, C., Song, S., Kuang, H., & Xu, C. (2015). Development of a monoclonal antibody-based immunochromatographic strip for cephalexin. Food and Agricultural Immunology, 26(2), 282–292.
- Juan, C., Moltó, J. C., Mañes, J., & Font, G. (2010). Determination of macrolide and lincosamide antibiotics by pressurised liquid extraction and liquid chromatography-tandem mass spectrometry in meat and milk. Food Control, 21(12), 1703–1709.
- Kirst, H. A. (1994). Semi-synthetic derivatives of 16-membered macrolide antibiotics. Progress in Medicinal Chemistry, 31, 265–296.
- Kochansky, J. (2004). Degradation of tylosin residues in honey. Journal of Apicultural Research, 43(2), 65–68.
- Kuang, H., Chen, W., Yan, W., Xu, L., Zhu, Y., Liu, L., … Kotov, N. A. (2011). Crown ether assembly of gold nanoparticles: Melamine sensor. Biosensors and Bioelectronics, 26(5), 2032–2037.
- Kuang, H., Xing, C., Hao, C., Liu, L., Wang, L., & Xu, C. (2013). Rapid and highly sensitive detection of lead ions in drinking water based on a strip immunosensor. Sensors, 13(4), 4214–4224.
- Le, T., He, H., Niu, X., Chen, Y., & Xu, J. (2013). Development of an immunochromatographic assay for detection of tylosin and tilmicosin in muscle, liver, fish and eggs. Food and Agricultural Immunology, 24(4), 467–480.
- Li, Z., Liu, L., Song, S., Guo, S., Kuang, H., & Xu, C. (2014). Development of an enzyme-linked immunosorbent assay for octylphenol. Food and Agricultural Immunology, 25(3), 397–410.
- Litterio, N., Calvinho, L. F., Flores, M., Tarabla, H. D., & Boggio, J. C. (2007). Microbiological screening test validation for detection of tylosin excretion in milk of cows with low and high somatic cell counts. Journal of Veterinary Medicine Series A, 54(1), 30–35.
- Liu, L., Yan, H., Zhang, X., Kuang, H., & Xu, C. (2015). Development of an anti-chlorothalonil monoclonal antibody based on a novel designed hapten. Food and Agricultural Immunology, 26(3), 410–419.
- Nouws, J., van Egmond, H., Smulders, I., Loeffen, G., Schouten, J., & Stegeman, H. (1999). A microbiological assay system for assessment of raw milk exceeding EU maximum residue levels. International Dairy Journal, 9(2), 85–90.
- Nozal Nalda, M. J., Yagüe, B., Luis, J., Gómez, M., Teresa, M., Jiménez Sevilla, J. J., … Higes Pascual, M. (2006). Trace analysis of antibacterial tylosin A, B, C and D in honey by liquid chromatography-electrospray ionization-mass spectrometry. Journal of Separation Science, 29(3), 405–413.
- Peng, D., Ye, S., Wang, Y., Chen, D., Tao, Y., Huang, L., … Yuan, Z. (2012). Development and validation of an indirect competitive enzyme-linked immunosorbent assay for the screening of tylosin and tilmicosin in muscle, liver, milk, honey and eggs. Journal of Agricultural and Food Chemistry, 60(1), 44–51.
- Pol-Hofstad, I., Driessen-Van Lankveld, W., Tomassen, M., De Jong, J., & Van Egmond, H. (2008). Collaborative study of a microbiological screening method (three-plate) for the banned antimicrobial growth promotors tylosin, virginiamycin, spiramycin, zinc bacitracin and avoparcin in animal feed. Food Additives and Contaminants, 25(12), 1465–1474.
- Prats, C., Francesch, R., Arboix, M., & Perez, B. (2002). Determination of tylosin residues in different animal tissues by high performance liquid chromatography. Journal of Chromatography B, 766(1), 57–65.
- Regulation, C. (1998). No 2821/98 of 17 December 1998 amending, as regards withdrawal of the authorisation of certain antibiotics. Directive 70/524/EEC concerning additives in feedingstuffs.
- Regulation, C. (2010). No. 37/2010 of 22 December 2009 on pharmacologically active substances and their classification regarding maximum residue limits in foodstuffs of animal origin. Official Journal of the European Union, 15, 1–72.
- Roets, E., Beirinckx, P., & Quintens, I. J. H. (1993). Quantitative analysis of tylosin by column liquid chromatography. Journal of Chromatography, 630, 159–166.
- Su, P., Liu, N., Zhu, M., Ning, B., Liu, M., Yang, Z., … Gao, Z. (2011). Simultaneous detection of five antibiotics in milk by high-throughput suspension array technology. Talanta, 85(2), 1160–1165.
- Thompson, T. S., Noot, D. K., Calvert, J., & Pernal, S. F. (2003). Determination of lincomycin and tylosin residues in honey using solid-phase extraction and liquid chromatography-atmospheric pressure chemical ionization mass spectrometry. Journal of chromatography A, 1020(2), 241–250.
- Vincent, U., Gizzi, G., Holst, C. V., Jong, J. D., & Michard, J. (2007). Validation of an analytical method for the determination of spiramycin, virginiamycin and tylosin in feeding-stuffs by thin-layer chromatography and bio-autography. Food Additives and Contaminants, 24(4), 351–359.
- Wei, S., Le, T., Chen, Y., Xu, J., He, H., Niu, X., & Luo, J. (2013). Time-resolved fluoroimmunoassay for quantitative determination of tylosin and tilmicosin in edible animal tissues. Chinese Science Bulletin, 58(15), 1838–1842.
- Xing, C., Hao, C., Liu, L., Xu, C., & Kuang, H. (2014). A highly sensitive enzyme-linked immunosorbent assay for copper (II) determination in drinking water. Food and Agricultural Immunology, 25(3), 432–442.
- Zhang, J. K., Liu, J. X., Wang, L. L., Chai, L., & Wang, J. P. (2012). Production of the monoclonal antibody against tylosin for immunoassay of macrolide antibiotics in milk. Journal of Environmental Science & Health Part B, 47(9), 876–882.
- Zhang, W. (2013). Heterologous immunoassay for screening macrolide antibiotics residues in milk based on the monoclonal antibody of tylosin. Food & Agricultural Immunology, 24(4), 419–431.
- Zheng, Y., Liu, Y., Guo, H., He, L., Fang, B., & Zeng, Z. (2011). Molecularly imprinted solid-phase extraction for determination of tilmicosin in feed using high performance liquid chromatography. Analytica Chimica Acta, 690(2), 269–274.