
ABSTRACT
We examined the therapeutic effect of the extract from Sasa veitchii leaves (Sasa extract: SE) on the allergic skin inflammation model. SE derived from 0.141 g (low dose) or 0.562 g (high dose) of the leaves was administered orally for 15 days. High dose of SE suppressed ear swelling response induced by repeated 2,4-dinitrofluorobenzene (DNFB) paintings, and both low and high doses of SE reduced infiltration of immune cells into the ear dermis. Although the number of T cells, Treg, CD4+T cells and CD8+T cells in draining lymph nodes (dLNs) was not changed by SE, IFN-γ secretion from dLN induced by concanavalin A or 2,4-dinitrobenzenesulfonic acid was suppressed by a high dose of SE while IL-10 levels remained unchanged. These results suggest that SE suppresses allergic skin inflammation via reducing IFN-γ secreted from immune cells, especially T cells.
1. Introduction
Allergic contact dermatitis (ACD) is a major allergic skin inflammation with eczema and blisters, which is induced by repeated contacts with hapten such as metals (de Fine Olivarius & Menne, Citation1992; Hegewald, Uter, Pfahlberg, Geier, & Schnuch, Citation2005; Kim et al., Citation2008; Walton, Citation1983), hair dye (Redlick & DeKoven, Citation2007), and cosmetics (Orton & Wilkinson, Citation2004). ACD proceeds through two phases of immune response (Gaspari & Katz, Citation2001), called the sensitization phase and the elicitation phase. In the sensitization phase, the immune system recognizes hapten and produces hapten-specific T cells, which respond to the hapten specifically. Inflammation is not provoked during this phase; however, after sensitization, when the hapten is re-exposed to the skin, ACD is elicited at the site (Gaspari & Katz, Citation2001). In this elicitation phase, allergic response is triggered by IFN-γ, secreted from hapten-specific T cells (Xu, DiIulio, & Fairchild, Citation1996). IFN-γ induces infiltration of immune cells into the hapten-exposed site and inflammation is induced by the gathered immune cells. As it takes several hours to accumulate the immune cells, inflammation is not observed immediately after contact with hapten, but occurs 24 h–48 h later (Akiba et al., Citation2002). In this way, T cells play a key role in the etiology of ACD. Therefore, inhibiting the proliferation or IFN-γ secretion from T cells is crucial for the cure of ACD.
Currently, complete cure of ACD is difficult, and symptomatic treatments including non-steroidal anti-inflammatory drugs, moisture creams and immunosuppressants are commonly used. The former two drugs are used for relatively mild symptoms, but have no effect on hapten-specific T cells. The latter suppress cytokine production and proliferation of immune cells including T cells; however, side effects such as susceptibility and adrenalism occur occasionally. Therefore, alternative treatments with greater beneficial potential have been explored to date.
Bamboo grass is a common perennial plant consisting of several genus of Sasa that are distributed widely in Asian countries. Its roots and leaves have been used as food or medicine. Sasa leaves have been used for treating inflammation, diuresis and pyretic traditionally, and recent research papers have revealed their anti-cancer, anti-viral effects (Iwata et al., Citation2010; Ren, Reilly, & Sacchi, Citation2004; Tsunoda, Yamamoto, Sakamoto, Inoue, & Nagasawa, Citation1998). In addition, the extract from Sasa leaves seems to affect the function of immune cells. An in vitro study demonstrated that histamine release from rat peritoneal exudate cells is suppressed by the extract from Sasa leaves (Okazaki et al., Citation1999). These findings suggest that Sasa leaves have uncovered therapeutic effects including an anti-allergic effect.
In our current study, to examine whether the extract from Sasa leaves is capable of suppressing ACD, we orally administered extract from Sasa veitchii leaves (SE) to the mouse model of ACD (2,4-dinitrofluorobenzene (DNFB)-induced allergic skin inflammation model) and evaluated the extent of skin inflammation, population of T cells and cytokine secretion in draining lymph nodes (dLNs) between the vehicle and extract administrated group.
2. Material and methods
2.1. Animals
ddY mice were purchased from Chubu Kagaku Shizai Co., Ltd. (Nagoya, Japan). All animals were housed in plastic cages in an air-conditioned room at 24 ± 2°C with a relative humidity of 55 ± 10% and a 12-h light/dark cycle, fed a standard laboratory diet and given water ad libitum. These animal studies were approved by the Experimental Animal Research Committee of Kinjo Gakuin University, and were conducted in accordance with their Animal Experiment Guidelines.
2.2. Reagents
The following drugs and chemicals were purchased and used: acetone (Wako Pure Chemical Industries, Ltd., Osaka, Japan), olive oil (Wako), DNFB (Sigma-Aldrich, St. Louis, MO, USA.), 2,4-dinitrobenzenesulfonic acid sodium salt (DNBS) (Wako), Roswell Park Memorial Institute tissue culture medium 1640 (RPMI1640) (Wako), 2-mercaptoethanol (Wako), Fetal bovine serum (FBS) (Thermo Fisher Scientific Inc., Waltham MA, USA), Hank's balanced salt solution (HBSS) (Wako, mouse regulatory T cell staining kit (Treg staining kit containing anti-Mouse CD4 FITC (clone RM4–5), anti-Mouse CD25 PE (clone PC61.5) and anti-Mouse/Rat Foxp3 PE-Cy5 (clone FJK-16s)), anti-mouse CD3e PE (clone 145–2C11), FITC rat anti-mouse, PE-CD4 (clone RM4–5), and anti-mouse CD8a PE-Cy7a (clone 53–6.7) (Affymetrix Inc., CA, USA), mouse IFN-g and mouse IL-10 ELISA kits (Affymetrix Inc.).
SE was obtained from Sunchlon Co., Ltd. (Nagano, Japan) for SE sample. SE was prepared according to the following procedure as shown in : fresh leaves of Sasa veitchii were cut into small pieces and magnesium in chlorophyll of Sasa veitchii was substituted to Cu by soaking the leaves in CuSO4-containing boiled water. This substitution was the process to prevent decomposition of chlorophyll. Then, cell walls were hydrolyzed by boiling in aqueous 15% (w/v) NaOH solution for 80 min. HCl was then added to the obtained hydrolyzed resolution, which contains residue of hydrolyzed cell walls and cytoplasm component, and precipitate was formed. The precipitate was collected by centrifugation and suspended in 2 litters of water per 1 kg of paste. Twenty percent (w/v) NaOH was added until the pH was 7 (it takes about 50 mL of 20% NaOH per 1 kg of paste). Finally, this precipitate-resolved solution was diluted by distilled water to adjust the concentration of Cu-chlorophyll at 0.25% (w/v). The diluted solution (SE) contains other components including minerals, carbohydrate, fat, protein, silicic acid as shown . One milliliter of SE was made from 2.82 g of the Sasa veitchii leaves.
Figure 1. Extraction procedure.
Table 1. Components of SE.
2.3. DNFB-induced allergic skin inflammation and administration of SE
DNFB was dissolved in acetone/olive oil (4:1) and 0.2% DNFB solution was prepared. Ten microliters of 0.2% DNFB solution was applied onto the dorsal and ventral surfaces of the right and left ear lobes, respectively (total 40 μL per mouse), 3 times once a week (on Day 1, Day 8, and Day 15). The extent of skin inflammation was evaluated by measuring the ear edema (ear swelling response: ESR). Ear thickness was measured 24 h after each application of DNFB solution using a micrometer (Peacock Upright Dial Gauge, Ozaki MFG Co., Tokyo, Japan). Results are expressed as the increased ear thickness after subtracting the value obtained before the first DNFB application from each value. Mice were orally administered 0.2 mL of SE (SE group) or the same volume of distilled water (as the control group) twice a day from Day 1 to Day 15. Two different doses of SE were administered in the current study: low dose (0.05 mL SE + 0.15 mL distilled water) and high dose (0.2 mL SE). Each dose is equivalent to 0.141 g and 0.564 g of Sasa veitchii leaves.
2.4. Histopathological study of ear lesions
Twenty-four hours after the last painting of 0.2% DNFB solution, mice were euthanized by cervical dislocation under anesthesia with pentobarbital, and ears were excised to fix with 10% neutral formalin. Ear segments were cut into parasagittal slices, dehydrated and embedded in paraffin by standard procedures. Paraffin sections were stained with hematoxylin and eosin assessed by light microscopy.
2.5. Measurement of cytokine, secreted from draining lymph node cells (dLNs)
Twenty-four hours after the final painting of DNFB, mice were euthanized by cervical dislocation under anesthesia with pentobarbital and right and left cervical lymph nodes were collected as dLN and the tissue was gently dissociated in HBSS. The single-cell suspension was centrifuged and the cells were re-suspended at 2.5 × 10⁶ cells/mL in RPMI 1640 medium containing 10% heat-inactivated FBS and 5 × 10⁻⁵ M 2-mercaproethanol. Two hundred μL of this cell suspension (5.0 × 10⁵ cells) was seeded in wells of a 96-well plate and the cells were cultured in the presence of concanavalin A (5 μg/mL) or DNBS (50 μg/mL). The cells were incubated for 3 days and IFN-γ and IL-10 in culture supernatant were measured using IFN-γ and IL-10 ELISA kits.
2.6. Flow cytometry
Twenty-four hours after the final painting of DNFB, mice were euthanized by cervical dislocation under anesthesia with pentobarbital and dLN was collected and the tissue was gently dissociated in HBSS. For CD3, CD4 and CD8 staining, 100 μL of the single-cell suspension (1.0 × 10⁶ cells) was incubated with antibodies for 30 min at 4°C. After centrifugation at 4 × g for 5 min, cells were washed twice with PBS containing 10% FBS and 0.2% NaN3. Treg (CD25+CD4+foxp3+T cell, which is known as an immune regulatory subtype of T cell) staining was performed using a Treg staining kit according to the manufacturer's instructions. The cell samples were stored in the dark at 4°C until analyzed using a Becton Dickinson FACSVERSE (BD Bioscience, NJ, USA).
2.7. Statistical analysis
Results from groups of 8 mice are stated as means ± SD. Statistical significance between two groups was estimated using the two-tailed Student's t-test or Welch's t-test. To define statistically significant differences among the three groups of mice, the data were examined by Dunnett's test. P < .05 was considered statistically significant.
3. Results
3.1. Reduced DNFB-induced allergic skin inflammation by SE
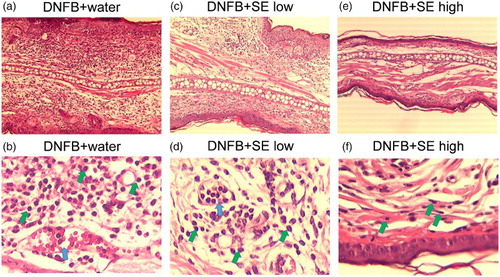
We compared the DNFB-induced ESR in the SE-administered group and the control group. Ear thickness was slightly increased 24 h after the first DNFB-painting, and the extent was increased by the number of paintings in control and low dose of SE-administered groups. High dose of SE suppressed ESR induced by second and third DNFB paintings (expressed as Day 2 and Day 3 in ), whereas low dose of SE did not reduce ESR significantly (). shows the representative sections of the DNFB-challenged ear of SE-administered mice and control mice. Neutrophils are infiltrated evidently and vascular hypermeability was observed in control mice ((a) and (b)). In contrast, these histological changes were milder in the ears of both low and high doses of SE-administered mice ((c)–(f)). This tendency was remarkable at the higher dose.
Figure 2. DNFB-induced ear swelling induced in SE-administered mice and control mice. Ear thickness was measured 24 h after each DNFB-painting. Data are means +/– SD, n = 8 **: P < .01 (H2O-administered group vs. high dose of SE-administered group), ††: P < .01 (vs. Day1 H2O-administered group), ‡: P<.01 (vs. Day 2 H2O-administered group), §: P < .05, §§: P < .01 (vs. Day 1 low dose of SE-administered group), ||: P < .05 (vs. middle dose of SE-administered group), ¶¶: P < .01 (vs. Day 1 and Day 2 high dose of SE-administered group).
Figure 3. Histological changes in the ears of DNFB-challenged mice. Each section of the ear tissues was cut from the paraffin blocks and stained with hematoxylin and eosin. (a), (b) DNFB + water, (c), (d) DNFB + low SE, (e), (f) DNFB + high SE. (a), (c), (e) and (b), (d), (f) are 10 × magnification and 100 × magnification, respectively. Green arrows and blue arrows indicate neutrophils and vascular hypermeability, respectively.
3.2. T-cell subsets of dLNs in SE-administered mice
To examine whether the anti-allergic effect of SE correlated with the number of T cells or population of their subtypes, the number of T cells in dLN was compared between control mice and high dose of SE-administered mice by flow cytometry. Representative cytograms are shown in , , and . The number of T cells (CD3 positive cells), CD4+T cells, CD8+T cells (CD3+CD4+ or CD3+CD8+ cells) and Tregs (CD4+CD25+foxp3+ cells) in dLNs was comparable in each group (). The same tendency was observed in the CD4+and CD8 T-cell subtypes and Treg per fixed number of T cells or CD4+ cells ().
Figure 4. Representative cytograms of T cell, CD4+T cell and CD8+T cells per fixed number of dLNs in DNFB-challenged mice. (a), (b), (c) DNFB + water, (d), (e), (f) DNFB + SE.
Figure 5. Representative cytograms of CD4+T cell and CD8+T cell per total T cell in DNFB-challenged mice. CD3-gated cell (T cell) as shown (a) and 4(d) was analyzed. (a), (b) DNFB + water, (c), (d) DNFB + SE.
Figure 6. Representative cytograms of Treg cell in DNFB-challenged mice. CD4-gated cell (a),(b) was analyzed. (c) DNFB + water, (d) DNFB + SE. Percentages on upper light section of (c) and (d) cytograms indicate frequency of Treg per CD4+ cell. Percentages of Tregs per dLN are calculated and shown in parentheses.
Figure 7. Percentages of T cells, CD4+T cells, CD8+T cells and Treg in dLNs derived from DNFB-challenged mice. T-cell subtype was analyzed by flow cytometry. (a) Percentage of T cell/dLNs. (b) Percentages of CD4+T cell/dLNs. (c) Percentages of CD8+T cell/dLNs. (d) Percentages of Treg/dLNs. Data are means +/– SD, n = 8.
Figure 8. Percentage of CD4+T cells, CD8+T cells and Treg per fixed number of T cells in DNFB-challenged mice. T-cell subtype was analyzed by flow cytometry. (a) Percentages of CD4+T cell/T cell. (b) Percentages of CD8+T cell/T cell. (c) Percentages of Treg/CD4+cells. Data are means +/– SD, n = 8.
3.3. Suppressive effect of SE in cytokine secretion from dLNs
Interferon-gamma and IL-10 secretion from dLNs were measured. The IFN-γ level in the supernatant of cultured dLNs stimulated with con A or DNBS was decreased by SE administration ((a)). IL-10 levels did not differ between the SE-administered group and the control group ((b)).
Figure 9. IFN-γ and IL-10 secreted from dLNs in DNFB-challenged mice. dLNs derived from each group of mice were cultured in the presence of (a) concanavalin A (ConA) and (b) DNBS and each cytokine was measured using ELISA kit. Data are means +/– SD, n = 8*: P < .01.
4. Discussion
Our current study demonstrated that a high dose of SE significantly suppressed allergic skin inflammation induced by repeated DNFB paintings. However, the percentage of total T cells, CD4+T cells and CD8+T cells in dLN was not changed significantly by SE administration ( and ), indicating that the suppression of allergic skin inflammation induced by DNFB is not due to a decrease in the number of these cells in dLN. In addition, CD8+T cells and IFN-γ producing CD4+T cells (called Th1 cells) are the main inducers of both ACD and allergic skin inflammation provoked by repeated DNFB paintings (Xiong & Bosselut, Citation2012). Their clone is known to increases in dLN by hapten exposure (Xiong & Bosselut, Citation2012). Therefore, our data also imply that administration of SE does not affect the proliferation-related factor of T cells during DNFB exposure. In addition, the immunosuppressive T-cell subset (Treg) does not seem to contribute to the suppression of DNFB-induced allergic skin inflammation because their number did not increase after SE administration ( and ).
Interferon-gamma secretion decreased in both concanavalin A-stimulated and DNBS-stimulated dLNs from SE-administered mice and is a possible mechanism in the diminishment of DNFB-induced skin inflammation by SE (). Contrary to these results, IL-10 level was comparable between the SE-administered group and the control group (). Since IL-10 is secreted from Th2 cells and Tregs (Finbloom & Winestock, Citation1995; Xu et al., Citation1996) and is involved in the suppression of allergic skin inflammation induced by DNFB (Enk, Saloga, Becker, Mohamadzadeh, & Knop, Citation1994; Niizeki & Streilein, Citation1997), SE may not affect the function of these immune cells.
Most studies, including ours, have used the extraction of the leaves, which consists of multiple components, and the bioactive or pharmacologically active substance in the leaves of Sasa including Sasa veitchii has not been clarified. One of the candidate bioactive molecules is chlorophyll, which has an anti-inflammatory effect. Subramoniam et al. have demonstrated that chemically induced paw edema in mice and rats is suppressed by a single injection of chlorophyll (0.5 mg) to the inflammatory site (Subramoniam et al., Citation2012). Although the administration route was different, we administered SE as chlorophyll 1 mg per day for 15 days, which is a far greater amount of chlorophyll than that used by Subramoniam et al. Therefore, chlorophyll in SE could contribute to the suppression of DNFB-induced allergic skin inflammation if adequate amount of chlorophyll reached the inflammatory site. Another candidate molecule is polysaccharides. Isolated-polysaccharides or polysaccharides fraction derived from plants often show anti-allergic activity (Ishihara, Oyamada, Matsushima, Murata, & Muraoka, Citation2005; Kobayashi et al. Citation2004; Maruyama, Tamauchi, Hashimoto, & Nakano, Citation2005; Yoshida, Hirano, Wada, Takahashi, & Hattori, Citation2004). In addition, other immune-reactive molecules derived from plants have been found occasionally (Chin, Hung, Yang, Wanga, & Lin, Citation2015; Dobreva, Popov, Georgieva, & Stanilova, Citation1992). Further analysis of Sasa components will assist in identifying the anti-allergic substance in Sasa veitchii.
In conclusion, our current study demonstrated that extracts from Sasa veitchii leaves significantly suppressed the DNFB-induced skin inflammation, possibly by reducing the IFN-γ secretion from immune cells including T cells. These findings also suggest that anti-allergic components exist in the leaves of Sasa veitchii.
Acknowledgements
We are grateful to Sunchlon Co., Ltd. for providing the compositional data for SE.
Disclosure statement
No potential conflict of interest was reported by the authors.
Additional information
Funding
Related Research Data
References
- Akiba, H., Kehren, J., Ducluzeau, M. T., Krasteva, M., Horand, F., Kaiserlian, D., … Nicolas, J. F. (2002). Skin inflammation during contact hypersensitivity is mediated by early recruitment of CD8+ T cytotoxic 1 cells inducing keratinocyte apoptosis. The Journal of Immunology, 168(6), 3079–3087. doi:10.4049/jimmunol.168.6.3079
- Chin, Y., Hung, C., Yang, C., Wanga, C., & Lin, Y. (2015). Immune modulation effects of soya bean fermentation food evaluated by an animal model. Food and Agricultural Immunology, 26(4), 463–476. doi:10.1080/09540105.2014.968766
- Dobreva, Z., Popov, B., Georgieva, Y., & Stanilova, S. (1992). Immunostimulatory activities of Haberlea rhodopensis leaf extract on the specific antibody response: Protective effects against γ-radiation-induced immunosuppression. Food and Agricultural Immunology, 26(3), 381–393. doi:10.1080/09540105.2014.922935
- Enk, A. H., Saloga, J., Becker, D., Mohamadzadeh, M., & Knop, J. (1994). Induction of hapten-specific tolerance by interleukin 10 in vivo. The Journal of Experimental Medicine, 179(4), 1397–1402. doi:10.1084/jem.179.4.1397
- Finbloom, D. S., & Winestock, K. D. (1995). IL-10 induces the tyrosine phosphorylation of tyk2 and Jak1 and the differential assembly of STAT1 alpha and STAT3 complexes in human T cells and monocytes. The Journal of Immunology, 155(3), 1079–1090.
- de Fine Olivarius, F., & Menne, T. (1992). Skin reactivity to metallic cobalt in patients with a positive patch test to cobalt chloride. Contact Dermatitis, 27(4), 241–243. doi:10.1111/j.1600-0536.1992.tb03253.x
- Gaspari, A. A., & Katz, S. I. (2001). Contact hypersensitivity. Current Protocols in Immunology, Chapter 4 Unit 4 2. doi:10.1002/0471142735.im0402s08
- Hegewald, J., Uter, W., Pfahlberg, A., Geier, J., & Schnuch, A. (2005). A multifactorial analysis of concurrent patch-test reactions to nickel, cobalt, and chromate. Allergy, 60(3), 372–378. doi:10.1111/j.1398-9995.2005.00693.x
- Ishihara, K., Oyamada, C., Matsushima, R., Murata, M., & Muraoka, T. (2005). Inhibitory effect of porphyran, prepared from dried Nori, on contact hypersensitivity in mice. Bioscience Biotechnology and Biochemistry, 69(10), 1824–1830. doi:10.1271/bbb.69.1824
- Iwata, K., Naito, E., Yamashita, K., Kakino, K., Taharaguchi, S., Kimachi, Y., … Takase, K. (2010). Anti pseudorabies virus activity of kumazasa extract. Biocontrol Science, 15(4), 123–128. doi.org/10.4265/bio.15.123 doi: 10.4265/bio.15.123
- Kim, Y. Y., Kim, M. Y., Park, Y. M., Kim, H. O., Koh, C. S., & Lee, H. K. (2008). Evaluating the nickel content in metal alloys and the threshold for nickel-induced allergic contact dermatitis. Journal of Korean Academy of Medicinal Sciences, 23(2), 315–319. doi:10.3346/jkms.2008.23.2.315
- Kobayashi, M., Matsushita, H., Shioya, I., Nagai, M., Tsukiyama, R., Saito, M., … Yamamoto, K. (2004). Quality of life improvement with soy sauce ingredients, Shoyu polysaccharides, in perennial allergic rhinitis: A double-blind placebo-controlled clinical study. International Journal of Molecular and Cellular Medicine, 14(5), 885–889. doi:10.3892/ijmm.14.5.885
- Maruyama, H., Tamauchi, H., Hashimoto, M., & Nakano, T. (2005). Suppression of Th2 immune responses by Mekabu fucoidan from Undaria pinnatifida Sporophylls. International Archives of Allergy and Immunology, 137(4), 289–294. doi:10.1159/000086422
- Niizeki, H., & Streilein, J. W. (1997). Hapten-specific tolerance induced by acute, low-dose ultraviolet B radiation of skin is mediated via interleukin-10. The Journal of Investigative Dermatology, 109(1), 25–30. doi:10.1111/1523-1747.ep12276415
- Okazaki, M., Tsuji, M., Yamazaki, Y., Kanda, Y., Iwai, S., & Oguchi, K. (1999). Inhibitory effects of Sasa senanensis Rehder extract (SE) on calcium-ionophore A23187-induced histamine release from rat peritoneal exudate cells. The Japanese Journal of Pharmacology, 79(4), 489–492. doi:10.1254/jjp.79.489
- Orton, D. I., & Wilkinson, J. D. (2004). Cosmetic allergy: Incidence, diagnosis, and management. American Journal of Clinical Dermatology, 5(5), 327–337. doi:10.2165/00128071-200405050-00006
- Redlick, F., & DeKoven, J. (2007). Allergic contact dermatitis to paraphenylendiamine in hair dye after sensitization from black henna tattoos: A report of 6 cases. Canadian Medical Association Journal, 176(4), 445–446. doi:10.1503/cmaj.061109
- Ren, M., Reilly, R. T., & Sacchi, N. (2004). Sasa health exerts a protective effect on Her2/NeuN mammary tumorigenesis. Anticancer Research, 24(5A), 2879–2884.
- Subramoniam, A. 1., Asha, V. V., Nair, S. A., Sasidharan, S. P., Sureshkumar, P. K., Rajendran, K. N., … Ramalingam, K. (2012). Chlorophyll revisited: Anti-inflammatory activities of chlorophyll a and inhibition of expression of TNF-α gene by the same. Inflammation, 35(3), 959–966. doi:10.1007/s10753-011-9399-0
- Tsunoda, S., Yamamoto, K., Sakamoto, S., Inoue, H., & Nagasawa, H. (1998). Effects of Sasa Health, extract of bamboo grass leaves, on spontaneous mammary tumorigenesis in SHN mice. Anticancer Research, 18(1A), 153–158.
- Walton, S. (1983). Patch testing with copper sulphate. Contact Dermatitis, 9(4), 337. doi:10.1111/j.1600-0536.1983.tb04422.x
- Xiong, Y., & Bosselut, R. (2012). CD4-CD8 differentiation in the thymus: Connecting circuits and building memories. Current Opinion in Immunology, 24(2), 139–145. doi:10.1016/j.coi.2012.02.002
- Xu, H., DiIulio, N. A., & Fairchild, R. L. (1996). T cell populations primed by hapten sensitization in contact sensitivity are distinguished by polarized patterns of cytokine production: Interferon gamma-producing (Tc1) effector CD8+ T cells and interleukin (Il) 4/Il-10-producing (Th2) negative regulatory CD4+ T cells. The Journal of Experimental Medicine, 183(3), 1001–1012. doi:10.1084/jem.183.3.1001
- Yoshida, T., Hirano, A., Wada, H., Takahashi, K., & Hattori, M. (2004). Alginic acid oligosaccharide suppresses Th2 development and IgE production by inducing IL-12 production. International Archives of Allergy and Immunology, 133(3), 239–247. doi:10.1159/000076830