
ABSTRACT
Cadmium (Cd) pollution is an environmental concern in China. Animals and humans are at risk for Cd poisoning through the consumption of Cd-contaminated rice. A fast and convenient on-site Cd detection tool is required. In this study, we developed a Quick, Easy, Cheap, Effective, Rugged and Safe method to detect Cd in rice. This immunochromatographic method is based on a Cd monoclonal antibody, which recognizes Cd-EDTA complexes. Rice Cd was extracted with 0.1 M HCl under vigorous shaking, transferred to a dispersive solid phase extraction column, and eluted with perchloric acid. Cd recovery was ∼50%. The detection range of our developed method was 0.02–0.8 mg Cd/kg rice with LOD 0.02 mg/kg. The results obtained by immunochromatography which was applied to 71 samples were compared with those obtained via inductively coupled plasma mass spectrometry; the correlation coefficient between these two methods was 0.95. Therefore, our developed method was fast and simple and can be used for on-site Cd detection.
GRAPHICAL ABSTRACT
KEYWORDS:
Introduction
Heavy metal pollution affects the yield and value of crops, the quality of the environment and the health of humans and animals (Huang, Zhou, Sun, & Zhao, Citation2008; Huang et al., Citation2015; Nota et al., Citation2008; Zhang, Gao, & Xia, Citation2014). Contaminated water and polluted plough represent the main sources of cadmium (Cd) (Guttieri, Seabourn, Liu, Baenziger, & Waters, Citation2015; Huang et al., Citation2007; Villa, Peixoto, & Cadore, Citation2014). High Cd levels in rice grain are linked to itai-itai disease, which is characterized by defects in bone formation and development (Baba et al., Citation2013).
Heavy metals tend to accumulate; therefore, they represent a long-term toxic threat to humans and animals (Castro & Sherwell, Citation2015; Hartland, Larsen, Andersen, Baalousha, & O’Carroll, Citation2015; Zhong et al., Citation2015). Long-time Cd exposure, which leads to kidney failure, poor lung function (Baba et al., Citation2013), and cardiovascular diseases (Tellezplaza et al., Citation2013), is particularly severe in smelting and mine areas (Pan et al., Citation2015). The Zhangshi irrigation area of Shengyang is a famous sewage irrigation and Cd-polluted area from 1962 with Cd levels of 1.16–6.0 mg/kg in the sewage (Zhou, Yang, Liu, Li, & Li, Citation2011). It has been reported that brown rice grown in this area contains 1.06 mg/kg Cd and that Cd levels in pig viscera are 7–10× higher than in control animals. Additionally, Cd levels are 1.06–13.26 µg/L in human sera and urine and significantly high in liver and kidney of fetuses.
Heavy metal contamination has been investigated in limnetic ecosystems of eastern China (Tang et al., Citation2014). The average Cd levels in surface sediments are 0.925 ± 0.936 mg/kg dry weight, with higher levels reported in the basins of Southeast Coastal Rivers and the Zhu River. After rapid industrialization and economic growth, elevated levels of trace elements have been detected in urban soils (Teng et al., Citation2014) and in arable areas with severe erosion (Larson, Citation2014). The government and researchers have made many investigations and focused on a remediation plan for this problem (Meharg et al., Citation2013). According to a 2010 human health risk assessment report published in China, the mean levels of As, Pb and Cd in rice samples from Hunan Province are 0.20, 0.20 and 0.28 mg/kg, respectively (Williams et al., Citation2010), which exceed the maximum permissible concentration of 0.2 mg/kg Cd in rice (GB 2762–2012). In 2014, Greenpeace reported that Cd concentrations in rice samples from Hengdong County in Hunan Province exceed the official standards. Additionally, one sample had 21× the permissible concentration of Cd. Recently, the Chinese geological survey bureau of 1999–2014 reported that heavy metal pollution in arable areas is 113.87 million mu. Rice is the main Cd source in China. Therefore, reducing Cd levels in rice constitutes an important method of minimizing Cd exposure.
In agricultural products, heavy metals are commonly analyzed via inductively coupled plasma mass spectrometry (ICP-MS) (Nardi et al., Citation2009) and flameless atomic absorption spectrophotometry (Ye, Li, Jiang, & Yan, Citation2003). However, these methods, which are time-consuming and expensive, require skilled analytical experts and complete microwave acid digestion procedures. Furthermore, both of these methods require high acid, pressure and temperature extraction conditions, which are not suitable for on-site screenings. To control the circulation of polluted rice, a simple and quick on-site Cd detection method is required.
Immunochromatography is a fast, simple, cost-effective and high-throughput method (Liu, Xing, Yan, Kuang, & Xu, Citation2014; Posthuma-Trumpie, Korf, & van Amerongen, Citation2009; Zhou, Wen, Chen, & Lu, Citation2015) that has been widely used in on-site screenings (Kuang et al., Citation2013; McNerney & Daley, Citation2011; Xing et al., Citation2015). Researchers have used immunochromatography to detect the presence of Cd in water, serum and agricultural foods (Abe et al., Citation2011; Abe, Nakamura, & Naito, Citation2014; Abe, Sakurai, Okuyama, Sasaki, & Tawarada, Citation2009; Khosraviani, Pavlov, Flowers, & Blake, Citation1998; López_Marzo, Pons, Blake, & Merkoçi, Citation2013; Sasaki et al., Citation2009). Generally, heavy metals are conjugated to a protein with a bifunctional coupling agent such as 1-(4-isothiocyanobenzyl)ethylenediamine-N,N,N’,N’-tetraacetic acid (ITCBE) (Xing, Hao et al., Citation2014; Xing, Liu et al., Citation2014; Zhu, Xu, et al., Citation2007), S-2-(4-aminobenzyl)diethylenetriamine pentaacetic acid (Zhu, Hu, et al., Citation2007), aminobenzyl-EDTA (Zhao et al., Citation2011) or p-SCN-Bn-DOTA (Jakubowski et al., Citation2008). Antibodies recognize ethylenediaminetetraacetic acid (EDTA)-Cd or other chelated forms of cadmium; the sample solution containing Cd must be pretreated by EDTA or other chelate prior to detection (Abe et al., Citation2011). In a previous study, we developed an immunochromatographic assay for the detection of Cd in drinking water (Xing, Kuang et al., Citation2014). For the detection of Cd in rice, a simple and effective pretreatment technique was necessary, due to the complexity of the food matrix. Kazuhiro Sasaki developed an immunochromatographic assay coupled to a solid phase extraction (SPE) separation to detect Cd levels in brown rice, cereals, soybeans, wheat grain, eggplant, tomato, lettuce, garden pea, Arabidopsis thaliana, soil and fertilizers (Abe et al., Citation2011; Abe et al., Citation2009; Sasaki et al., Citation2009).
In this study, we developed a portable instrument called QuEChERS (Quick, Easy, Cheap, Effective, Rugged, Safe) for Cd extraction from rice based on the dispersive SPE separation method with some modifications. The purified and concentrated sample containing Cd was detected by an immunochromatographic strip assay. About 71 real samples were applied to test the performances of the immunochromatography assay and were compared with ICP-MS very well.
Materials and methods
Materials and instruments
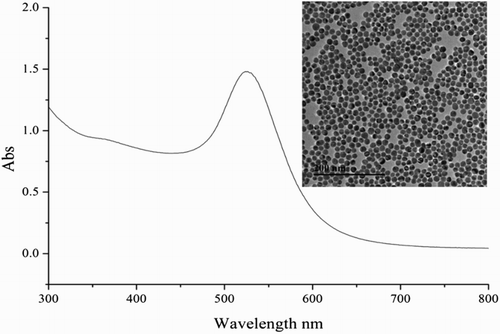
Monoclonal antibody 5H2, which recognizes Cd-EDTA complexes, was prepared from a mouse hybridoma (Xing, Kuang et al., Citation2014). The 20-nm gold nanoparticles were synthesized (Xu et al., Citation2015) and the UV and TEM picture was showed in . Bovine serum albumin (BSA), keyhole limpet hemocyanin, goat anti-mouse IgG and chloroauric acid (HAuCl4·4H2O) were purchased from Sigma-Aldrich (St. Louis, MO, USA). Cd-EDTA-protein conjugates were prepared in our laboratory. The compound ITCBE was acquired from Dojindo Laboratories (Shanghai, China).
Figure 1. UV spectrum and transmission electron microscope map (inset) of 20 nm Au solution.
Polyvinylchloride sheets, sample (glass fiber membrane, GL-b01) and absorbance pads (H5079) were purchased from JieYi Biotechnology Co., Ltd. (Shanghai, China); nitrocellulose (NC) membrane (Unisart CN140) was acquired from Sartorius Stedim Biotech GmbH. A CM4000 Guillotine Cutting Module (Shanghai Kinbio Tech Co., Ltd, China) and a Dispensing Platform (Shanghai Kinbio Tech Co., Ltd, China) were used to manufacture the test strips. ICP-MS (Thermo Fisher Scientific, Waltham, MA, USA) was used to validate the results obtained via immunochromatography. A digital test strip reader was obtained from Huaan Magnech Bio-Tech Co., Ltd.
Extraction method and dispersive-SPE cleanup
Cd extraction was performed by the method reported by Akatsuka et al. with slight modifications. Cd was extracted with diluted acid followed by a dispersive SPE separation column containing C18 coated with tricaprylmethylammonium chloride (Aliquat 336) (Abdulhalim, Whitten, & Nghiem, Citation2013). Aliquat 336 is a hydrophobic ionic solution, which has been used for the detection of Cd in seawater and crops (Abe et al., Citation2011).
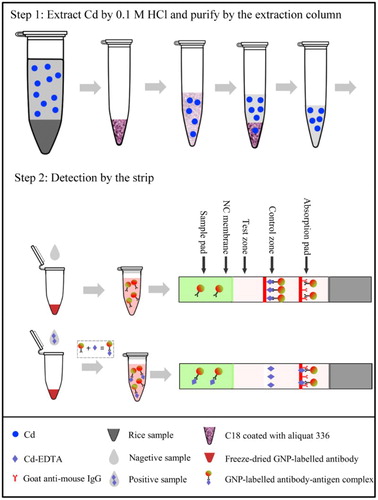
Rice samples obtained from different supermarkets in Hunan province and kindly provided by the National Center for Food Safety Risk Assessment and Huaan Magnech Bio-Tech Co., Ltd. were used. The detection steps are presented in . Rice samples (100 g) were separately milled for 60 s in a high-speed mill and sifted through a 40 mesh. For the preparation of Cd-acid extracts, 4 g rice was extracted in 20 mL of 0.1 mol/L HCl (solid-to-liquid ratio, w/v of 1:5) for 3 min under vigorous shaking in a vortex mixer at maximum speed. The Cd-acid extracts were centrifuged for 1 min at 4000 rpm, and an aliquot (8 mL) was transferred into a 15-ml centrifuge tube containing 1 g of C18 coated with aliquat 336. The mixture was shaken on a vortex mixer for 3 min to evenly distribute the C18 material and facilitate the adsorption process. During this step, Cd is selectively trapped by the sorbent, resulting in the formation of chloro complexes. Subsequently, the mixture was centrifuged for 1 min at 4000 rpm, and the supernatant was collected. The sorbent was rinsed with 8 mL of 0.1 mol/L HCl. The mixture was shaken for 20 s and centrifuged twice for 1 min at 4000 rpm. The sorbent was immersed in 4 mL of 0.5 M perchloric acid and vigorously shaken for 3 min. The mixture was centrifuged for 1 min at 4000 rpm, and the supernatant was collected. Through this process, interfering substances including Mn, Zn and Cu were removed (Abe et al., Citation2011).
Figure 2. Steps for detecting Cd in rice samples by strip.
Immunochromatographic test strip
Cd was detected using the immunochromatographic test strip. The purified solution was mixed with 0.02 M Tris buffer containing 1 µM EDTA (liquid-to-liquid ratio, v/v: 1:24). The Cd solution was neutralized and chelated with EDTA, forming Cd-EDTA complexes. Two hundred microliters of EDTA-treated solution was added to a 96-well microtiter plate, which contained freeze-dried, colloidal gold-labeled antibody. The mixture was pipetted several times until it was thoroughly re-suspended and incubated at 37°C for 5 min. During this incubation period, the antigen (Cd-EDTA) interacted with the colloidal gold-labeled anti-Cd-EDTA antibody.
Cd-EDTA-BSA and goat anti-mouse secondary antibody were dispersed as the test and control lines on the NC membrane. When the reacted sample solution passes through the sample pad and NC membrane and reached the test line, free colloidal gold-labeled antibody in the solution binds to the Cd-EDTA-BSA antigen on the line. The antigen-antibody complex passes through it. After 5 min, the test line appears red as the captured gold-labeled antibody. If the sample contains high levels of Cd, small levels of free colloidal gold-labeled antibody will be captured on the test line, resulting in a light (red) color. When little or no Cd is present in the sample solution, high levels of colloidal gold-labeled antibody will be captured by the Cd-EDTA-BSA on the test line, resulting in a deep (red) color. On the control line, uncaptured colloidal gold-labeled antibody reacts with goat anti-mouse IgG. The color intensity of the test line was recorded with a digital strip reader. Three replicates were measured for each sample.
Cd determination by immunochromatography
Calibration curves were generated by spiking Cd-negative rice (containing 0.003 mg Cd/kg) with different concentrations of Cd: 20, 50, 100, 200, 500 and 800 ng Cd/g sample. Color intensity of test line and Cd concentration had a sigmoidal relationship. A “color-concentration” calibration curve was generated by exponential fit, and a good linear relationship was observed between the color measurements and the logarithm of Cd concentration. The equation of the curve was incorporated into the digital test strip reader, which was used to read the color intensity and calculate the Cd concentrations of real rice samples.
Cd determination by ICP-MS
To validate the accuracy of the immunochromatographic assay, Cd concentrations in rice samples were measured by ICP-MS following microwave digestion with concentrated HNO3. Additionally, the Cd concentrations in the extracted solutions, dispersive-SPE cleanup solutions and the eluted solution were measured by graphite furnace atomic absorption spectrometry.
Results and discussion
Extraction and purification
Rice Cd can be successfully extracted with HCl. At 1 mol/L HCl, almost all soybean Cd was extracted. In several cases, average recoveries of Cd were ∼100% with 0.1 mol/L HCl at solid-to-liquid ratios (w/v) of 1/20 to 1/10. However, the extraction time was long (1 h) (Sasaki et al., Citation2009). Using 0.1 M HCl, we extracted Cd from milled rice within 3 min. As shown in , Cd extraction time was investigated. Based on the results, 3 min was sufficient to extract Cd from milled rice.
Table 1. Time optimization of extraction Cd from rice.
The absorption ability of an extraction column to capture Cd from the acid extract was evaluated. Cd-containing rice samples (3.0–827.8 ng Cd/g) were extracted with 0.1 M HCl for 3 min and transferred to an extraction column for 3 min. The sorbent was cleaned twice with 8 mL of 0.1 mol/L HCl. The eluate obtained after the extraction and clean-up steps were collected and analyzed for Cd levels. More than 96.2% Cd in the acid extract was absorbed by the modified C18 column and could not be eluted by 0.1 M HCl as showed in . Cd was eluted from the modified C18 column using 4 mL of 0.5 M perchloric acid. Rice samples containing high Cd levels (827.8 ng/g) were used to evaluate the elution efficiency of different acids. Compared to 0.5 M perchloric acid, diluted perchloric acid (<0.2 M), static extraction and nitric acid were less efficient at eluting Cd and contributed to turbid eluates.
Table 2. Dilute acid extraction cadmium from rice and extraction by SPE column.
Compared with the results of Kaoru Abe (Abe et al., Citation2011), elution efficiency was ∼50% when perchloric acid concentration increased from 0.2 to 0.5 M (). In our condition, the C18 column formed small spherical aggregates under vigorous shaking within 3 min, which may affect the extraction efficiency. Even though the extraction efficiency was ∼50%, the eluate volume was 4 mL, and the final Cd concentration was the similar as in the acid extract. As shown in , nine rice samples with 3.0–827.8 ng/g Cd had similar final extraction efficiency (∼50%) except for the negative rice samples containing low Cd levels (3.0 ng/g).
Table 3. Optimization of elution method.
Table 4. The elution of Cd from SPE column.
Cd determination by immunochromatography
Prior to immunochromatography, the eluate must be neutralized and chelated. Therefore, the eluate was diluted 24-fold with 0.02 M Tris containing 1 µM EDTA. Two hundred microliters of the EDTA-treated solution was allowed to react with freeze-dried, colloidal gold-labeled antibody in a 96-well microtiter plate for 5 min. Subsequently, the strip was added to the well for color development. The color intensity of test line was recorded with a digital test strip reader after 5 min.
In order to quantitative detection the Cd concentration in rice. A standard curve using Cd-spiked rice samples (20–800 ng/g) was generated. Cd was extracted, purified and analyzed via immunochromatography. The acid extraction efficiency, extraction efficiency by extraction column, elution efficiency and final extraction efficiency were similar to those of real rice samples ().
Table 5. The pretreatment of spiked rice samples.
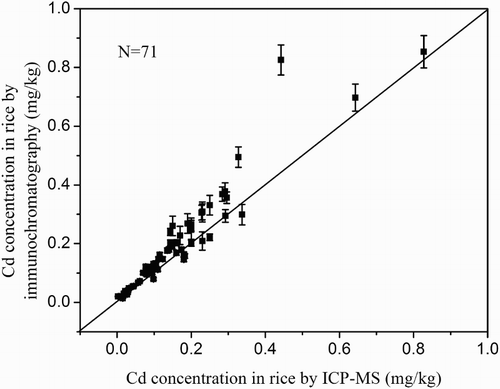
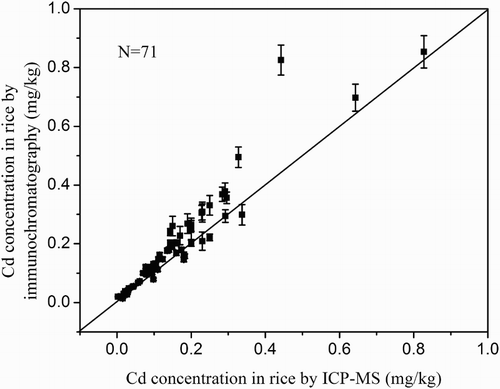
Based on the visual inspection, the color intensity of test line of 0.1 mg/kg Cd spiked rice samples detection result was obviously lighter than that of negative sample. By using the digital test strip reader, the color intensity of the test line was recorded; a good sigmoidal relationship was observed by an exponential fit between the logarithm of Cd concentration and the color intensity of the test line. As showed in , the detection range of immunochromatography was from 0.02 to 0.8 mg/kg. The calibration curve was incorporated into the digital test strip reader, which was used to estimate the Cd concentration in different rice samples. In order to verify the practicability of the developed method, real rice samples (n = 71) containing different Cd levels were detected by this immunochromatography assay and compared with that by ICP-MS. The detection results were showed in –.
Figure 3. The detection results of Cd in rice by immunochromatography (a) and the standard curve (b).
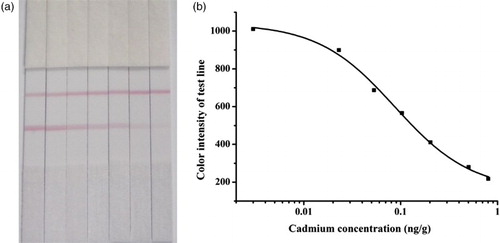
Table 6. Real rice samples kindly provided by the National Center for Food Safety Risk Assessment were detected by the immunochromatography assay and ICP-MS and the data unit is mg/kg.
Table 7. Real rice samples obtained from different supermarkets in Hunan province were detected by the immunochromatography assay and ICP-MS and the data unit is mg/kg.
Table 8. Real rice samples kindly provided by Huaan Magnech Bio-Tech Co., Ltd. were detected by the immunochromatography assay and ICP-MS and the data unit is mg/kg.
The correlation coefficient between these two methods was 0.95 () and the average coefficient of variation was 7.9% for rice. The established method could successfully determine Cd in rice at concentrations >0.02 mg/kg. Based on the results, 5 out of 23 rice samples randomly purchased in local supermarkets of Hunan Province exceeded the permissible Cd level (0.2 mg/kg); one sample had very high Cd contamination levels (0.827 mg/kg). The detecting results indicating there were considerable risk at consuming Cd polluted rice and leading chronic intoxication.
Figure 4. The detection results of Cd in rice by immunochromatography and ICP-MS. Error bars represent SD (n = 3).
In summary, we developed a fast and simple method for Cd detection in rice. No concentrated acid and high temperature and pressure needed. The process could be accomplished in 30 min, and no expensive instruments were required. This method was easy and effective for cadmium purification by vibration and centrifugation. Our developed method is an effective tool for Cd on-site monitoring and detection. To reduce the health risks from rice Cd for residents in China, Cd concentration in rice should be detected before consumption, especially in heavy metal contaminated regions.
Disclosure statement
No potential conflict of interest was reported by the authors.
Notes on contributors
Liguang Xu earned his Ph.D. in food science in 2012 from Jiangnan University, Wuxi, China and then became a faculty in college of Food science and technology of Jiangnan University. His research is focused on the synthesis and controllable assembly of nanoparticles, especially noble metal nanoparticles.
Changrui Xing got his Ph.D. in food science in 2015 from Jiangnan University, Wuxi, China. His research interest includes immunoassay development for food safety.
Liqiang Liu earned his Ph.D. in food science in 2014 from Jiangnan University, Wuxi, China and then became a faculty in college of Food science and technology of Jiangnan University. His research interests include immunochromatographic strip design and application.
Shanshan Song received her Master's degree in food science in 2012 from Jiangnan University, Wuxi, China, and then became a research assistant in college of Food science and Technology of Jiangnan University. Her research interests are monoclonal antibody development.
Hua Kuang obtained her Ph.D. from China Agricultural University in 2009 and then began to work as a faculty in college of Food Science and Technology of Jiangnan University. She is currently a full professor in food safety. Her research interests are biosensor development.
Chuanlai Xu is a full professor of Food Science and Technology of Jiangnan University. He earned his Ph.D. in Food Science in 2002. His research interests are fast detection technology and food safety evaluation.
Additional information
Funding
References
- Abdulhalim, N., Whitten, P., & Nghiem, L. (2013). Characterising poly (vinyl chloride)/Aliquat 336 polymer inclusion membranes: Evidence of phase separation and its role in metal extraction. Separation and Purification Technology, 119, 14–18. doi: 10.1016/j.seppur.2013.08.038
- Abe, K., Nakamura, K., Arao, T., Sakurai, Y., Nakano, A., Suginuma, C., … Sasaki, K. (2011). Immunochromatography for the rapid determination of cadmium concentrations in wheat grain and eggplant. Journal of the Science of Food and Agriculture, 91, 1392–1397. doi: 10.1002/jsfa.4321
- Abe, K., Nakamura, K., & Naito, S. (2014). Interlaboratory study of immunochromatography for the rapid determination of cadmium concentrations in cereals and soybeans. Journal of AOAC International, 97, 913–920. doi: 10.5740/jaoacint.12-319
- Abe, K., Sakurai, Y., Okuyama, A., Sasaki, K., & Tawarada, K. (2009). Simplified method for determining cadmium concentrations in rice foliage and soil by using a biosensor kit with immunochromatography. Journal of the Science of Food and Agriculture, 89, 1097–1100. doi: 10.1002/jsfa.3541
- Baba, H., Tsuneyama, K., Yazaki, M., Nagata, K., Minamisaka, T., Tsuda, T., … Imura, J. (2013). The liver in Itai-Itai disease (chronic cadmium poisoning): Pathological features and metallothionein expression. Modern Pathology, 26, 1228–1234. doi: 10.1038/modpathol.2013.62
- Castro, M. S., & Sherwell, J. (2015). Effectiveness of emission controls to reduce the atmospheric concentrations of mercury. Environmental Science & Technology, 49, 14000–14007.
- Guttieri, M. J., Seabourn, B. W., Liu, C., Baenziger, P. S., & Waters, B. M. (2015). Distribution of cadmium, iron, and zinc in millstreams of hard winter wheat (Triticum aestivum L.). Journal of Agricultural and Food Chemistry, 63, 10681–10688. doi: 10.1021/acs.jafc.5b04337
- Hartland, A., Larsen, J. R., Andersen, M. S., Baalousha, M., & O’Carroll, D. (2015). Association of arsenic and phosphorus with iron nanoparticles between streams and aquifers: Implications for arsenic mobility. Environmental Science & Technology, 49, 14101–14109.
- Huang, M., Zhou, S., Sun, B., & Zhao, Q. (2008). Heavy metals in wheat grain: Assessment of potential health risk for inhabitants in Kunshan, China. Science of The Total Environment, 405, 54–61. doi: 10.1016/j.scitotenv.2008.07.004
- Huang, S., Liao, Q., Hua, M., Wu, X., Bi, K., Yan, C., … Zhang, X. (2007). Survey of heavy metal pollution and assessment of agricultural soil in Yangzhong district, Jiangsu Province, China. Chemosphere, 67, 2148–2155. doi: 10.1016/j.chemosphere.2006.12.043
- Huang, Y., Wang, M., Mao, X., Qian, Y., Chen, T., & Zhang, Y. (2015). Concentrations of inorganic arsenic in milled rice from China and associated dietary exposure assessment. Journal of Agricultural and Food Chemistry, 63, 10838–10845.
- Jakubowski, N., Waentig, L., Hayen, H., Venkatachalam, A., von Bohlen, A., Roos, P. H., & Manz, A. (2008). Labelling of proteins with 2-(4-isothiocyanatobenzyl)-1, 4, 7, 10-tetraazacyclododecane-1, 4, 7, 10-tetraacetic acid and lanthanides and detection by ICP-MS. Journal of Analytical Atomic Spectrometry, 23, 1497–1507. doi: 10.1039/b800346g
- Khosraviani, M., Pavlov, A. R., Flowers, G. C., & Blake, D. A. (1998). Detection of heavy metals by immunoassay: Optimization and validation of a rapid, portable assay for ionic cadmium. Environmental Science & Technology, 32, 137–142. doi: 10.1021/es9703943
- Kuang, H., Xing, C., Hao, C., Liu, L., Wang, L., & Xu, C. (2013). Rapid and highly sensitive detection of lead ions in drinking water based on a strip immunosensor. Sensors, 13, 4214–4224. doi: 10.3390/s130404214
- Larson, C. (2014). China gets serious about its pollutant-laden soil. Science, 343, 1415–1416. doi: 10.1126/science.343.6178.1415
- Liu, L., Xing, C., Yan, H., Kuang, H., & Xu, C. (2014). Development of an ELISA and immunochromatographic strip for highly sensitive detection of microcystin-LR. Sensors, 14, 14672–14685. doi: 10.3390/s140814672
- López_Marzo, A. M., Pons, J., Blake, D. A., & Merkoçi, A. (2013). High sensitive gold-nanoparticle based lateral flow immunodevice for Cd2+ detection in drinking waters. Biosensors and Bioelectronics, 47, 190–198. doi: 10.1016/j.bios.2013.02.031
- McNerney, R., & Daley, P. (2011). Towards a point-of-care test for active tuberculosis: obstacles and opportunities. Nature Reviews Microbiology, 9, 204–213. doi: 10.1038/nrmicro2521
- Meharg, A. A., Norton, G., Deacon, C., Williams, P., Adomako, E. E., Price, A., … Islam, M. R. (2013). Variation in rice cadmium related to human exposure. Environmental Science & Technology, 47, 5613–5618. doi: 10.1021/es400521h
- Nardi, E. P., Evangelista, F. S., Tormen, L., Saint, T. D., Curtius, A. J., de Souza, S. S., & Barbosa, F. (2009). The use of inductively coupled plasma mass spectrometry (ICP-MS) for the determination of toxic and essential elements in different types of food samples. Food Chemistry, 112, 727–732. doi: 10.1016/j.foodchem.2008.06.010
- Nota, B., Timmermans, M. J. T. N., Franken, O., Montagne-Wajer, K., Mariën, J., Boer, M. E.d., … Roelofs, D. (2008). Gene expression analysis of collembola in cadmium containing soil. Environmental Science & Technology, 42, 8152–8157. doi: 10.1021/es801472r
- Pan, Y., Guan, D.-X., Zhao, D., Luo, J., Zhang, H., Davison, W., & Ma, L. Q. (2015). Novel speciation method based on diffusive gradients in thin-films for in situ measurement of CrVI in aquatic systems. Environmental Science & Technology, 49, 14267–14273.
- Posthuma-Trumpie, G. A., Korf, J., & van Amerongen, A. (2009). Lateral flow (immuno)assay: Its strengths, weaknesses, opportunities and threats. A literature survey. Analytical and Bioanalytical Chemistry, 393, 569–582. doi: 10.1007/s00216-008-2287-2
- Sasaki, K., Yongvongsoontorn, N., Tawarada, K., Ohnishi, Y., Arakane, T., Kayama, F., … Ohmura, N. (2009). Cadmium purification and quantification using immunochromatography. Journal of Agricultural and Food Chemistry, 57, 4514–4519. doi: 10.1021/jf900155t
- Tang, W., Shan, B., Zhang, H., Zhang, W., Zhao, Y., Ding, Y., … Zhu, X. (2014). Heavy metal contamination in the surface sediments of representative limnetic ecosystems in Eastern China. Scientific Reports, 4, 7152–7152. doi: 10.1038/srep07152
- Tellezplaza, M., Guallar, E., Howard, B., Umans, J., Francesconi, K., Goessler, W., … Navasacien, A. (2013). Cadmium exposure and incident cardiovascular disease. Epidemiology, 24, 421–429. doi: 10.1097/EDE.0b013e31828b0631
- Teng, Y., Wu, J., Lu, S., Wang, Y., Jiao, X., & Song, L. (2014). Soil and soil environmental quality monitoring in China: A review. Environment International, 69, 177–199. doi: 10.1016/j.envint.2014.04.014
- Villa, J. E. L., Peixoto, R. R. A., & Cadore, S. (2014). Cadmium and lead in chocolates commercialized in Brazil. Journal of Agricultural and Food Chemistry, 62, 8759–8763. doi: 10.1021/jf5026604
- Williams, P., Lei, M., Zeng, M., Wang, L., Sun, G., Williams, P., … Sun, G. (2010). Arsenic, lead, and cadmium pollution in rice from Hunan markets and contaminated areas and their health risk assessment. Zhongnan Daxue Xuebao (Ziran Kexue Ban) (Journal of Central South University (Natural Science Edition)), 30, 2314–2320.
- Xing, C., Hao, C., Liu, L., Xu, C., & Kuang, H. (2014). A highly sensitive enzyme-linked immunosorbent assay for copper (II) determination in drinking water. Food and Agricultural Immunology, 25, 432–442. doi: 10.1080/09540105.2013.821600
- Xing, C., Kuang, H., Hao, C., Liu, L., Wang, L., & Xu, C. (2014). A silver enhanced and sensitive strip sensor for Cadmium detection. Food and Agricultural Immunology, 25, 287–300. doi: 10.1080/09540105.2013.781140
- Xing, C., Liu, L., Song, S., Feng, M., Kuang, H., & Xu, C. (2015). Ultrasensitive immunochromatographic assay for the simultaneous detection of five chemicals in drinking water. Biosensors and Bioelectronics, 66, 445–453. doi: 10.1016/j.bios.2014.12.004
- Xing, C., Liu, L., Zhang, X., Kuang, H., & Xu, C. (2014). Colorimetric detection of mercury based on a strip sensor. Analytical Methods, 6, 6247–6253. doi: 10.1039/C3AY42002G
- Xu, L., Yan, W., Ma, W., Kuang, H., Wu, X., Liu, L., … Xu, C. (2015). SERS encoded silver pyramids for attomolar detection of multiplexed disease biomarkers. Advanced Materials, 27, 1706–1711. doi: 10.1002/adma.201402244
- Ye, Q., Li, Y., Jiang, Y., & Yan, X. (2003). Determination of trace cadmium in rice by flow injection on-line filterless precipitation-dissolution preconcentration coupled with flame atomic absorption spectrometry. Journal of Agricultural and Food Chemistry, 51, 2111–2114. doi: 10.1021/jf025945+
- Zhang, X., Gao, B., & Xia, H. (2014). Effect of cadmium on growth, photosynthesis, mineral nutrition and metal accumulation of bana grass and vetiver grass. Ecotoxicology and Environmental Safety, 106, 102–108. doi: 10.1016/j.ecoenv.2014.04.025
- Zhao, H., Nan, T., Tan, G., Gao, W., Cao, Z., Sun, S., … Wang, B. (2011). Development of two highly sensitive immunoassays for detection of copper ions and a suite of relevant immunochemicals. Analytica Chimica Acta, 702, 102–108. doi: 10.1016/j.aca.2011.06.027
- Zhong, M.-S., Jiang, L., Han, D., Xia, T.-X., Yao, J.-J., Jia, X.-Y., & Peng, C. (2015). Cadmium exposure via diet and its implication on the derivation of health-based soil screening values in China. Journal of Exposure Science and Environmental Epidemiology, 25, 433–442. doi: 10.1038/jes.2015.5
- Zhou, H., Yang, W., Liu, M., Li, S., & Li, Q. (2011). Effects of EDTA and organic acids on Cd desorption from Zhangshi irrigation area. Soil, 356–360, 1566–1569.
- Zhou, S., Wen, J., Chen, J., & Lu, Q. (2015). Rapid measurement of microbial extracellular respiration ability using a high-throughput colorimetric assay. Environmental Science & Technology Letters, 2, 26–30. doi: 10.1021/ez500405t
- Zhu, X., Hu, B., Lou, Y., Xu, L., Yang, F., Yu, H., … Liu, F. (2007). Characterization of monoclonal antibodies for lead-chelate complexes: Applications in antibody-based assays. Journal of Agricultural and Food Chemistry, 55, 4993–4998. doi: 10.1021/jf070787d
- Zhu, X., Xu, L., Lou, Y., Yu, H., Li, X., Blake, D. A., & Liu, F. (2007). Preparation of specific monoclonal antibodies (MAbs) against heavy metals: MAbs that recognize chelated cadmium ions. Journal of Agricultural and Food Chemistry, 55, 7648–7653. doi: 10.1021/jf071025l