
ABSTRACT
Folic acid (FA) is an important vitamin for human growth and development, especially for pregnant women. A sensitive, rapid, and accurate FA detection method is required to assess the nutritional quality and safety of foods. A monoclonal antibody against FA was prepared for the development of indirect competitive enzyme-linked immunosorbent assay (ic-ELISA) and lateral-flow immunochromatographic assay (ICA) strip. The 50% inhibitory concentration and limit of detection of ic-ELISA were 0.12 and 0.018 ng/ml, respectively. The visual limit of detection and cut-off values of the lateral-flow ICA strip were 0.5 and 2.5 ng/ml, respectively. Using the ICA strip, FA recovery rates were 89–98% from energy drinks and 73–87% for milk samples and were in good agreement with those obtained from the conventional microbiological assay method. Our developed methods are sensitive, convenient, effective, and suitable for on-site detection and rapid mass screening of food samples.
Introduction
Folic acid (FA), also referred to as vitamin B9 or pteroylglutamic acid, is a water-soluble vitamin that consists of pteridine, para-aminobenzoic acid, and l-glutamic acid. FA is an organic compound necessary for the maintenance of normal body processes, synthesis of proteins and nucleic acids, metabolism of amino acids (Carletti et al., Citation2016; Donnelly, Citation2001; Fox & Stover, Citation2008), and division of cells. The vitamin exists extensively in fresh fruits, leafy vegetables, and meat products. A deficiency in FA leads to nerve system damage, irritability, megaloblastic anemia, diarrhea, and psychiatric disorders (Chang et al., Citation2015; Liu et al., Citation2015; Srivastav, Singh, Yadav, & Srikrishna, Citation2015; Vasquez & Suarez-Obando, Citation2015). In pregnant women, FA deficiency results in neural tube defects, developmental retardation, and early spontaneous abortion (Barco Tavares, Neves Finochio Sabino, Lima, & Tozzo Garcia, Citation2015; Leuckx, Citation2015; Smithells, Sheppard, & Schorah, Citation1976). Therefore, FA supplementation is particularly important in this group of the population (Hisam, Rahman, & Mashhadi, Citation2014). The recommended dietary allowance of FA is 400 mcg DEF/day for adults and 600 mcg DEF/day for pregnant women in the USA. Even though FA is not toxic, high FA levels affect the absorption of vitamin B12 and zinc (Butterworth & Tamura, Citation1989). Consequently, a sensitive, rapid, and accurate FA detection method is required to assess the nutritional quality and safety of foods.
Currently, the microbiological assay method based on Lactobacillus casei is the conventional FA detection method as a standard due to its high sensitivity and simple sample preparation steps (Horne, Citation1997; Horne & Patterson, Citation1988). However, this method is time consuming and labor intensive. Even though a commercial kit (VitaFast® Folic acid kit, R-Biopharm Co., Ltd., Germany) has been developed with a linear range of 0.16–1.28 µg FA/100 g (ml) and a limit of detection (LOD) of 0.018 µg FA/100 g (ml), it is still very time consuming; the complete detection process requires 44–48 h.
High-performance liquid chromatography (HPLC) spectrometry is accurate for FA detection and can be used for the simultaneous detection of several vitamins. However, this method requires complex sample preparation steps and trained personnel (Kall, Norgaard, Pedersen, & Leth, Citation2000; Redeuil, Longet, Benet, Munari, & Campos-Gimenez, Citation2015). Colorimetric methods such as chemiluminescence, fluorescence analysis, and spectrophotometry have been applied for FA analysis (Emara, Masujima, Zarad, Kamal, & El-Bagary, Citation2012; Lima, Vieira, Fernandes, Tanakaa, & Reis, Citation2016; Nagaraja, Vasantha, & Yathirajan, Citation2002), but these methods are not suitable for complex food matrices. To improve detection sensitivity, biosensors have been developed based on electrochemistry (Raoof, Teymoori, Khalilzadeh, & Ojani, Citation2015) and spectroscopy (Hemmateenejad, Shakerizadeh-shirazi, & Samari, Citation2014; Yang, Tan, Shih, & Cheng, Citation2014; Zhang, Wang, Qu, Luo, & Li, Citation2014). However, the use of these biosensors has been limited due to complex sample preparation steps and expensive equipment.
Immunoassays improve detection sensitivity (Jacobsen, Franke, Remillard, & Nuttall, Citation1997; Xing et al., Citation2014). The enzyme-linked immunosorbent assay (ELISA) is a simple, sensitive, and high-throughput detection method that can be used for quantification analyses (Gan & Patel, Citation2013; Guan et al., Citation2015). The lateral-flow immunochromatographic assay (ICA) strip is a rapid, simple, and instrument-free diagnostic tool based on the antigen–antibody system. The ICA strip is suitable for qualitative detection, semiquantitative detection, and mass sample screenings. Results are visualized within 5–10 min by the naked eye (Dzantiev, Byzova, Urusov, & Zherdev, Citation2014; Guo et al., Citation2015; Sajid, Kawde, & Daud, Citation2015). Using a matched strip reader machine, the ICA strip becomes a quantification tool.
In this study, an indirect competitive ELISA (ic-ELISA) and lateral-flow ICA strip based on monoclonal antibody (mAb) were developed for FA detection and determination in energy drink and milk samples.
Materials and methods
Reagents and materials
FA, methotrexate, pteroic acid, pterine, tetrahydrofolic acid, dihydrofolic acid, 5-methyltetrahydrofolic acid, and gelatin were acquired from Sigma (St. Louis, MO, USA). 6-Aminohexanoic acid was obtained from Maika Xi Chengdu Chemical Co. (Chengdu, China). Enzyme immunoassay-grade horseradish peroxidase (HRP)-labeled goat anti-mouse immunoglobulin, bovine serum albumin (BSA), ovalbumin (OVA), 1-ethyl-3-(3-dimeth-ylaminopropyl) carbodiimide hydrochloride (EDC), and N-hydroxysuccinimide (NHS) were purchased from Sigma Chemical Co. (St. Louis, MO, USA). Cell fusion reagents were supplied by Sunshine Biotechnology Co., Ltd. (Nanjing, China). Other reagents and chemicals were obtained from the National Pharmaceutical Group Chemical Reagent Co., Ltd. (Shanghai, China).
Nitrocellulose (NC) high-flow-plus membranes (Pura-bind RP) were obtained from Whatman-Xinhua Filter Paper Co. (Hangzhou, China). Sample pad (CB-SB08), polyvinylchloride (PVC) backing material, and absorbance pad (SX18) were supplied by Goldbio Tech Co. (Shanghai, China).
Antigen preparation
FA antigens were synthesized by conjugating FA with carrier proteins (BSA/OVA) using the active ester and mixed anhydride methods. FA was dissolved in DMSO at 5 mg/ml, and BSA/OVA was dissolved in 0.1 M sodium carbonate–bicarbonate buffer (CB, pH 9.6) at 10 mg/ml. Different sets of FA-BSA and FA-OVA were prepared: FA-BSA-1 and FA-OVA-1, FA-ACA-BSA-2 and FA-ACA-OVA-2, and FA-BSA-3 and FA-OVA-3.
To prepare FA-BSA-1 and FA-OVA-1, EDC (9.8 mg), NHS (4 mg), and FA solution (1 ml) were allowed to react at room temperature (RT) for 4 h. Subsequently, the mixture was added dropwise to 2 ml carrier protein solution and incubated for 2 h at RT (Zhang et al., Citation2012).
To prepare FA-ACA-BSA-2 and FA-ACA-OVA-2, 6-aminohexanoic acid (100 mg), EDC (30 mg), and 50 mg BSA/OVA were allowed to react at RT for 4 h. The conjugate was dialyzed against 0.01 M phosphate buffer solution (PBS) for 3 d. The steps that followed were similar to those used in the preparation of FA-BSA-1 and FA-OVA-1 (Dassarma, Duttagupta, Ali, & Dhar, Citation1995).
To prepare FA-BSA-3 and FA-OVA-3, FA solution (1 ml), tributylamine (13.75 µl), and isobutyl chloroformate (7.5 µl) were allowed to react in an ice bath for 2 h. Subsequently, the mixture was added dropwise to 2 ml of carrier protein solution and incubated in an ice bath for 5 h.
All the antigens were dialyzed against 0.01 M PBS for 3 d and characterized by UV–Vis spectroscopy and SDS-PAGE.
MAb preparation
FA-BSA-1, FA-ACA-BSA-2, and FA-BSA-3 antigens were used as immunogens in female BALB/c mice (8–10 weeks). FA-OVA-1, FA-ACA-OVA-2, and FA-OVA-3 were used as coating antigens in ic-ELISA. The mouse with the highest serum antibody titer and lowest 50% inhibitory concentration (IC50) was selected for cell fusion. The corresponding coating antigen was selected for cell line screening and ic-ELISA development. Cell fusion and screening were performed as previously described (Wang et al., Citation2009). The hybridoma cells were cultured for mAb production, and mAb was purified from ascites using the caprylic acid–ammonium sulfate precipitation method (Kuang et al., Citation2013).
Development of ic-ELISA
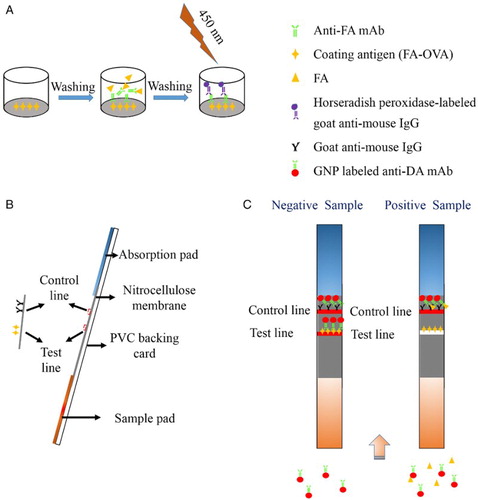
Ic-ELISA was developed as previously described (Khaemba et al., Citation2016; Suryoprabowo, Liu, Peng, Kuang, & Xu, Citation2014). Briefly, coating antigen was dissolved in CB (0.05 M, pH 9.6), added to each well of 96-well plates (100 µl), and incubated at 37°C for 2 h. After washing the plates, each well was blocked with 200 µl blocking buffer (2% gelatin in 0.05 M CB, pH 9.6) and incubated for 2 h at 37°C. After washing, 50 µl anti-FA mAb and 50 µl FA standard were added to each well and incubated for 30 min at 37°C. After washing, 100 µl HRP-labeled goat anti-mouse IgG was added to each well and incubated for 30 min at 37°C. After three washes, 100 µl of 3,3′,5,5′-tetramethylbenzidine substrate was added and incubated in the dark at 37°C for 15 min. Sulfuric acid (2 M) was added to each well (50 µl) to terminate the enzymatic reaction, and the results were measured in a microplate reader at 450 nm (A).
Figure 1. (A) Principle of the Ic-ELISA analysis; (B) composition of the lateral-flow ICA strip; and (C) lateral-flow ICA strip detection with negative and positive sample.
LOD (IC10) and IC50 were determined from a standard curve, which was generated by plotting optical density at 450 nm (OD450) values on the y-axis against FA concentration on the x-axis.
Cross-reactivity
MAb specificity was assessed by measuring cross-reactivity (CR) with FA analogues. Methotrexate, pteroic acid, pterine, tetrahydrofolic acid, dihydrofolic acid, 5-methyltetrahydrofolic acid, and a series of B vitamins were analyzed by ic-ELISA. CR values were calculated using the following equation (Song et al., Citation2010):
Preparation of gold nanoparticle (GNP)-labeled mAb
GNPs and GNP-labeled mAb were synthesized in our laboratory (Feng et al., Citation2015; Liu, Xing, Yan, Kuang, & Xu, Citation2014). For the synthesis of GNP-labeled mAb, the pH value of GNP was adjusted with 0.1 M K2CO3. Subsequently, 0.2 mg anti-FA mAb was added dropwise to 10 ml GNP and maintained at RT for 1 h. BSA (0.5% w/v, 1 ml) was added dropwise and incubated for 2 h. Following incubation, the solution was centrifuged at 7000× g for 30 min, and the resulting precipitate was washed three times with 0.02 M PBS (containing 5% sucrose, 1% BSA, and 0.5% polyethylene glycol 6000, pH 7.4), dissolved in 5 ml of 0.02 M PBS (containing 0.02% NaN3), and stored at 4°C.
Preparation of the lateral-flow ICA strip
For the preparation of the ICA strip, PVC backing card, NC membrane, sample pad, and absorption pad were assembled layer by layer. The NC membrane was attached to the center of the PVC backing card. The sample and absorption pads were placed on both ends of the PVC backing card with a 2-mm overlap of the NC membrane (B). Goat anti-mouse IgG was sprayed onto the NC membrane at 1 µl/cm using a membrane dispenser (Xinqidian Gene-Technology Co. Ltd., Beijing, China) to form the control line (C line). Coating antigen was sprayed onto the NC membrane at 1 µl/cm to form the test line (T line). The card was dried at 37°C, cut into 3-mm wide individual test strips, and stored in a desiccator.
Principle of the lateral-flow ICA strip
The detection principle of the lateral-flow ICA strip is based on the competitive interaction between FA present in sample and coating antigen fixed on the T line for GNP-labeled mAb. For the analysis, 150 µl of sample was mixed with 50 µl GNP-labeled mAb and allowed to react at RT for 5 min. The solution was subsequently added to the sample pad, where it migrated towards the absorption pad. The results were visualized within 5 min by the naked eye. In FA-negative samples, both red T and C lines are obtained. In FA-positive samples, only a red C line is obtained (C).
FA present in the sample first conjugates with GNP-labeled mAbs, resulting in less GNP-labeled mAbs being captured by the coating antigen fixed on the T line. As a result, a light red color appears on the T line. With increasing FA concentration in the sample, the T line color intensity decreases. Therefore, the color intensity of the T line is inversely proportional to the concentration of FA in the sample. The C line should always appear; otherwise, the procedure has been incorrectly performed or the strip was poorly assembled.
The sensitivity of the lateral-flow ICA strip was determined by the detection of a series of FA standards. Each test was repeated seven times. Visual LOD (vLOD) was defined as the lowest concentration of FA that could lead to a definitely weaker T line color intensity compared to that of an FA-negative sample. The cut-off value was defined as the threshold of FA concentration that led to the disappearance of the T line (Xu et al., Citation2015).
Sample analysis
Both energy drink and milk samples were analyzed. Following pH adjustment to 7–7.5, the energy drinks were passed through a 0.2-µm filter membrane. The filter liquor was diluted to a suitable concentration for analysis. Milk samples (10 ml) were centrifuged at 5000× g for 15 min at 4°C. The lipid layer was removed, and the skim milk sample was diluted to a suitable concentration for analysis.
Results and discussion
Characterization of antigen and mAb
FA was conjugated to BSA or OVA by the active ester and mixed anhydride methods. FA-BSA was used as immunogen, and FA-OVA was used as coating antigen. All the antigens were characterized by UV–Vis spectroscopy and SDS-PAGE ( and ).
Figure 2. The UV–Vis spectra of different antigens. (A) Antigens with BSA as carrier protein; and (B) antigens with OVA as carrier protein.
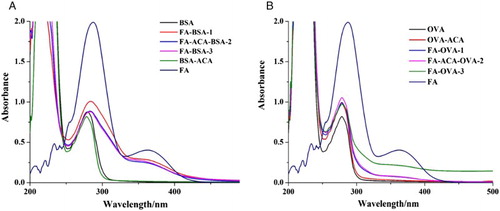
Figure 3. The SDS-PAGE analysis of different antigens. (A) Antigens with BSA as carrier protein: 1. BSA, 2. BSA-ACA, 3. FA-BSA-1, 4. FA-ACA-BSA-2, 5. FA-BSA-3; and (B) antigens with OVA as carrier protein: 1. OVA, 2. OVA-ACA, 3. FA-OVA-1, 4. FA-ACA-OVA-2, 5. FA-OVA-3.
UV–Vis spectra revealed that the absorption of FA was at 288 nm and 363 nm and that of the carrier proteins (BSA/OVA) was at 280 nm. All synthesized antigens () had absorption peaks at 280 nm, and significant different absorption could be observed after 330 nm; peaks were obtained at 363 nm, which suggests that antigen synthesis was successful. An obvious band shift between antigens and carrier proteins was obtained (), confirming that the antigen was successfully conjugated to the carrier proteins.
Development and characterization of ic-ELISA
FA-BSA was used in mice immunization as immunogen; FA-OVA was used as coating antigen in ic-ELISA. Different immunogens and coating antigens were evaluated (). The results revealed that FA-BSA-1 as immunogen and FA-OVA-3 as coating antigen provided the most optimum results.
Table 1. The evaluation of different immunogens and coating antigens.
The mouse with the highest serum antibody titer and lowest IC50 was selected for cell fusion. After cell fusion, the best hybridoma cell line 2E7 was obtained, and mAb was purified from ascites.
The standard curve of mAb 2E7 against FA concentration (y = 0.150 + 1.518/[1 + (x/0.116)1.176]), had a linear regression correlation coefficient (R2) of 0.996, an IC50 value of 0.12 ng/ml, and an LOD (IC10) of 0.018 ng/ml with a linear range of 0.037–1.6 ng/ml ().
Figure 4. The standard curve of developed Ic-ELISA method.
The CR results are shown in . Our developed method had high selectivity for FA. CR was remarkably low with pteroic acid, dihydrofolic acid, and tetrahydrofolic acid (15%, 5.7%, and 7.5%, respectively), and insignificant with other FA derivatives and B vitamins. This result revealed that ic-ELISA was specific to FA.
Table 2. The CR value against FA by the Ic-ELISA method.
Optimization and characterization of the lateral-flow ICA strip
The sensitivity of the lateral-flow ICA strip is mainly affected by coating antigen concentration, GNP-labeled mAb pH and concentration, and strip structure. The concentration of coating antigen on the NC membrane affects the capturing capacity of the T line toward the GNP-labeled mAb, thereby affecting the detection sensitivity of the strip. The pH value and concentration of GNP-labeled mAb affect the stability of GNP-labeled mAb and the strip properties. Different types of sample pads affect the absorption and migration capabilities of the sample.
For the optimization of our developed lateral-flow ICA strip, different coating antigen concentrations and GNP-labeled mAb pH values and concentrations were evaluated (A and 5B). There were no significant color differences between GNP-labeled mAb at pH 8.0 and at pH 9.0. Therefore, pH 8.0 was chosen because it represents a milder reaction condition compared to pH 9. High concentrations of GNP-labeled mAb and high concentrations of coating antigen resulted in a deeper color intensity of the T line. On the other hand, excessive coating antigen concentrations and GNP-labeled mAb reduced the sensitivity of the assay and lead to a waste. Two combinations were selected for further analysis: combination 1, coating antigen at 0.5 mg/ml with a GNP-labeled mAb concentration of 10 µg/ml (pH 8.0) and combination 2, coating antigen at 1 mg/ml with a GNP-labeled mAb concentration of 8 µg/ml (pH 8.0).
Figure 5. The optimization of the lateral-flow ICA strip. (A) Strip with coating antigen at 0.5 mg/ml: 1. GNP-labeled mAb concentration of 8 µg/ml (pH 8.0); 2. GNP-labeled mAb concentration of 10 µg/ml (pH 8.0); 3. GNP-labeled mAb concentration of 8 µg/ml (pH 9.0); 4. GNP-labeled mAb concentration of 10 µg/ml (pH 9.0); (B) strip with coating antigen at 1 mg/ml: (1) GNP-labeled mAb concentration of 8 µg/ml (pH 8.0); (2) GNP-labeled mAb concentration of 10 µg/ml (pH 8.0); (3) GNP-labeled mAb concentration of 8 µg/ml (pH 9.0); and (4) GNP-labeled mAb concentration of 10 µg/ml (pH 9.0); (C) Optimization of two different combinations: (1) coating antigen at 0.5 mg/ml with a GNP-labeled mAb concentration of 10 µg/ml (pH 8.0); (2) coating antigen at 1 mg/ml with a GNP-labeled mAb concentration of 8 µg/ml (pH 8.0); and (D) optimization of resuspension solution for sample pad in 0.01 M PBS with 0.2% Tween-20: (1) 1% PEG 20000; (2) 1% OVA; (3) 1% BSA; and (4) 1% skim milk powder (w/w). N, FA-negative sample (0 ng/ml); P, FA-positive sample (2.5 ng/ ml).
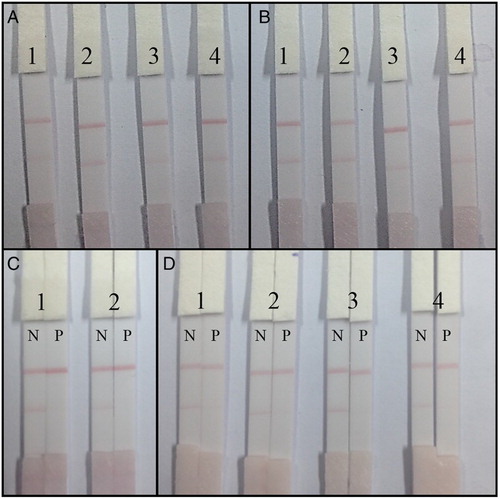
FA-negative sample (0 ng/ml) and FA-positive sample (2.5 ng/ml) were measured using combinations 1 and 2. The results are presented in C. In both combinations, no T line color was observed with FA-positive sample. Therefore, both combinations were sensitive for FA detection. However, a deeper color intensity on the T line of the FA-negative sample was obtained with combination 1. Therefore, the strips had final coating antigen concentration of 0.5 mg/ml and a GNP-labeled mAb concentration of 10 µg/ml (pH 8.0).
For the preparation of the lateral-flow ICA strip, the sample pad should be first immersed in resuspension solution and dried at RT for 4 h to minimize nonspecific binding and matrix effects. Different resuspension solutions consisting of 1% PEG 20000, 1% OVA, 1% BSA, or 1% skim milk powder in 0.01 M PBS with 0.2% Tween-20 were evaluated. The FA-negative sample (0 ng/ml) and the FA-positive sample (2.5 ng/ml) were analyzed (D). The results revealed that the sample pad prepared with resuspension solution consisting of 1% BSA in 0.01 M PBS with 0.2% Tween-20 was the optimum one. The color intensity of the T line disappeared with the FA-positive sample, while a deep color intensity of the T line appeared with the FA-negative sample.
Therefore, the optimum conditions of the developed lateral-flow ICA strip was a coating antigen concentration of 0.5 mg/ml, a GNP-labeled mAb concentration of 10 µg/ml (pH 8.0), and a resuspension solution for the sample pad that consisted of 1% BSA in 0.01 M PBS with 0.2% Tween-20.
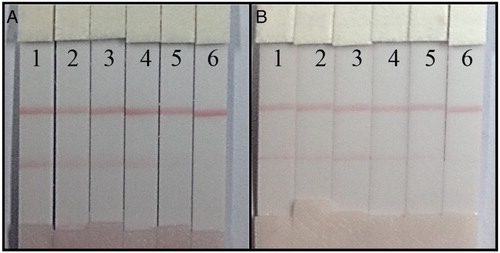
Ultrapure water and milk sample M3, which had the lowest FA concentration based on the microbiological assay method (2.47 µg/100 ml), were subjected to the ICA strip. Samples were spiked with different concentrations of FA. Ultrapure water samples had final FA concentrations of 0, 0.25, 0.5, 1, 2.5, and 5 ng/ml with vLOD of 0.5 ng/ml and a cut-off value of 2.5 ng/ml. Milk samples had final FA concentrations of 2.5, 5, 12.5, and 25 µg/100 ml, FA-free ultrapure water was used as the negative sample, and 1.25 µg/100 ml FA used to spike ultrapure water was analyzed. All samples were diluted 50× and analyzed with the vLOD of 5 µg/100 ml and the cut-off value of 12.5 µg/100 ml. The results are presented in .
Figure 6. FA detection by lateral-flow ICA strip. (A) The ultrapure water samples: (1) 0 ng/ml; (2) 0.25 ng/ml; (3) 0.5 ng/ml; (4) 1 ng/ml; (5) 2.5 ng/ml; and (6) 5 ng/ml; (B) the milk samples (before detection, samples were diluted 50×): (1) 0 µg/100 ml; (2) 1.25 µg/100 ml; (3) 2.5 µg/100 ml; (4) 5 µg/100 ml; (5) 12.5 µg/100 ml; and (6) 25 µg/100 ml.
Sample analysis
The energy drinks and milk samples used in this study were analyzed by the microbiological assay method. Ultrapure water was used as the negative control sample.
For ic-ELISA, energy drink samples E1, E2, E3, and E4 were diluted 2000×, and milk samples M1, M2, M3, and M4 were diluted 100×. Each test was repeated seven times. The results are presented in . The FA recovery rates ranged from 89% to 98% for energy drinks and from 73% to 87% for milk samples. The high protein content of milk samples interfered with the ic-ELISA method (matrix effects), leading to lower recovery rates compared to those obtained from energy drinks. Based on the results, our developed ic-ELISA method was suitable for the sensitive detection of FA.
Table 3. The sample analysis with Ic-ELISA method and lateral-flow ICA strip (n = 7).
For the lateral-flow ICA strip, energy drinks were diluted 1000×, and milk samples were diluted 50×. Negative (−), weakly positive (±), and positive (+) results could be rapidly obtained from the samples. Each test was repeated seven times. The results are presented in . In energy drink samples, following a 1000× dilution, positive results were obtained at FA >50 µg/100 ml, and weakly positive results were obtained at FA approximately 50 µg/100 ml. In milk samples, following a 50× dilution, positive results were obtained at FA >12.5 µg/ml, and weakly positive results were obtained at FA approximately 5 µg/100 ml. Compared to the results obtained from milk samples, those obtained from energy drink samples were more sensitive. Additionally, the gradient variation in color intensity of the T line was more obvious with the energy drink samples. These differences may be attributed to substrate conditions in the samples. More sensitive results could be obtained by repeated measurements of different dilution ratios. In summary, the developed and highly sensitive lateral-flow ICA strip assay was accurate and suitable for the rapid detection and screening analysis of FA in real samples.
Conclusions
For the determination and screening of FA in food samples, we developed an ic-ELISA method and a lateral-flow ICA strip. The sensitive and high-throughput ic-ELISA method with a linear range of 0.037–1.6 ng/ml, had an IC50 and LOD (IC10) of 0.12 ng/ml and 0.018 ng/ml, respectively. In the rapid and simple lateral-flow ICA strip, both simple (energy drinks) and complex (milk samples) matrices could be analyzed. The vLOD and cut-off values were 0.5 ng/ml and 2.5 ng/ml, respectively, in energy drinks and 5 µg/100 ml and 12.5 µg/100 ml, respectively, in milk samples. Both methods were effective for the analysis of food samples, and the results obtained were in good agreement with the microbiological assay method. Therefore, our developed methods are particularly suitable for on-site detection and mass sample screening.
Disclosure statement
No potential conflict of interest was reported by the authors.
Notes on contributors
Dezhao Kong got his bachelor from Nanjing University of Finance & Economics, Nanjing, China in 2012 and then he began to study in Jiangnan University (Wuxi, China) for as a PhD student in food science. His research interests are immunoassay applications in food.
Liqiang Liu got his PhD in Food science in 2014 from Jiangnan University, Wuxi, China and then became a faculty in college of Food science and technology of Jiangnan University. His research interests are immunochromatographic strip design and application.
Shanshan Song got her Master degree in Food science in 2012 from Jiangnan University, Wuxi, China and then became a research assistant in college of Food science and technology of Jiangnan University. Her research interests are monoclonal antibody development.
Hua Kuang got her PhD from China Agricultural University in 2009 and then began to work as a faculty in college of Food science and technology of Jiangnan University. She is currently a full professor in food safety. Her research interests are biosensor development.
Chuanlai Xu is a full professor of Food science and technology of Jiangnan University. He got his PhD in food science in 2002. His research interests are fast detection technology and food safety evaluation.
Additional information
Funding
References
- Barco Tavares, B., Neves Finochio Sabino, A. M., Lima, J. C., & Tozzo Garcia, C. (2015). Knowledge of supplemental folic acid during pregnancy. Investigación y Educación en Enfermería, 33, 456–464.
- Butterworth, C. E.Jr., & Tamura, T. (1989). Folic acid safety and toxicity: A brief review. The American Journal of Clinical Nutrition, 50, 353–358.
- Carletti, J. V., Deniz, B. F., Rojas, J. J., Miguel, P. M., Kolling, J., Scherer, E. B., … Pereira, L. O. (2016). Folic acid can contribute to memory deficit and Na+, K+- ATPase Failure in the hippocampus of adolescent rats submitted to hypoxia- ischemia. CNS & Neurological Disorders Drug Targets, 15, 64–72. doi: 10.2174/1871527315666151110125227
- Chang, J. Y. F., Wang, Y. P., Wu, Y. C., Cheng, S. J., Chen, H. M., & Sun, A. (2015). Hematinic deficiencies and anemia statuses in oral mucosal disease patients with folic acid deficiency. Journal of the Formosan Medical Association, 114, 806–812. doi: 10.1016/j.jfma.2015.06.006
- Dassarma, J., Duttagupta, C., Ali, E., & Dhar, T. K. (1995). Antibody to folic acid: Increased specificity and sensitivity in ELISA by using ε-aminocaproic acid modified BSA as the carrier protein. Journal of Immunological Methods, 184, 1–6. doi: 10.1016/0022-1759(95)00069-M
- Donnelly, J. G. (2001). Folic acid. Critical Reviews in Clinical Laboratory Sciences, 38, 183–223. doi: 10.1080/20014091084209
- Dzantiev, B. B., Byzova, N. A., Urusov, A. E., & Zherdev, A. V. (2014). Immunochromatographic methods in food analysis. Trends in Analytical Chemistry, 55, 81–93. doi: 10.1016/j.trac.2013.11.007
- Emara, S., Masujima, T., Zarad, W., Kamal, M., & El-Bagary, R. (2012). On-line solid-phase enrichment coupled to packed reactor flow injection analysis in a green analytical procedure to determine low levels of folic acid using fluorescence detection. Chemistry Central Journal, 6, 544–551. doi: 10.1186/1752-153X-6-155
- Feng, M., Kong, D. Z., Wang, W. B., Liu, L. Q., Song, S. S., & Xu, C. L. (2015). Development of an immunochromatographic strip for rapid detection of Pantoea stewartii subsp. stewartii. Sensors, 15, 4291–4301. doi: 10.3390/s150204291
- Fox, J. T., & Stover, P. J. (2008). Folate-mediated one-carbon metabolism. Vitamins & Hormones, 79, 1–44. doi: 10.1016/S0083-6729(08)00401-9
- Gan, S. D., & Patel, K. R. (2013). Enzyme immunoassay and enzyme-linked immunosorbent assay. Journal of Investigative Dermatology, 133, 1–3. doi: 10.1038/jid.2013.287
- Guan, D. D., Guo, L. L., Liu, L. Q., Kong, N., Kuang, H., & Xu, C. L. (2015). Development of an ELISA for nitrazepam based on a monoclonal antibody. Food and Agricultural Immunology, 26, 611–621. doi: 10.1080/09540105.2014.998637
- Guo, J. N., Liu, L. Q., Xue, F., Xing, C. R., Song, S. S., Kuang, H., & Xu, C. L. (2015). Development of a monoclonal antibody-based immunochromatographic strip for cephalexin. Food and Agricultural Immunology, 26, 282–292. doi: 10.1080/09540105.2014.907242
- Hemmateenejad, B., Shakerizadeh-shirazi, F., & Samari, F. (2014). BSA-modified gold nanoclusters for sensing of folic acid. Sensors and Actuators B: Chemical, 199, 42–46. doi: 10.1016/j.snb.2014.03.075
- Hisam, A., Rahman, M. U., & Mashhadi, S. F. (2014). Knowledge, attitude and practice regarding folic acid deficiency: A hidden hunger. Pakistan Journal of Medical Sciences, 30, 583–588.
- Horne, D. W. (1997). Microbiological assay of folates in 96-well microtiter plates. Methods Enzymol, 281, 38–43.
- Horne, D. W., & Patterson, D. (1988). Lactobacillus casei microbiological assay of folic acid derivatives in 96-well microtiter plates. Clinical Chemistry, 34, 2357–2359.
- Jacobsen, L. J., Franke, D. R., Remillard, W. S., & Nuttall, K. L. (1997). Vitamin B12 evaluation with methylmalonic acid in serum by capillary electrophoresis. Clinical Chemistry, 43, 805–805.
- Kall, M. A., Norgaard, P., Pedersen, S. J., & Leth, T. (2000). Optimised extraction of folic acid from multivitamin-mineral preparations for liquid chromatographic analysis. Journal of Pharmaceutical and Biomedical Analysis, 23, 437–445. doi: 10.1016/S0731-7085(00)00327-7
- Khaemba, G. W., Tochi, B. N., Mukunzi, D., Joel, I., Guo, L. L., Suryobrobowo, S., … Xu, C. L. (2016). Development of monoclonal antibody and lateral test strip for sensitive detection of clenbuterol and related β 2-agonists in urine samples. Food and Agricultural Immunology, 27, 111–127. doi: 10.1080/09540105.2015.1079598
- Kuang, H., Xing, C. R., Hao, C. L., Liu, L. Q., Wang, L. B., & Xu, C. L. (2013). Rapid and highly sensitive detection of lead ions in drinking water based on a strip immunosensor. Sensors, 13, 4214–4224. doi: 10.3390/s130404214
- Leuckx, S. (2015). Pregnancy wish and folic acid supplements. Journal de Pharmacie de Belgique, 4, 4–7.
- Lima, M. J. A., Vieira, G. P., Fernandes, R. N., Tanakaa, A. A., & Reis, B. F. (2016). Development of a procedure based on chemiluminescence and multicommutation approach for the determination of folic acid in pharmaceuticals. J. Braz. Chem. Soc., 27, 153–160.
- Liu, H., Tian, T., Qin, S. C., Li, W., Zhang, X. M., Wang, X., … Huang, G. W. (2015). Folic acid deficiency enhances abeta accumulation in APP/PS1 mice brain and decreases amyloid-associated miRNAs expression. The Journal of Nutritional Biochemistry, 26, 1502–1508. doi: 10.1016/j.jnutbio.2015.07.020
- Liu, L. Q., Xing, C. R., Yan, H. J., Kuang, H., & Xu, C. L. (2014). Development of an ELISA and immunochromatographic strip for highly sensitive detection of microcystin-LR. Sensors, 14, 14672–14685. doi: 10.3390/s140814672
- Nagaraja, P., Vasantha, R. A., & Yathirajan, H. S. (2002). Spectrophotometric determination of folic acid in pharmaceutical preparations by coupling reactions with iminodibenzyl or 3-aminophenol or sodium molybdate–pyrocatechol. Analytical Biochemistry, 307, 316–321. doi: 10.1016/S0003-2697(02)00038-6
- Raoof, J. B., Teymoori, N., Khalilzadeh, M. A., & Ojani, R. (2015). A high sensitive electrochemical nanosensor for simultaneous determination of glutathione, NADH and folic acid. Materials Science and Engineering: C, 47, 77–84. doi: 10.1016/j.msec.2014.11.012
- Redeuil, K. M., Longet, K., Benet, S., Munari, C., & Campos-Gimenez, E. (2015). Simultaneous quantification of 21 water soluble vitamin circulating forms in human plasma by liquid chromatography-mass spectrometry. Journal of Chromatography A, 1422, 89–98. doi: 10.1016/j.chroma.2015.09.049
- Sajid, M., Kawde, A. N., & Daud, M. (2015). Designs, formats and applications of lateral flow assay: A literature review. Journal of Saudi Chemical Society, 19, 689–705. doi: 10.1016/j.jscs.2014.09.001
- Smithells, R. W., Sheppard, S., & Schorah, C. J. (1976). Vitamin dificiencies and neural tube defects. Archives of Disease in Childhood, 51, 944–950. doi: 10.1136/adc.51.12.944
- Song, S., Lin, F., Liu, L., Kuang, H., Wang, L., & Xu, C. (2010). Immunoaffinity removal and immunoassay for rhodamine B in chilli powder. International Journal of Food Science & Technology, 45, 2589–2595.
- Srivastav, S., Singh, S. K., Yadav, A. K., & Srikrishna, S. (2015). Folic acid supplementation rescues anomalies associated with knockdown of parkin in dopaminergic and serotonergic neurons in Drosophila model of Parkinson’s disease. Biochemical and Biophysical Research Communications, 460, 780–785. doi: 10.1016/j.bbrc.2015.03.106
- Suryoprabowo, S., Liu, L. Q., Peng, J., Kuang, H., & Xu, C. L. (2014). Development of a broad specific monoclonal antibody for Fluoroquinolone analysis. Food Analytical Methods, 7, 2163–2168.
- Vasquez, A. O., & Suarez-Obando, F. (2015). Defectos del tubo neural y del ácido fólico: recorrido histórico de una intervención preventiva altamente efectiva. História, Ciências, Saúde-Manguinhos, 22, 1157–1172. doi: 10.1590/S0104-59702015005000002
- Wang, C. M., Liu, Y. H., Guo, Y. R., Liang, C. Z., Li, X. B., & Zhu, G. N. (2009). Development of a McAb-based immunoassay for parathion and influence of the competitor structure. Food Chemistry, 115, 365–370. doi: 10.1016/j.foodchem.2008.11.091
- Xing, C. R., Kuang, H., Hao, C. L., Liu, L. Q., Wang, L. B., & Xu, C. L. (2014). A silver enhanced and sensitive strip sensor for Cadmium detection. Food and Agricultural Immunology, 25, 287–300. doi: 10.1080/09540105.2013.781140
- Xu, N. F., Li, L. Q., Song, S. S., Xu, L. G., Kuang, H., & Xu, C. L. (2015). Development of a lateral flow immunoassay for the detection of total malachite green residues in fish tissues. Food and Agricultural Immunology, 26, 870–879. doi: 10.1080/09540105.2015.1039498
- Yang, J., Tan, X. B., Shih, W. C., & Cheng, M. M. C. (2014). A sandwich substrate for ultrasensitive and label-free SERS spectroscopic detection of folic acid/methotrexate. Biomedical Microdevices, 16, 673–679. doi: 10.1007/s10544-014-9871-3
- Zhang, J. R., Wang, Z. L., Qu, F., Luo, H. Q., & Li, N. B. (2014). Polyethylenimine-capped silver nanoclusters as a fluorescence probe for highly sensitive detection of folic acid through a two-step electron-transfer process. Journal of Agricultural and Food Chemistry, 62, 6592–6599. doi: 10.1021/jf4054534
- Zhang, T. C., Xue, H. Y., Zhang, B., Zhang, Y., Song, P., Tian, X., … Xi, R. M. (2012). Determination of folic acid in milk, milk powder and energy drink by an indirect immunoassay. Journal of the Science of Food and Agriculture, 92, 2297–2304. doi: 10.1002/jsfa.5625