
ABSTRACT
A specific monoclonal antibody (MAb) against apramycin (AP) was produced and used to develop an indirect competitive enzyme-linked immunosorbent assay (idcELISA) and a rapid testing strip for the detection of AP residues in foods. MAb exhibited negligible cross-reactivity with other aminoglycosides. Under optimized conditions in 0.01 M PBS, the half maximum inhibitory concentration (IC50) of MAb was 0.41 ng/ml with a limit of detection (LOD) of 0.15 ng/ml. The ELISA results were obtained within 90 min. The mean recoveries from all the spiked food samples were within the range of 79.02–105.49%, with coefficients of variation in the range of 2.21–11.4%. The strip test results obtained within 5 min had visual LODs in the range 2.5–5 µg/kg (ng/ml) for all food samples tested. Therefore, the developed strip test represents a fast and convenient detection method of AP residues in foods.
Introduction
Apramycin (AP), synthesized by Streptomyces tenebrarius, is an aminoglycoside antibiotic that disrupts bacterial protein synthesis by binding to the 30S ribosome of susceptible organisms (Suarez, Ellis, & Bizec, Citation2012; Tian, Chen, Guo, Guo, & Mei, Citation2015). While not approved for use in humans, AP is currently used in calves, pigs, rabbits, poultry, and lambs for the treatment of infections caused by Bordetella bronchiseptica, Brucella spp., Escherichia coli, Salmonella spp., Pasteurella multocida, Pseudomonas spp., Klebsiella aerogenes, Staphylococcus spp., and α-haemolytic Streptococci (Suarez et al., Citation2012).
The widespread use of broad spectrum antibiotics such as AP leads to antibiotic residues in edible animal products, which poses a threat to human health by inducing allergies, bacterial resistance, and toxic effects (Chen et al., Citation2015; Choi et al., Citation2011; Fessler, Kadlec, & Schwarz, Citation2011; Xu et al., Citation2015). Therefore, it is crucial to regulate the use of such antibiotics and monitor their residual content in tissues of edible animals.
In several countries, programs have been established to determine both antibiotic levels and maximum permissible levels in foods (Chen et al., Citation2015; Faten, Azzazy, & Niessen, Citation2015; Gaudin, Hedou, & Verdon, Citation2013; Tian et al., Citation2015; Yin, Liu, Song, Kuang, & Xu, Citation2015). For example, the European Union and the United States Food and Drug Administration have established maximum residue levels (MRLs) for AP that range from 60 to 20,000 µg/kg in edible animal tissues such as muscle, liver, and kidney (EU, Citation2010; FDA, Citation2015). Therefore, highly selective and sensitive techniques are required to measure antibiotic residues in foods.
Liquid chromatographic methods coupled with mass spectrometry have been developed to detect AP (Zhang, Wang, Chang, & Yang, Citation2007; Zhao et al., Citation2013) and other aminoglycocide residues in foods (Faten et al., Citation2015; Kumar, Rubies, Companyo, & Centrich, Citation2012; Tian et al., Citation2015). However, these methods are expensive and require time-consuming and laborious sample pretreatment steps, sophisticated laboratory equipment, and technical personnel (Li et al., Citation2016; Lourenco, Barbosa, & Pinto, Citation2011; Xu et al., Citation2011). Additionally, aminoglycosides, which are devoid of a chromophore, cannot be measured by UV absorption and show poor chromatographic properties in reversed-phase liquid chromatography (Faten et al., Citation2015).
Recently, a few alternative AP detection methods have been developed based on enzyme-linked immunosorbent assay (ELISA) techniques (Burkin & Galvidis, Citation2013; Xu et al., Citation2014). These ELISA-based methods are semi-quantitative and are characterized by their high specificity, sensitivity, simplicity, and cost effectiveness, making them particularly useful in routine monitoring and screening of drug residues in foods (Liu, Yan, Zhang, Kuang, & Xu, Citation2015; Tian et al., Citation2015).
The immunoassay approach in apramycin residue detection can be made simpler, faster, and more convenient by using a single-step strip test. In this test, results are obtained within 5–10 min, and the required reagents are included in the strip without the need for any expensive equipment (Kong et al., Citation2016; Sun, Liu, Song, Kuang, & Xu, Citation2016). The most recently developed AP immunoassay detection method (Burkin & Galvidis, Citation2013; Xu et al., Citation2014) did not involve rapid testing strips. Therefore, the objectives of this study were to (1) produce a specific and sensitive monoclonal antibody (MAb) against AP and (2) develop a rapid test strip for the detection of AP residues in different food matrices.
Materials and methods
Chemicals and equipment
Aparamycin, amikacin, kanamycin, gentamicin, paromomycin, lincomycin, neomycin, spectinomycin, streptomycin, and tobramycin were obtained from Aladdin Industrial Corporation (Shanghai, China). Complete Freund’s adjuvant (FCA), incomplete Freund’s adjuvant (FIA), and enzyme immunoassay-grade horseradish peroxidase (HRP)-labeled goat anti-mouse immunoglobulin were acquired from Sigma (St. Louis, MO, USA). Gelatin was purchased from Beijing Biodee Biotechnology Co., Ltd. (Beijing, China). Tetramethylbenzidine (TMB) and HRP were supplied by Aladdin Chemistry Co., Ltd. All cell fusion reagents were acquired from Sunshine Biotechnology Co., Ltd. (Nanjing, China). Bovine serum albumin (BSA) and ovalbumin (OVA) were obtained from Solarbio Science & Technology, Co. Ltd. (Beijing, China). Other reagents and chemicals were purchased from the National Pharmaceutical Group Chemical Reagent Co., Ltd. (Shanghai, China). Dialysis tube (nominal pore size: 10 nm) and 96-well microtiter plates were acquired from Green Bird Biotechnology Development Company Ltd. (Shanghai, China) and Wuxi Biotechnology Company (Wuxi, China), respectively. Eight-week-old male Balb/C mice were obtained from Nanjing Biotechnology Company (Nanjing, China). Nitrocellulose (NC) high-flow plus membranes (Pura-bind RP) were purchased from Whatman-Xinhua Filter Paper Co., Ltd. (Hangzhou, China). Glass fiber membrane (CB-SB08) used for the sample pad, polyvinylchloride (PVC), and absorbance pad (SX18) were supplied by Goldbio Tech Co., Ltd. (Shanghai, China).
Solutions and buffers
Coating buffer (pH 9.6) consisted of 1.59 g Na2CO3 and 2.93 g NaHCO3 in one liter of water. ELISA substrate solution was prepared by mixing 2 ml of 0.06% (w/v) TMB in glycol with 10 ml of 0.1 M citrate phosphate buffer (pH 5.0) containing 1.8 μl of 30% hydrogen peroxide. ELISA stop solution consisted of 2 M sulfuric acid. All other buffers, for example, blocking buffer (0.2% w/v gelatin in coating buffer), washing buffer (phosphate buffer saline [PBS] containing 0.05% v/v Tween 20, PBST), and antibody dilution buffer (PBS containing 0.1% w/v gelatin and 0.05% v/v Tween 20) were prepared with 0.01 M PBS, pH 7.5.
Preparation of immunogens and coating antigens
Glutaraldehyde (GDA) coupling method
Different amounts of AP (14.5 and 19.33 mg) corresponding to different ratios of AP:BSA (90:1 and 120:1) were dissolved in 4 ml of 0.01 M PBS followed by the drop-wise addition of 200 µl of freshly prepared 1% GDA under constant stirring for 15 min. The AP–GDA mixtures were added to 20 mg of BSA dissolved in 2 ml of 0.01 M PBS and allowed to equilibrate under constant stirring for 1 h at 4°C. Sodium borohydride was added to a final concentration of 2 mg/ml, and the solutions were incubated at 4°C for 2 h. The mixtures were subsequently dialyzed against 0.01 M PBS for 3 days at room temperature with frequent changes of the PBS solution every 4–5 h to remove uncoupled haptens. The conjugates (AP–GDA–BSA) were stored at −20°C.The same procedure was followed to prepare the AP–GDA–OVA coating conjugate using AP:OVA ratios of 90:1 and 120:1.
Carbodiimide (EDC) coupling method
BSA (20 mg) dissolved in 2 ml of 0.1 M MES, pH 4.7, was activated with 4 mg of EDC and an equimolar amount of NHS (2.4 mg) dissolved in 2 ml of 0.05 M KH2PO4, pH 8.6. The mixture was incubated under constant stirring for 2 h at room temperature. The activated protein solution was slowly added to different amounts of AP (14.5 and 19.33 mg) corresponding to different AP:BSA ratios (90:1 and 120:1) dissolved in 2 ml of 0.05 M KH2PO4, pH 8.6. The mixture was allowed to equilibrate under constant stirring for 3 h at room temperature. The conjugates were dialyzed against 0.01 M PBS for 3 days with frequent changes of the PBS solution every 4–5 h to remove uncoupled haptens. The conjugates (AP–EDC–BSA) were stored at −20°C. The same procedure was followed to prepare AP–EDC–OVA coating conjugates.
Immunization of mice
The prepared immunogens (AP–GDA–BSA and AP–EDC–BSA) were diluted with sterile 0.9% (w/v) sodium chloride (NaCl), thoroughly mixed with an equal volume of Freund’s adjuvant, and administered subcutaneously to female BALB/c mice (6–8 weeks of age) at multiple sites on the back. The first dose consisted of 100 µl of the diluted immunogens emulsified with Freund’s complete adjuvant. Three subsequent booster injections of 50 µl immunogen each emulsified with Freund’s incomplete adjuvant were administered at 21-day intervals. Seven days following the third boost, mice were tail-bled. Blood samples (antisera) were screened for anti-AP activity by indirect competitive ELISA. The mouse with the highest anti-AP activity was administered a fifth injection intraperitoneally but without Freund’s adjuvant. Four days later, its spleen was removed for hybridoma production.
Elisa development
AP–EDC–OVA was used as the coating antigen. The concentration of coating antigen and antisera or MAb was optimized by the checkerboard method. Microtiter plates were coated with 100 μl/well of AP–EDC–OVA and incubated overnight at 4°C. The plates were subsequently washed three times with PBST and blocked with blocking buffer (200 μl/well). Following a 2-h incubation at 37°C, the plates were washed twice, and 50 μl of the standard solution was added to each well. Thereafter, 50 μl of either diluted antisera or MAb solution was added to each well, and the plates were incubated for 30 min at 37°C. After washing the plates three times, a secondary antibody (HRP-labeled goat anti-mouse immunoglobulin) diluted with antibody dilution buffer at 1:3000 was added (100 μl/well), and the microtiter plates were incubated for 30 min and washed four times. Finally, freshly prepared TMB substrate solution was added to the plates (100 μl/well) and allowed to react in the dark for 15 min at 37°C. Sulfuric acid (2 M) was used to stop the chromogenic reaction (50 μl/well). Optical density (OD) was measured at 450 nm using a microplate reader. Competition curves were obtained by plotting OD against the logarithm of analyte concentration. The software package OriginPro 8.5 (OriginLab Corporation, Northampton, MA, USA) was used to calculate the four-parameter sigmoidal curve equation:
where A is the maximum absorbance in the absence of analyte, B is the curve slope at the inflection point, C is the concentration of analyte resulting in 50% inhibition (IC50), and D is the minimum absorbance at infinite concentration. The IC50 value was used to evaluate ELISA sensitivity.
Hybridoma production, selection, and cloning
Mouse spleen lymphocytes were fused with myeloma cells (5:1 ratio) using PEG 1500 as the fusing agent. The fused cells were suspended in HAT-RPMI 1640 medium supplemented with 20% fetal calf serum and seeded onto five 96-well micro-culture plates, which were previously incubated with a feeder layer of peritoneal macrophages. Eleven days after cell fusion, cell-free culture supernatants were analyzed for the presence of anti-AP antibody using a combination of noncompetitive and competitive indirect ELISA. Wells with high OD values and significant AP recognition activity were selected for cloning by limiting dilution using HT-RPMI 1640 medium supplemented with 20% fetal calf serum. Stable MAb-producing clones were expanded in RPMI 1640 medium supplemented with 20% fetal calf serum and cryopreserved in liquid nitrogen.
Production and purification of MAb
Fifteen mature female BALB/c mice were injected intraperitoneally with 0.5 ml of paraffin oil. After seven days, the mice received an intraperitoneal injection of hybridoma cells (1 × 10⁷ cells) suspended in RPMI 1640 medium. Ascite fluid was harvested 7 days after injection and purified by the caprylic acid-ammonium sulfate precipitation method (Kuang et al., Citation2013). Purified MAb solution was divided into small aliquots and stored at −20°C.
Characterization of MAb and optimization of immunoassay
Optimization of immunoassay pH and salt concentration
Assay buffer (0.01 M PBS) with a pH range of 5.0–9.0 and sodium chloride with a concentration range of 0–3.2% (w/v) were evaluated to optimize ELISA detection.
Cross-reactivity (CR) tests and MAb specificity
A standard AP calibration curve (0.0–8.1 ng/ml) was generated under optimized conditions. Limit of detection (LOD) was determined from the AP concentration that resulted in 50% inhibition. Several aminoglycosides including amikacin, kanamycin, gentamicin, paromomycin, lincomycin, neomycin, spectinomycin, streptomycin, and tobramycin were analyzed for CR using indirect competitive enzyme-linked immunosorbent assay (idcELISA). CR values were calculated by the following equation:
Food sample pretreatment, spiking, and extraction
Five food matrices (bovine milk, whole egg, swine kidney, bovine muscle, and chicken muscle) were purchased from a local supermarket. The five food samples were confirmed to be residue-free by high performance liquid chromatography–mass spectrometry/mass spectrometry. Each sample was spiked with three different concentrations of AP dissolved in 0.01 M PBS, pH 7.5. With the exception of milk and eggs, the samples were chopped and blended prior to spiking and extraction. The spiking and extraction process of the food samples were performed as detailed below.
Bovine milk
AP sulfate (1000 ng/ml in 0.01 M PBS, pH 7.5) was added to milk samples resulting in final concentrations of 100, 200, and 400 ng/ml in a total volume of 2 ml. The spiked milk samples were thoroughly mixed and placed on a shaker at room temperature for 30 min and diluted 200-fold with 0.01 M PBS, pH 7.5. Aliquots (50 µl) of the diluted milk samples were transferred to microtiter plate for analysis. Recovery was calculated on the basis of the standard curve generated by idcELISA.
Whole egg
Egg white and yolk were thoroughly mixed in a blender and stored at −20°C. AP sulfate (10,000 ng/ml in 0.01 M PBS, pH 7.5) was added to the egg samples resulting in final concentrations of 400, 600, and 800 ng/ml in a total volume of 2 ml. The spiked egg samples were thoroughly mixed on a vortex machine for 20 sec and diluted 400-fold with 0.01 M PBS, pH 7.5. Aliquots (50 µl) of the diluted samples were transferred to microtiter plate for analysis. Recovery was calculated on the basis of the standard curve generated by idcELISA.
Swine kidney, bovine, and chicken muscle
Swine kidney and chicken and bovine muscle samples were separately cut into small pieces and blended to form paste-like homogenates. The homogenized tissue samples (1 g wet mass) were accurately weighed and transferred into polypropylene centrifuge tubes. AP sulfate (10,000 ng/ml in 0.01 M PBS) was added to the tissue samples (submerged in PBS) resulting in final concentrations of 50, 100, and 200 µg/kg for swine kidney, and 100, 200, and 400 µg/kg for bovine and chicken muscle in a total volume of 5 ml. The mixtures were vortexed for 30 sec, placed on a shaker at room temperature for 30 min, and centrifuged at 3300×g for 12 min at room temperature. The supernatants were diluted either 100-fold (swine kidney and bovine muscle) or 200-fold (chicken muscle) with 0.01 M PBS, pH 7.5. Aliquots (50 µl) of the diluted samples were transferred to microtiter plate for analysis. Recovery was calculated on the basis of the standard curve generated by idcELISA.
Recovery assessment
Inter-assay variability was determined from triplicate spiked food samples analyzed three times on nine different days. Intra-assay variability was determined from triplicate spiked food samples repeated six times on a single day. Recovery data and precision were expressed as the coefficient of variation (CV) calculated with the following formula:
One-step strip preparation and test procedure
Preparation of colloidal gold particles
A lateral flow strip was developed according to the method reported by Luo et al. (Citation2014). Briefly, all solvents were prepared with doubly distilled water and passed through a 0.22-µm membrane. Chloroauric acid solution (0.1 M, 50 ml) was heated to boiling under constant stirring at 100×g and mixed with 2 ml of 1% w/v trisodium citrate solution for 6 min. Once the solution turned wine-red, it was allowed to cool at room temperature and stored at 4°C. Transmission electron microscopy data showed that the gold nanoparticles had a nearly uniform particle size of 30 nm. The UV–visible spectra characterized the maximum absorbance peak at 530 nm.
Preparation of colloidal gold-labeled antibodies
Colloidal gold solution for conjugation (10 ml) was adjusted to pH 7.0 with 0.1 M K2CO3. MAb (1 ml) was added to the solution drop-wise, and after 50 min, 1 ml of 0.5% (w/v) casein was added and mixed for 2 h. The products were centrifuged at 7000×g for 50 min to remove the gold aggregates. The red supernatant was further centrifuged at 7000×g for 50 min. The resulting lower phase (red gold-labeled MAb) was washed with 0.02 M phosphate buffer (containing 5% sucrose, 1% BSA, and 0.5% PEG 6000, pH 7.4) and purged three times to remove unlabeled MAb. The conjugation products were reconstituted to 1 ml with 0.02 M phosphate buffer containing 0.02% sodium nitrite (NaN3) and stored at 4°C.
Selection of coating antigen for strip assembly
Two different coating antigens (AP–GDA–BSA/90:1 and AP–GDA–OVA/90:1) each at a concentration of 0.5 mg/ml were used to construct the test strip. Gold nanoparticle (1 ml) was diluted with 4 µl of K2CO3 and mixed with 8 and 10 µg/ml antibody 1B4. For the preparation of the zero standard, 6 μl of gold nanoparticle was mixed with 44 μl PBS + Tween 20, and an aliquot (50 μl) was mixed with 150 μl PBS.
Preparation of NC capture membranes
The coating antigen (AP–GDA–BSA/90:1) and goat anti-mouse IgG were used as the capture reagents in the control line. The coating antigen with MAb or goat anti-mouse IgG coating was sprayed onto the NC membrane at 1 μl/cm to generate the test line and control line on the strip. The membrane was dried at 37°C for 30 min and stored at room temperature. The capture reagent was sprayed onto a glass fiber membrane to prepare the conjugate pad, which was dried at 37°C for 2 h. The NC membrane coated with capture reagents was pasted at the center of the PVC plastic backing plate, and the conjugate pad (glass fiber), sample pad, and absorbent pad were attached to the back plate. Finally, the plate was cut into 3-mm wide strips using a strip cutter.
Strip test detection of AP in 0.01 M PBS
The test line contained 1 ml of gold nanoparticles with 4 μl potassium carbonate (K2CO3) and 10 μg/ml of antibody 1B4. The coating concentration used was 0.5 mg/ml. For the preparation of the zero standard, 6 μl of gold nanoparticle was mixed with 44 μl PBS + Tween 20, and an aliquot (50 μl) was mixed with 150 μl PBS.
Strip test detection of AP in spiked food samples
The capture test line was constructed by mixing 1 ml of gold nanoparticles with 4 μl K2CO3 and 10 μg/ml of antibody 1B4. The coating concentration used was 1 mg/ml. For the preparation of the zero standard, 7 μl of gold nanoparticle was mixed with 43 μl PBS + Tween 20, and an aliquot (50 μl) was mixed with 150 μl food sample.
Results and discussion
Immunogen and coating antigen synthesis
AP is a small molecule that lacks immunogenicity. To make it immunogenic, AP has to be conjugated to larger molecules through one of its functional groups (Xu et al., Citation2014). A close observation of the AP chemical structure () reveals the presence of four amino groups and six hydroxyl groups, which can be used to link the AP molecule to macromolecules like proteins and carbohydrates.
Figure 1. The chemical structure of AP showing the six hydroxyl groups and four amino groups any of which can be used to link the AP molecule to a protein or carbohydrate carrier.
With the aid of GDA and EDC, AP was conjugated to carrier proteins (BSA and OVA). Theoretically, any of the four amino groups in AP could be linked to a carrier protein (Xu et al., Citation2014). In the GDA method, GDA was used to cross-link one amino group of AP to another amino group of the carrier protein. In the EDC method, AP was directly conjugated to the carboxyl group of the carrier protein using carbodiimide. In both methods, BSA was used to synthesize immunogens (AP–GDA–BSA and AP–EDC–BSA), while OVA was used to synthesize coating antigens (AP–GDA–OVA and AP–EDC–OVA).
Homologous and heterologous coating antigens were used to determine the titer and inhibition level of antisera. Based on checkerboard titration experiments (results not shown), an adequate OD and inhibition of ≥50% was obtained at 2 ng/ml in a mouse immunized with AP–GDA–BSA/120:1.
Antibody production and selection
During hybridoma screening, six wells of the culture supernatant were found to contain AP-specific MAb based on idcELISA. After three sub-cloning cycles (results not shown), intraperitoneal injection of the hybridoma cells into mice, ascite fluid collection, and purification, the MAb secreted by the hybridoma in well 1B4 was the most sensitive with an IC50 of 0.43 ng/ml. Therefore, MAb 1B4 was chosen for further studies. Both homologous and heterologous coating antigens were utilized to further evaluate the performance of 1B4 MAb; however, none of these coating antigens performed better than the heterologous coating antigen AP–EDC–OVA in terms of sensitivity and affinity. Similar findings have been previously reported (Xu et al., Citation2011; Yan, Liu, Xu, Kuang, & Xu, Citation2015).
Optimization of immunoassay pH and salt concentration
The performance of MAb in ELISA was evaluated using IC50 and Amax (450 nm). During our preliminary checkerboard titration experiments (results not shown), the optimal concentrations of coating antigen (AP–EDC–OVA) and antibody (1B4) were determined to be 0.5 and 0.2 μg/ml, respectively. We observed that it was prudent to evaluate the effect of pH and salt concentration on the performance of MAb in ELISA, because these two parameters vary in different food samples, thereby contributing to matrix interference (Tochi et al., Citation2015).
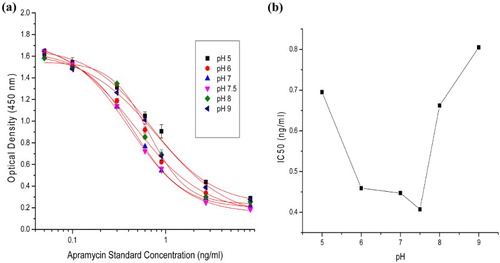
Assay pH (5, 6, 7, 7.5, 8, and 9) did not significantly affect Amax. Additionally, there was no correlation between pH and Amax ((a)). Similar observations have been reported elsewhere (Suryoprabowo et al., Citation2014; Xu et al., Citation2011). However, there was a significant effect of pH on IC50 ((b)). From pH 5 to 7.5, IC50 decreased; however, from pH 7.5 to 9, IC50 increased ((b)). Therefore, pH 7.5 was used for subsequent ELISA experiments, because it produced the lowest IC50 with an adequate Amax value (1.5–1.9).
Figure 2. Effect of pH variation on immunoassay performance (7 point plots for each curve with n = 3). (a) Immunoassay pH variation did not significantly affect the Amax values. (b) IC50 values were significantly affected by assay pH variation.
On the other hand, salt concentration had a significant effect on both Amax and IC50. Amax decreased with increasing salt concentration (), consistent with earlier findings (Guan et al., Citation2015; Sun, Liu, Kuang, & Xu, Citation2013; Suryoprabowo et al., Citation2014; Yan et al., Citation2015). With respect to IC50, the effect of salt concentration was not straight forward. IC50 decreased from 0.0 to 0.8% (w/v) salt, increased from 0.414 to 0.55 ng/ml at 1.2% (w/v) salt, and decreased from 1.6 to 3.2% (w/v) salt (). From 0.0 to 1.6% (w/v) salt, IC50 values changed from 0.414 to 0.628 and Amax was in the range of 1.34–1.84. This finding implied that ELISA was tolerant to variations in salt concentration and could work well in different food matrices.
Table 1. Effect of salt concentration on Amax and IC50.
Even though 3.2% (w/v) salt resulted in the lowest IC50 (0.266 ng/ml), its Amax value (0.627) was too low. Therefore, 0.8% (w/v) salt was used for further experiments, because it generated the lowest IC50 (0.414 ng/ml) and high Amax values in the range of 1.5–1.9.
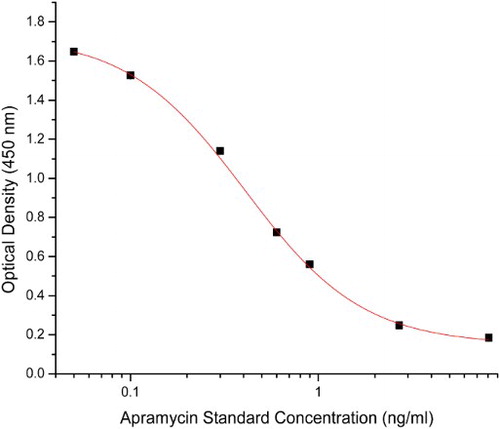
Under the optimized assay conditions (pH 7.5 and 0.8% salt), a seven-point standard AP calibration curve () was generated. The IC50 was 0.41 ng/ml with an LOD of 0.15 ng/ml.
Figure 3. The AP standard curve under optimized conditions (pH 7.5 and salt concentration of 0.8% in PBS), n = 6.
CR tests and MAb specificity
Under optimized conditions, MAb was specific to AP (100%) with very little affinity to the other drug analogues (<1.0%; ). Gentamycin (0.81%) was the most cross-reactive among the nine drug analogues tested. The rest of the aminoglycosides had CR values <0.22%. Past researchers (Burkin & Galvidis, Citation2013; Xu et al., Citation2014) have reported negligible CR values (<1%) of AP MAb with other aminoglycocides (eg streptomycin, gentamicin, kanamycin, tobramycin, spectinomycin, and neomycin). The specificity and negligible CR of AP MAb could mainly be attributed to the unusual structure of AP, which contains a bicyclic sugar moiety and a monosubstituted deoxystreptamine () unlike other aminoglycosides (Burkin & Galvidis, Citation2013)
Table 2. CR of AP MAb with different aminoglycosides.
Table 3. Comparison of the chemical structures of other aminoglycosides to that of AP.
Analysis of food samples and recovery studies
Bovine milk, whole egg, bovine muscle, swine kidney, and chicken muscle were spiked with three different concentrations of AP. Average intra- and inter-assay recoveries were determined as shown in . Intra-assay recoveries ranged from 82.2 to 105.49%, and inter-assay recoveries were in the range of 79.02–98.34%. On the other hand, the intra-assay precision expressed as coefficient of variation was in the range of 3.18–10.18%, while the inter-assay precision ranged between 2.21% and 11.42%. The observed recoveries and precision values were within the same range as those reported by earlier authors who worked on AP MAb (Burkin & Galvidis, Citation2013; Xu et al., Citation2014). Therefore, the extraction method contributed to acceptable recoveries. The corresponding extract dilutions were able to minimize matrix interference in the assay.
Table 4. AP recovery from different spiked food samples.
Strip test procedure and principle
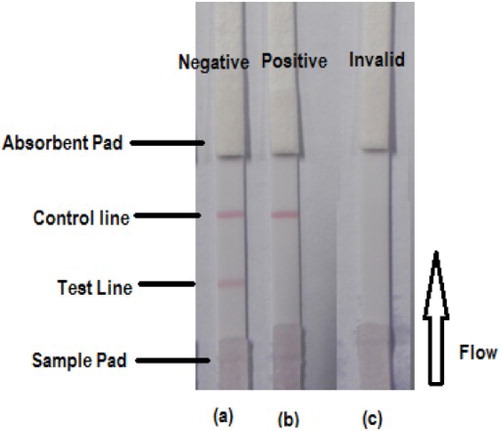
When 50 μl of the sample was added to the conjugate layer that had colloidal gold-labeled antibodies, the solution migrated to the absorbent pad () via capillary action. The test line was embedded with AP–GD–BSA coating antigen; therefore, the presence of AP in the sample led to competition for the finite amount of anti-AP MAb. Consequently, the higher the concentration of AP in the sample, the weaker the color of the test line. When a sufficient amount of AP was present, AP complexed with the labeled MAb, preventing any binding to the coating antigen (AP–GDA–BSA) on the test line ((b)). When AP was absent in the sample, the limited amount of colloidal gold-labeled MAb was trapped by the immobilized coating antigen (AP–GDA–BSA), which in turn created a clear visible red test line as shown in (a). To ensure that the strip works adequately, the flow must reach the control line that is embedded with anti-mouse IgG (Kong et al., Citation2016; Luo et al., Citation2014). When only the control line appears, the result is positive. The appearance of both control line and test line indicates a negative result ().
Figure 4. Illustration of typical strip test results. (a) When both the control and test line appear, the test is negative. (b) A test is positive if only the control line appears but without the test line. (c) The test is invalid either; when only the test line appears without the control line or if both test line and control lines do not appear.
Selection of strip coating antigen
As shown in (a), the two coating antigens (AP–GDA–BSA/90:1 and AP–GDA–OVA/90:1) did not show distinct color intensity at the strip test line when 0.8 µg/ml MAb was used. However, at 10 µg/ml MAb, AP–GDA–BSA/90:1 showed a higher and more distinct color intensity at the test line than AP–GDA–OVA/90:1 ((a)). Results were obtained in 5 min. Therefore, AP–GDA–BSA/90:1 as coating antigen was selected for further strip experiments because it produced a better color intensity than AP–GDA–OVA/90:1.
Figure 5. (a) Selection of coating antigen for use in strip construction. The antigen coating concentration in each case was fixed at 5 mg/ml.(b) Test strip detection of different AP concentrations prepared in 0.01 M PBS; 1 = 0 ng/ml, 2 = 0.1 ng/mL, 3 = 0.25 ng/ml, 4 = 0.5 ng/ml, 5 = 1 ng/mL, 6 = 2.5 ng/ml, and 7 = 5 ng/ml.(c) Strip detection of different AP concentrations in spiked milk samples; 1 = 0 ng/ml, 2 = 0.25 ng/mL, 3 = 0.5 ng/mL, 4 = 1 ng/mL, 5 = 2.5 ng/ml, 6 = 5 ng/l, and 7 = 10 ng/ml.
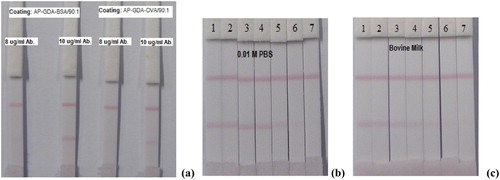
Strip detection of AP in 0.01 M PBS and in spiked bovine milk samples
Different AP concentrations (0, 0.1, 0.25, 0.5, 1.0, 2.5, and 5 ng/ml) were prepared in 0.1 M PBS and analyzed by the strip test. The visual LOD was 2.5 ng/ml ((b)). On the other hand, milk samples spiked with different apramycin concentrations (0, 0.25, 0.5, 1, 2.5, 5, and 10 ng/ml) were analyzed by the strip test ((c)). The visual LOD was 5 ng/ml. Comparable results have been reported (Xu et al., Citation2014) with a visual LOD of 3 ng/ml in raw milk when an AP MAb was applied in an immunoaffinity test column; however, the results were obtained in 20 min. Therefore, although not as sensitive, our developed strip test had a relatively good sensitivity and was faster in terms of detection time (5 min) compared to the immunoaffinity test column (20 min).
Strip detection of AP in other spiked food samples
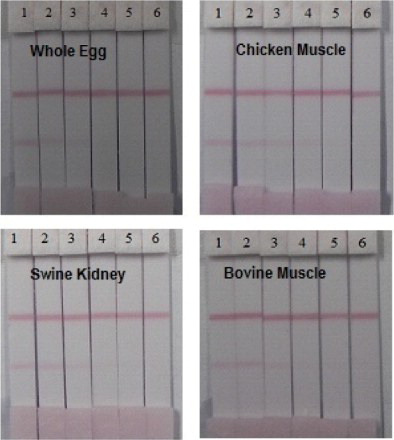
Whole egg, chicken muscle, swine kidney, and bovine muscle samples spiked with different AP concentrations (0, 0.5, 1, 2.5, 5, and 10 µg/kg) were analyzed using the strip test (). The visual LOD was 2.5 µg/kg for whole egg and 5 µg/kg for chicken muscle, swine kidney, and bovine muscle. All results were obtained in 5 min. In China, AP is banned in egg-laying poultry (Petry & Bugang, Citation2010). Therefore, our strip cut-off limit of 2.5 µg/kg can be helpful for AP residue screening in eggs. Related studies (Xu et al., Citation2014), where AP MAb was applied to an immunoaffinity test column, have reported an LOD of 3 µg/kg in chicken muscle within 20 min. Our visual LOD of 5 µg/kg for chicken muscle, bovine muscle, and swine kidney was less than the MRL of 1000 µg/kg for bovine muscle (EU, Citation2010), 100 µg/kg for swine kidney (FDA, Citation2015; Petry & Bugang, Citation2010), and 50 µg/kg for chicken muscle (Goodhew, Citation2015). Therefore, the sensitivity of our strip test was comparable to other AP residue detection methods ((Burkin & Galvidis, Citation2013; Xu et al., Citation2014).
Figure 6. Test strip detection of different AP concentrations in different spiked food samples. 1 = 0 µg/kg, 2 = 0.5 µg/kg, 3 = 1.0 µg/kg, 4 = 2.5 µg/kg, 5 = 5 µg/kg, and 6 = 10 µg/kg.
Conclusion
The developed AP immunoassay was specific and sensitive and had no CR with related analogs. Under optimized conditions, MAb had an IC50 of 0.41 ng/ml with an LOD of 0.15 ng/ml, and the ELISA results were obtained within 90 min. The mean recoveries and coefficients of variation from the spiked food samples were within an acceptable range. Therefore, the developed immunoassay was specific, sensitive, and robust and could be applied in routine screening for AP residues in different food matrices. All strip test results from the different food samples were obtained in 5 min with visual LODs in the range of 2.5–5 µg/kg (ng/ml), which was less than the MRLs established by the European Union, China, and United States. Therefore, the developed test strip does not only complement the immunoassay, but makes AP detection simpler, faster, and more convenient.
Disclosure statement
No potential conflict of interest was reported by the authors.
Notes on contributors
Joel Isanga was born in Uganda and pursued his PhD in the School of Food Science and Technology of Jiangnan University in 2013. His research interests are monoclonal antibody development and applications.
Bitange Nipa Tochi was born in Kenya and pursued his PhD in the School of Food Science and Technology of Jiangnan University in 2012. His research interests are monoclonal antibody development and applications.
Daniel Mukunzi was born in Rwanda and pursued his PhD in the School of Food Science and Technology of Jiangnan University in 2012. His research interests are immunoassays development for agonists.
Yanni Chen obtained her bachelor degree from Liaoning Medical University, Jinzhou, China, in 2012 and then she pursued her PhD in food science in Jiangnan University (Wuxi, China). Her research interests are immunoassay applications in food.
Liqiang Liu obtained his PhD in food science in 2014 from Jiangnan University, Wuxi, China, and then became a faculty in the college of Food Science and Technology of Jiangnan University. His research interests are immunochromatographic strip design and application.
Hua Kuang obtained her PhD from China Agricultural University in 2009 and then began to work as a faculty in college of Food Science and Technology of Jiangnan University. She is currently a full professor in food safety. Her research interests are biosensor development.
Chuanlai Xu is a full professor of food science and technology of Jiangnan University. He obtained his PhD in food science in 2002. His research interests are fast detection technology and food safety evaluation.
Additional information
Funding
References
- Burkin, M., & Galvidis, I. (2013). Immunochemical detection of apramycin as a contaminant in tissues of edible animals. Food Control, 34(2), 408–413. doi: 10.1016/j.foodcont.2013.05.001
- Chen, Y., Wang, Y., Liu, L., Wu, X., Xu, L., Kuang, H., … Xu, C. (2015). A gold immunochromatographic assay for the rapid and simultaneous detection of fifteen β-lactams. Nanoscale, 7, 16381–16388. doi: 10.1039/C5NR04987C
- Choi, M. J., Lim, S. K., Nam, H. M., Kim, A. R., Jung, S. C., & Kim, M. N. (2011). Apramycin and gentamicin resistances in indicator and clinical Escherichia coli isolates from farm animals in Korea. Foodborne Pathogens and Disease, 8, 119–123. doi: 10.1089/fpd.2010.0641
- EU. (2010). Commission regulation on pharmacologically active substances and their classification regarding maximum residue limits in foodstuffs of animal origin. In vol. 37/2010 (pp. 1–72). United Kingdom: Official Journal of the European Union. Retrieved from http://ec.europa.eu/health/files/eudralex/vol-5/reg_2010_37/reg_2010_37_en.pdf
- Faten, F., Azzazy, H. M. E., & Niessen, W. M. A. (2015). Challenges in the determination of aminoglycoside antibiotics, a review. Analytica Chimica Acta, 890, 21–43. doi: 10.1016/j.aca.2015.06.038
- FDA. (2015). Tolerances for residues of new animal drugs in food. In U. S. Government (Ed.), (p. 556). New Hampshire: US Food and Drug Administration. Retrieved from http://www.accessdata.fda.gov/scripts/cdrh/cfdocs/cfcfr/cfrsearch.cfm?cfrpart=556
- Fessler, A. T., Kadlec, K., & Schwarz, S. (2011). Novel apramycin resistance gene apmA in bovine and porcine methicillin-resistant Staphylococcus aureus ST398 isolates. Antimicrobial Agents and Chemotherapy, 55, 373–375. doi: 10.1128/AAC.01124-10
- Gaudin, V., Hedou, C., & Verdon, E. (2013). Validation of two ELISA kits for the screening of tylosin and streptomycin in honey according to the European decision 2002/657/EC. Food Additives and Contaminants: Part A, 30(1), 93–109. doi: 10.1080/19440049.2012.722696
- Goodhew, J. (2015). Maximum residue limit for agricultural compounds. In N. Z. F. Standards (Ed.), (pp. 53). Wellington: New Zealand, Ministry for Primary Industries. Retrieved from http://www.foodstandards.govt.nz
- Guan, D., Guo, L., Liu, L., Kong, N., Kuang, H., & Xu, C. (2015). Development of an ELISA for nitrazepam based on a monoclonal antibody. Food and Agricultural Immunology, 26(5), 611–621. doi: 10.1080/09540105.2014.998637
- Kong, D., Liu, L., Song, S., Suryoprabowo, S., Li, A., Kuang, H., … Xu, C. (2016). A gold nanoparticle-based semi-quantitative and quantitative ultrasensitive paper sensor for the detection of twenty mycotoxins. Nanoscale, 8, 5245–5253. doi: 10.1039/C5NR09171C
- Kuang, H., Xing, C., Hao, C., Liu, L., Wang, L., & Xu, C. (2013). Rapid and highly sensitive detection of lead ions in drinking water based on a strip immunosensor. Sensors, 13, 4214–4224. doi: 10.3390/s130404214
- Kumar, P., Rubies, A., Companyo, R., & Centrich, F. (2012). Determination of aminoglycoside residues in kidney and honey samples by hydrophilic interaction chromatography-tandem mass spectrometry. Journal of Separation Science, 35, 2710–2717. doi: 10.1002/jssc.201200344
- Li, A., Tang, L., Song, D., Song, S., Ma, W., Xu, L., … Xu, C. (2016). A SERS-active sensor based on heterogeneous gold nanostar core–silver nanoparticle satellite assemblies for ultrasensitive detection of aflatoxinB1. Nanoscale, 8, 1873–1878. doi: 10.1039/C5NR08372A
- Liu, L., Yan, H., Zhang, X., Kuang, H., & Xu, C. (2015). Development of an anti-chlorothalonil monoclonal antibody based on a novel designed hapten. Food and Agricultural Immunology, 26(3), 410–419. doi: 10.1080/09540105.2014.938319
- Lourenco, F. R., Barbosa, E. A., & Pinto, T. J. A. (2011). Microbiological assay for apramycin soluble powder. Latin American Journal of Pharmacy, 30, 554–557.
- Luo, L., Suryoprabowo, S., Liu, L., Peng, J., Kuang, H., & Xu, C. (2014). Development of an immunochromatographic strip test for rapid detection of ciprofloxacin in milk samples. Sensors, 14, 16785–16798. doi: 10.3390/s140916785
- Petry, M., & Bugang, W. (2010). Peoples Republic of China, FAIRS subject report on Chinese veterinary drug MRLs. Beijing: USDA Foreign Agricultural Service.
- Suarez, F. A., Ellis, R., & Bizec, B. L. (2012). Apramycin joint FAO/WHO expert committee on food additives. Geneva: Food and Agricultural Organisation.
- Sun, C., Liu, L., Song, S., Kuang, H., & Xu, C. (2016). Development of a highly sensitive ELISA and immunochromatographic strip to detect pentachlorophenol. Food and Agricultural Immunology. doi:10.1080/09540105.2016.1148668.
- Sun, F., Liu, L., Kuang, H., & Xu, C. (2013). Development of ELISA for melamine detection in milk powder. Food and Agricultural Immunology, 24(1), 79–86. doi: 10.1080/09540105.2011.641170
- Suryoprabowo, S., Liu, L. Q., Peng, J., Kuang, H., & Xu, C. L. (2014). Development of a broad specific monoclonal antibody for fluoroquinolone analysis. Food Analytical Methods, 7(10), 2163–2168. doi: 10.1007/s12161-014-9863-1
- Tian, Y.-F., Chen, G.-H., Guo, L.-H., Guo, X., & Mei, X.-Y. (2015). Methodology studies on detection of aminoglycoside residues. Food Analytical Methods, 8, 1842–1857. doi: 10.1007/s12161-014-0067-5
- Tochi, B. N., Khaemba, G., Isanga, J., Mukunzi, D., Liu, L., Peng, J., … Xu, C. (2015). Monoclonal antibody for the development of specific immunoassays to detect Enrofloxacin in foods of animal origin. Food and Agricultural Immunology, 1–14. doi:10.1080/09540105.2015.1089844
- Xu, F., Jiang, W., Zhou, J., Wen, K., Wang, Z., Jiang, H., & Ding, S. (2014). Production of monoclonal antibody and development of a new immunoassay for apramycin in food. Journal of Agricultural and Food Chemistry, 62(14), 3108–3113. doi: 10.1021/jf405379r
- Xu, N., Qu, C., Ma, W., Xu, L., Liu, L., Kuang, H., & Xu, C. (2011). Development and application of one-step ELISA for the detection of neomycin in milk. Food and Agricultural Immunology, 22(3), 259–269. doi: 10.1080/09540105.2011.569882
- Xu, N., Xu, L., Ma, W., Liu, L., Kuang, H., & Xu, C. (2015). An ultrasensitive immunochromatographic assay for non-pretreatment monitoring of chloramphenicol in raw milk. Food and Agricultural Immunology, 26(5), 635–644. doi: 10.1080/09540105.2014.998640
- Yan, H., Liu, L., Xu, N., Kuang, H., & Xu, C. (2015). Development of an immunoassay for carbendazim based on a class-selective monoclonal antibody. Food and Agricultural Immunology, 26(5), 659–670. doi: 10.1080/09540105.2015.1007446
- Yin, Y., Liu, L., Song, S., Kuang, H., & Xu, C. (2015). Development of a highly sensitive icELISA to detect semicarbazide based on a monoclonal antibody. Food and Agricultural Immunology, 26(3), 356–365. doi: 10.1080/09540105.2014.914891
- Zhang, L. Y., Wang, Z. Y., Chang, B. Y., & Yang, W. J. (2007). Determination of apramycin in animal feeds by solid-phase extraction and liquid chromatography with precolumn derivatization and fluorescence detection. Journal of the AOAC International, 90, 885–891.
- Zhao, F., Yue, Z., Xiao, C., Ye, G., Wu, W., & Hu, X. (2013). Determination of apramycin residues in animal tissues by high pressure liquid chromatography-tandem mass spectrometry. Journal of Food Safety and Food Quality, 4, 159–164.