
ABSTRACT
Sensitive and specific anti-sterigmatocystin (STG) monoclonal antibody (mAb) 4G10 was obtained by immunization and cell fusion. An indirect competitive enzyme-linked immunosorbent assay (ic-ELISA) method and lateral-flow immunochromatographic assay (ICA) strip method were developed for the detection of STG in cereal products based on this mAb. The 50% inhibition concentration and limit of detection for the ic-ELISA method were 0.092 and 0.015 ng/mL, respectively. The visual limit of detection (vLOD) and cut-off value for the lateral-flow ICA strip method were 0.1 and 0.5 ng/mL, respectively. From the analysis of different cereal samples (wheat, maize and rice), the recovery rates ranged from 78.3% to 122.0% for the ic-ELISA method. For the lateral-flow ICA strip, the vLODs were 3, 1.2 and 3 ng/g, and the cut-off values were 12, 6 and 6 ng/g for wheat, maize and rice, respectively. Therefore, both of the developed methods are suitable for the on-site detection and rapid screening of numerous samples.
Introduction
Sterigmatocystin (STG) is a type of mycotoxin that is mainly produced by Aspergillus species, such as A. versicolor, A. nidulansand and A. flavus. STG is a biosynthesis precursor of aflatoxin B1 and has a similar structure. Like aflatoxin B1, STG is a cytotoxic, carcinogenic, teratogenic and mutagenic mycotoxin (Gao et al., Citation2015; Holzapfel, Purchase, Steyn, & Gouws, Citation1966; Huang et al., Citation2014), and has been detected in many types of food and animal feed, including cereals (e.g. wheat, maize and rice), bread, cheese, soybeans, pistachio nuts and silage (Ferre, Citation2016; Versilovskis & De Saeger, Citation2010). Therefore, the detection of STG in foodstuffs is crucial to human health.
Many methods, such as thin-layer chromatography (Stroka, Dasko, Spangenberg, & Anklam, Citation2004) and chromatographic techniques (HPLC Marley et al., Citation2015; LC-MS/MS Biancardi & Dall’Asta, Citation2015; Luan et al., Citation2014; GC-MS Hossain & Goto, Citation2015), have already been applied for detection of STG, and some have even been applied for simultaneous analysis of many different types of mycotoxins. Recently, some novel sensors have been developed for detection of STG, such as an amperometric enzyme electrode biosensor (Chen, Liu, Li, & Yao, Citation2010) and fluorescent sensor (Xu, Fang, Pan, Wang, & Wang, Citation2016). However, the commercial instrumentation, exorbitant prices and complex preparation steps greatly inhibit application of these methods.
Without these constraints, the immunoassay method based on the antigen–antibody system is an efficient way to detect mycotoxins (Kong et al., Citation2016; Posthuma-Trumpie, Korf, & van Amerongen, Citation2009). The enzyme-linked immunosorbent assay (ELISA) is a simple, high-throughput and sensitive method for sample screening and quantification (Gan & Patel, Citation2013; Guan et al., Citation2015). And a corresponding ELISA method has been developed for STG determination (Li et al., Citation2014; Li, Chen, Marquardt, Han, & Clarke, Citation1996). Moreover, the lateral-flow immunochromatographic assay (ICA) strip is a rapid, simple and instrument-free diagnostic tool for on-site screening with qualitative/semi-quantitative detection, and the results can be obtained within 5–10 min (Dzantiev, Byzova, Urusov, & Zherdev, Citation2014; Khaemba et al., Citation2016; Sajid, Kawde, & Daud, Citation2015).
In this study, an indirect competitive ELISA (ic-ELISA) method and lateral-flow ICA strip were developed for detection of STG in cereal products, including wheat, maize and rice, based on the antigen–antibody reaction.
Materials and methods
Chemicals
STG, aflatoxin B1 (AFB1), aflatoxin B2 (AFB2), aflatoxin G1 (AFG1), aflatoxin G2 (AFG2), aflatoxin M1 (AFM1), ovalbumin (OVA), bovine serum albumin (BSA), N-hydroxysuccinimide (NHS) and dicyclohexylcarbodiimide (DCC) were obtained from Sigma (St. Louis, MO, USA). Goat anti-mouse immunoglobulin (IgG) antibody was purchased from Jackson ImmunoResearch Laboratories (West Grove, PA, USA). Other reagents and chemicals were acquired from the National Pharmaceutical Group Chemical Reagent Co., Ltd. (Shanghai, China).
Nitrocellulose (NC) high-flow-plus membrane (Pura-bind RP) was obtained from Whatman-Xinhua Filter Paper Co. (Hangzhou, China). The sample pad (CB-SB08), polyvinylchloride (PVC) backing card and absorption pad (SX18) were supplied by Goldbio Tech Co. (Shanghai, China).
Mice were obtained from the Beijing Vital River Laboratory Animal Technology Co., Ltd.
All buffer solutions were prepared with ultrapure water (Milli-Q purification system, Millipore Co., Bedford, MA, USA).
Antigen preparation
STG was conjugated with carrier proteins (BSA and OVA) as the antigens by the NHS ester method after derivation (Cervino, Knopp, Weller, & Niessner, Citation2007; Li et al., Citation2014). Firstly, 0.1 g of hydroxyacetic acid was dissolved in 1 mL dry trifluoroacetic acid, and 1 mg STG was dissolved in 400 µL dry acetonitrile. The STG solution was subsequently added to a hydroxyacetic acid solution dropwise and reacted at room temperature for 2 h under stirring. The reaction solution was dried using a rotary evaporator under reduced pressure. The residue was resuspended in 200 µL dioxane, and the STG-GA product was obtained. Then, 2 mg NHS was added to the dioxane solution and reacted at room temperature for 2 h under stirring, followed by addition of 3 mg DCC and reaction at room temperature overnight under stirring. After centrifugation at 8000 g for 10 min, the supernatant was obtained for future synthesis. Protein (BSA/OVA) was dissolved in 0.1 M sodium carbonate-bicarbonate buffer (CB, pH 9.6) at 10 mg/mL. The supernatant solution was added to the appropriate protein solution and then reacted at room temperature for 4 h under stirring. The conjugates were dialyzed against 0.01 M phosphate-buffered saline (PBS) for 3 d in darkness.
The STG-GA product was analyzed by LC-MS, and antigens were characterized according to the UV spectrum.
Preparation of monoclonal antibody against STG
Female BALB/c mice (8–10 weeks old, No. 11400700129471) were injected with the antigen (STG-BSA) and then tested using the ic-ELISA method. The mice with high serum antibody titer and low 50% inhibition concentration (IC50) were selected for cell fusion. The cell fusion and screening procedures were as described previously (Wang et al., Citation2009). The mouse spleen cells were fused with SP2/0 myeloma cells using PEG 1500, and the ratio of spleen cells to SP2/0 cells was 10:1. The hybridoma cells were screened using the ic-ELISA method and then subcloned three times in order to obtain stable cell lines. The obtained hybridoma cells (1 × 10⁷) were injected into the peritoneal cavity of mice for large-scale production of mAbs. The mAb was purified from ascites using the caprylic acid-ammonium sulfate precipitation method (Kuang et al., Citation2013).
Development of the ic-ELISA method
The ic-ELISA procedure was similar to conventional protocols (Kong et al., Citation2015; Suryoprabowo, Liu, Peng, Kuang, & Xu, Citation2014). Briefly, the coating antigen (STG-GA-OVA) was dissolved in coating buffer (0.05 M, CB, pH 9.6), and then 100 µL was added to each well of the 96-well plates that was subsequently incubated at 37°C for 2 h. The wells were then washed three times, and blocking buffer was added (2% gelatin in 0.05 M CB, pH 9.6) at 37°C for 2 h (200 µL each well). After washing three times, 50 µL anti-STG mAb and 50 µL STG standard solution at different concentrations were added to each well, and the plates were incubated at 37°C for 30 min. Horseradish peroxidase-labeled goat anti-mouse IgG (100 µL) was added to each well, and the plates were again incubated at 37°C for 30 min. After three times washing, 100 µL 3,3′,5,5′-tetramethylbenzidine substrate was added to the wells. The enzymatic reaction proceeded for 15 min at 37°C in darkness and then was stopped with addition of 50 µL sulfuric acid (2 M) per well. The results were read at 450 nm using a microplate reader.
Optimization of the ic-ELISA method
In consideration of the complex process to extract STG in cereal products for detection, the developed ic-ELISA method was optimized for a more sensitive and simple detection system. Different factors that can affect STG detection were analyzed, including pH (5.0, 6.0, 7.4, 8.6, 9.6), ionic strength (NaCl content: 0.2%, 0.4%, 0.8%, 1.6%, 3.2%, m/v) and methanol content (0%, 5%, 10%, 20%, 40%) of the standard dilution buffer (Yan, Liu, Xu, Kuang, & Xu, Citation2015).
Cross-reactivity
The specificity of the mAb was identified by cross-reactivity (CR). AFB1, AFB2, AFG1, AFG2 and AFM1 were tested using the ic-ELISA method. The CR values were calculated as follows:
CR (%) = (IC50 of STG/IC50 of competitor) × 100% (Liu, Yan, Zhang, Kuang, & Xu, Citation2015; Song et al., Citation2010).
Preparation of gold nanoparticles-labeled mAb
The gold nanoparticles (GNPs) were prepared in our lab as described previously (Feng et al., Citation2015; Liu, Xing, Yan, Kuang, & Xu, Citation2014). The pH of the GNP solution was adjusted using 0.1 M K2CO3 and conjugated with anti-STG mAb (10 mL GNP solution with 0.12 mg mAb). The mixture was kept at room temperature for 50 min, then 1 mL of 0.5% BSA (w/v) was slowly added and the mixture was incubated for 2 h at room temperature for blocking and stabilizing the GNP-labeled mAb. The GNP-mAb solution was centrifuged at 7000 g for 30 min. The precipitate was washed three times with 0.02 M PBS (containing 5% sucrose, 1% BSA, and 0.5% PEG 6000, pH 7.4), dissolved in 5 mL of 0.02 M PBS (containing 0.02% NaN3) and then stored at 4°C.
Fabrication of lateral-flow ICA strip
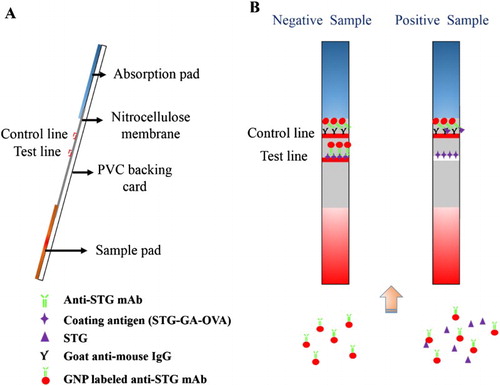
The sample pad for the strip assembly was first immersed in 0.01 M PBS (containing 1% BSA and 0.2% Tween-20) and dried at 37°C for 4 h before use. The NC membrane was attached to the center section of the PVC backing card, and the prepared sample pad and absorption pad were attached to both ends of the PVC backing card and overlapped the NC membrane by 2 mm ((a)). Goat anti-mouse IgG (0.5 mg/mL) was sprayed onto the NC membrane in a location close to the absorption pad at 1 µL/cm with a membrane dispenser (Xinqidian Gene-Technology Co., Ltd., Beijing, China) to form the control zone (C line). The coating antigen was sprayed onto the NC membrane in a location close to the sample pad at 1 µL/cm to form the test zone (T line). The assembled strip card was dried at 37°C for 30 min, cut into individual test strips and then stored in a desiccator for further testing.
Figure 1. Principle of the lateral-flow immunochromatographic strip detection: (A) Composition of the lateral-flow immunochromatographic strip. (B) Strip detection with negative sample and positive sample.
Principle of lateral-flow ICA strip
The ICA strip was also based on the antibody–antigen reaction. The competitive/inhibitory reaction between the STG in samples and the coating antigen (STG-GA-OVA) proceeded on the T line for the GNP-labeled anti-STG mAb.
Firstly, 150 µL sample solution was mixed with 50 µL GNP-labeled mAb and reacted at room temperature for 5 min. The mixture was then added to the sample pad and migrated toward the absorbent pad. After 5 min, the results could be seen with the naked eye (Guo et al., Citation2015).
For negative samples, none of the STG reacted with GNP-labeled mAbs, and all the GNP-labeled mAbs were captured by the coating antigen on the T line and the goat anti-mouse IgG antibody on the C line. Therefore, two red lines appeared on the strip. For positive samples, the STG residue was firstly conjugated with GNP-labeled mAbs, which prohibited capture of the GNP-labeled mAbs by the coating antigen. Therefore, a weaker color intensity on the T line was observed ((b)). The color intensity of the T line is inversely proportional to the concentration of STG in the sample. The C line should always appear; otherwise, the procedure was incorrectly performed or the strip was poorly assembled.
For the lateral-flow ICA strip, the visual limit of detection (vLOD) was defined as the lowest concentration of STG that led to a definitely weaker color intensity of the T line compared to a negative sample. The cut-off value was the STG concentration that led to the disappearance of the T line (Li et al., Citation2013; Song et al., Citation2014).
Sample analysis
For the sample analysis, the wheat, maize and rice samples were prepared for STG detection. Twenty grams of STG-free samples were finely ground and spiked with STG at different concentrations. The spiked samples were then extracted with 80 mL methanol–water (6:4, v/v) by vortex mixing for 15 min and then centrifuged at 8000 g for 10 min. The supernatant was obtained (2 mL) and diluted with 4 mL PBS (NaCl content at 2.4%, m/v) for the ic-ELISA and ICA strip analysis.
Results and discussion
Characterization of antigens
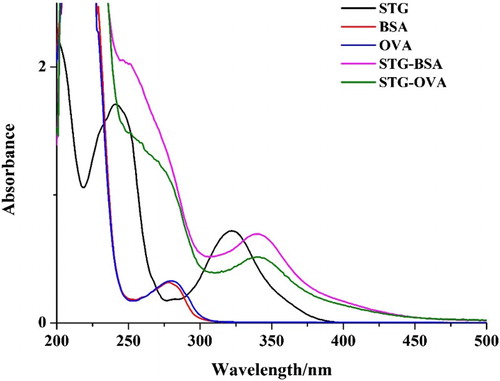
Before being conjugated with carrier protein, the STG was firstly modified with hydroxyacetic acid (). The resultant substance was confirmed using LC-MS/MS. The analysis results () show that most of the STG was successfully conjugated with hydroxyacetic acid and that the STG-GA hapten with a molecular weight of nearly 400 was obtained. The obtained STG-GA hapten was conjugated with BSA/OVA, and the antigens were characterized using UV–VIS spectroscopy (). All the antigens had two simultaneous absorption peaks resulting from the protein (the characteristic peak at 280 nm) and the STG (the characteristic peak at 325 nm), which confirmed that the antigens were successfully linked to protein. The STG-GA-BSA was used as the immunogen, and STG-GA-OVA was used as the coating antigen.
Figure 2. Structures of STG and STG-GA hapten.
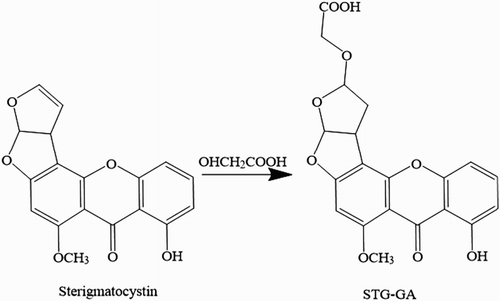
Figure 3. LC-MS analysis of STG-GA hapten.
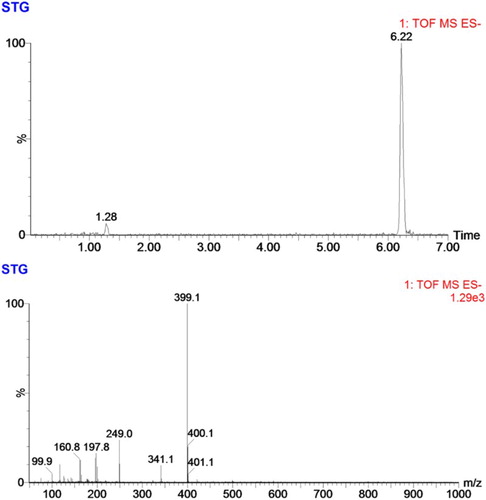
Figure 4. The UV–VIS spectra of different antigens (STG-BSA/STG-OVA).
Development and Optimization of ic-ELISA
The selected cell line, 4G10, was obtained after cell fusion, and the corresponding mAb was purified from ascites using the caprylic acid-ammonium sulfate precipitation method.
In consideration of the process to extract STG for sample analysis, the developed ic-ELISA method was optimized to be more sensitive and suitable for STG detection. Different factors that can affect detection with the standard dilution buffer were analyzed, including pH (5.0, 6.0, 7.4, 8.6, 9.6), ionic strength (NaCl content: 0.2%, 0.4%, 0.8%, 1.6%, 3.2%, m/v) and methanol content (0%, 5%, 10%, 20%, 40%, v/v). The LOD and antibody dilution were chosen as evaluation standards under a coating antigen concentration of 0.1 µg/mL and antibody concentration of 0.125 µg/mL.
The pH and ionic strength of the standard dilution buffer can affect the results of the ic-ELISA method. The pH can affect the number of sites available for the antigen–antibody reaction due to hydrophobic interactions, and an extreme pH can induce marked conformational changes in the antibody molecule, thereby destroying the complementarity with the antigen. The ionic bond on the surface of the antigenic determinant and antibody determinant had an inhibitory effect on the antigen–antibody reaction, as charging the groups of epitopes or paratopes and obstructing the combination and affected the antibody titer and IC50 (Reverberi & Reverberi, Citation2007; Tarakanova et al., Citation2012). The results are shown in (a,b). For the different analysis conditions, the standard dilution buffer with a pH of 8.6 and NaCl content of 1.6% (m/v) contributed to a lower IC50 and appropriate antibody titer.
Figure 5. The optimization of ic-ELISA method. (A) The optimization with different pHs; (B) The optimization with different ionic strengths (NaCl content); (C) The optimization with different methanol contents; (D) The standard curve established under the optimum condition.
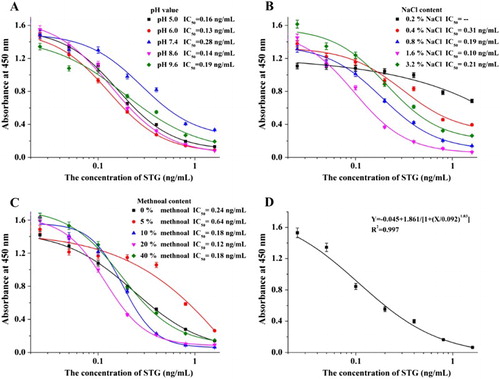
To maintain consistency with the extraction process, standard dilution buffer with different methanol content was analyzed. The results shown in (c) indicate that 20% methanol content (v/v) in standard dilution buffer leads to a better detection result.
The standard curve for ic-ELISA was established under the optimum conditions with standard dilution buffer: a pH of 8.6, NaCl content of 1.6% (m/v) and 20% methanol content (v/v) ((d)). The equation for the standard curve was Y = –0.045 + 1.861 / [1 + (X / 0.092)1.03], the linear regression correlation coefficient (R2) was 0.997, the IC50 was 0.092 ng/mL and the LOD (IC10) was 0.015 ng/mL.
Specificity of mAb
AFB1, AFB2, AFG1, AFG2 and AFM1 were tested using the ic-ELISA method, and the results are shown in . The developed anti-STG mAb was specific and had no CR with other toxins.
Table 1. The CR value of mAb against STG by the ic-ELISA method.
Characterization of the lateral-flow ICA strip
The concentration of the coating antigen and the pH of GNP-labeled mAbs affect the sensitivity of the developed ICA strip. The coating antigen on the NC membrane affects the capturing capacity of the T line toward the GNP-labeled mAbs, thereby affecting the detection sensitivity. Moreover, the pH affects the stability of GNP-labeled mAbs and the strip properties (Kong, Liu, Song, Kuang, & Hu, Citation2016).
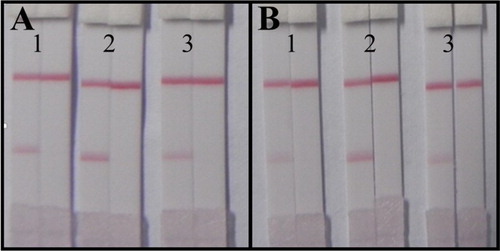
Therefore, the developed ICA strip was analyzed with a positive sample (1 ng/mL) and negative sample (0 ng/mL) under the conditions of different coating antigen concentrations and pHs of GNP-labeled mAbs (). The color intensity of the T line and C line were identical for different concentrations of the coating antigen, so the concentration of 0.5 mg/mL was selected for economization of the coating antigen. Significant differences on the T line were observed at different pHs of GNP-labeled mAbs, and pH 9.0 was selected as the best condition because it produced a deeper color intensity of the T line and the same intensity observed for positive samples.
Figure 6. The optimization of the lateral-flow ICA strip. (A) Strip with coating antigen at 0.5 mg/mL: 1. GNP-labeled mAb under pH 8.0; 2. GNP-labeled mAb under pH 9.0; 3. GNP-labeled mAb under pH 10.0; (B) Strip with coating antigen at 1 mg/mL: 1. GNP-labeled mAb under pH 8.0; 2. GNP-labeled mAb under pH 9.0; 3. GNP-labeled mAb under pH 10.0. (the left: negative sample at 0 ng/mL; the right: positive sample at 1 ng/mL.).
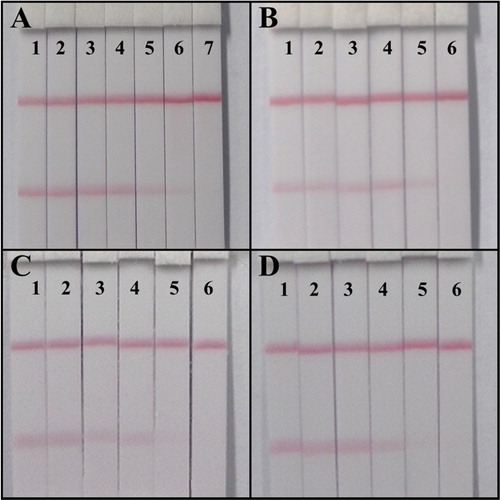
The sensitivity of the developed ICA strip was confirmed with a series dilution of STG standards: 0, 0.025, 0.05, 0.1, 0.25, 0.5 and 1 ng/mL. The results are shown in (a). At 0.1 ng/mL, a definitely weaker color intensity of the T line could be observed by the naked eye, and no color could be observed at 0.5 ng/mL. Therefore, the vLOD and the cut-off value of the developed ICA strip were 0.10 and 0.5 ng/mL, respectively.
Figure 7. Lateral-flow ICA strip analysis. (A). Sensitive detection with STG standards: 1. 0; 2. 0.025; 3. 0.05; 4. 0.1; 5. 0.25; 6. 0.5; 7. 1; (B). The wheat sample analysis: 1. 0; 2. 0.6; 3. 1.2; 4. 3; 5. 6; 6. 12 ng/g; (C). The maize sample analysis: 1. 0; 2. 0.6; 3. 1.2; 4. 3; 5. 6; 6. 12 ng/g; (D). The rice sample analysis: 1. 0; 2. 0.6; 3. 1.2; 4. 3; 5. 6; 6. 12 ng/g.
Sample analysis
For the ic-ELISA method, the calibration curve was established first with the extracted solutions of each free sample (wheat, maize and rice). As the developed ic-ELISA method had been optimized for sample analysis, the calibration curve was approached with the standard curve. Thus, the standard dilution buffer could be used instead of the extracted solution of the free samples in further analysis, which greatly simplifies sample analysis. For analysis of spiked samples, each sample was spiked with the STG standards at concentrations of 1.2, 2.4 and 6.0 ng/g, and then detected using the developed ic-ELISA method. Each detection was repeated six times, and the results are shown in . The recovery rates ranged from 78.3% to 122.0%, which confirmed that the developed ic-ELISA method is sensitive and suitable for the detection of STG in real samples.
Table 2. The spiked sample analysis with the ic-ELISA method (n = 6).
For the lateral-flow ICA strip, each sample was spiked with the STG standards at concentrations of 0, 0.6, 1.2, 3, 6 and 12 ng/g before extraction. Each detection was repeated six times. The vLODs were 3, 1.2 and 3 ng/g, and the cut-off values were 12, 6 and 6 ng/g for wheat, maize and rice, respectively ((a–b)). These results indicate that this rapid lateral-flow ICA strip method with high sensitivity can be used for accurate analysis of real samples.
Conclusion
The sensitive and specific mAb 4G10 was obtained in our work and used for the development of immunoassay methods. Both the ic-ELISA method and the lateral-flow ICA strip method were developed for detection of STG in different cereal products. For the ic-ELISA method, under the optimum conditions, the IC50 for sample analysis was 0.092 ng/mL and the LOD was 0.015 ng/mL. The recovery rates ranged from 78.3% to 122.0% for spiked samples. After optimization of the lateral-flow ICA strip, the vLODs were 3, 1.2 and 3 ng/g and the cut-off values were 12, 6 and 6 ng/g for spiked samples of wheat, maize and rice, respectively. In conclusion, both of the developed immunoassay methods were sensitive, rapid and effective tools for detection of STG in cereal samples, and would be useful for on-site analysis and mass sample screening. These tools will play a significant role in future analytical applications.
Disclosure statement
No potential conflict of interest was reported by the authors.
Notes on contributors
Dezhao Kong obtained his bachelor's degree from Nanjing University of Finance & Economics, Nanjing, China, in 2012 and then he began to study in Jiangnan University (Wuxi, China) as a Ph.D. student in food science. His research interests are immunoassay applications in food.
Zhengjun Xie is a faculty in College of Food Science and Technology of Jiangnan University. He obtained his Ph.D. in food science in 2009. His research interests are biosensor development.
Liqiang Liu obtained his Ph.D. in food science in 2014 from Jiangnan University, Wuxi, China, and then became a faculty in College of Food Science and Technology of Jiangnan University. His research interests are immunochromatographic strip design and application.
Shanshan Song obtained her Master degree in food science in 2012 from Jiangnan University, Wuxi, China, and then became a research assistant in College of Food Science and Technology of Jiangnan University. Her research interests are monoclonal antibody development.
Hua Kuang obtained her Ph.D. from China Agricultural University in 2009 and then began to work as a faculty in College of Food Science and Technology of Jiangnan University. She is currently a full professor in food safety. Her research interests are biosensor development.
Gang Cui is a professor of Food Science and Technology of Jiangnan University. He obtained his Ph.D. in food science in 2007. His research interests are fast detection technology and food safety evaluation.
Chuanlai Xu is a full professor of Food Science and Technology of Jiangnan University. He obtained his Ph.D. in food science in 2002. His research interests are fast detection technology and food safety evaluation.
Additional information
Funding
References
- Biancardi, A., & Dall’Asta, C. (2015). Determination of sterigmatocystin in feed by LC-MS/MS. Food Additives and Contaminants Part A-Chemistry, 32, 2093–2100.
- Cervino, C., Knopp, D., Weller, M. G., & Niessner, R. (2007). Novel aflatoxin derivatives and protein conjugates. Molecules, 12, 641–653.
- Chen, J. H., Liu, D. L., Li, S. C., & Yao, D. S. (2010). Development of an amperometric enzyme electrode biosensor for sterigmatocystin detection. Enzyme and Microbial Technology, 47, 119–126.
- Dzantiev, B. B., Byzova, N. A., Urusov, A. E., & Zherdev, A. V. (2014). Immunochromatographic methods in food analysis. TrAC Trends in Analytical Chemistry, 55, 81–93.
- Feng, M., Kong, D. Z., Wang, W. B., Liu, L. Q., Song, S. S., & Xu, C. L. (2015). Development of an immunochromatographic strip for rapid detection of Pantoea stewartii subsp. stewartii. Sensors, 15, 4291–4301.
- Ferre, F. S. (2016). Worldwide occurrence of mycotoxins in rice. Food Control, 62, 291–298.
- Gan, S. D., & Patel, K. R. (2013). Enzyme Immunoassay and Enzyme-Linked Immunosorbent Assay. Journal of Investigative Dermatology, 133, 1–3.
- Gao, W., Jiang, L. P., Ge, L., Chen, M., Geng, C. Y., Yang, G., Li, Q. J., Ji, F., Yan, Q., Zou, Y., Zhong, L. F., & Liu, X. F. (2015). Sterigmatocystin-induced oxidative DNA damage in human liver-derived cell line through lysosomal damage. Toxicology in Vitro, 29, 1–7.
- Guan, D. D., Guo, L. L., Liu, L. Q., Kong, N., Kuang, H., & Xu, C. L. (2015). Development of an ELISA for nitrazepam based on a monoclonal antibody. Food and Agricultural Immunology, 26, 611–621.
- Guo, J. N., Liu, L. Q., Xue, F., Xing, C. R., Song, S. S., Kuang, H., & Xu, C. L. (2015). Development of a monoclonal antibody-based immunochromatographic strip for cephalexin. Food and Agricultural Immunology, 26, 282–292.
- Holzapfel, C. W., Purchase, I. F., Steyn, P. S., & Gouws, L. (1966). The toxicity and chemical assay of sterigmatocystin, a carcinogenic mycotoxin, and its isolation from two new fungal sources. South African medical journal = Suid-Afrikaanse tydskrif vir geneeskunde, 40, 1100–1101.
- Hossain, M. Z., & Goto, T. (2015). Determination of sterigmatocystin in grain using gas chromatography-mass spectrometry with an on-column injector. Mycotoxin Research, 31, 17–22.
- Huang, S. J., Wang, J., Xing, L. X., Shen, H. T., Yan, X., Wang, J. L., & Zhang, X. H. (2014). Impairment of cell cycle progression by sterigmatocystin in human pulmonary cells in vitro. Food and Chemical Toxicology, 66, 89–95.
- Khaemba, G. W., Tochi, B. N., Mukunzi, D., Joel, I., Guo, L. L., Suryobrobowo, S., Song, S. S., Kuang, H., & Xu, C. L. (2016). Development of monoclonal antibody and lateral test strip for sensitive detection of clenbuterol and related β2-agonists in urine samples. Food and Agricultural Immunology, 27, 111–127.
- Kong, D., Liu, L., Song, S., Suryoprabowo, S., Li, A., Kuang, H., Wang, L., & Xu, C. (2016). A gold nanoparticle-based semi-quantitative and quantitative ultrasensitive paper sensor for the detection of twenty mycotoxins. Nanoscale, 8, 5245–5253.
- Kong, D. Z., Liu, L. Q., Song, S. S., Kuang, H., & Xu, C. L. (2016). Development of an immunochromatographic strip for the semi-quantitative and quantitative detection of biotin in milk and milk products. Analytical Methods, 8, 1595–1601.
- Kong, N., Guo, L. L., Guan, D. D., Liu, L. Q., Kuang, H., & Xu, C. L. (2015). An ultrasensitive ELISA for medroxyprogesterone residues in fish tissues based on a structure-specific Hapten. Food Analytical Methods, 8, 1382–1389.
- Kuang, H., Xing, C. R., Hao, C. L., Liu, L. Q., Wang, L. B., & Xu, C. L. (2013). Rapid and highly sensitive detection of lead ions in drinking water based on a strip immunosensor. Sensors, 13, 4214–4224.
- Li, M., Li, P. W., Wu, H., Zhang, Q., Ma, F., Zhang, Z. W., Ding, X. X., & Wang, H. L. (2014). Sensitive monoclonal antibody-based competitive enzyme immunoassay for sterigmatocystin in cereal and oil products. PLoS One, 9, e106415. doi:10.1371/journal.pone.0106415
- Li, S. Z., Chen, P. Y., Marquardt, R. R., Han, Z. K., & Clarke, J. R. (1996). Production of a sensitive monoclonal antibody to sterigmatocystin and its application to ELISA of wheat. Journal of Agricultural and Food Chemistry, 44, 372–375.
- Li, X., Li, P. W., Zhang, Q., Li, R., Zhang, W., Zhang, Z. W., Ding, X. X., & Tang, X. Q. (2013). Multi-component immunochromatographic assay for simultaneous detection of aflatoxin B1, ochratoxin A and zearalenone in agro-food. Biosensors and Bioelectronics, 49, 426–432.
- Liu, L. Q., Xing, C. R., Yan, H. J., Kuang, H., & Xu, C. L. (2014). Development of an ELISA and immunochromatographic strip for highly sensitive detection of microcystin-LR. Sensors, 14, 14672–14685.
- Liu, L. Q., Yan, H. J., Zhang, X., Kuang, H., & Xu, C. L. (2015). Development of an anti-chlorothalonil monoclonal antibody based on a novel designed hapten. Food and Agricultural Immunology, 26, 410–419.
- Luan, L., Chen, N., Han, Z., Liu, X., Zheng, Y., & Wu, Y. (2014). Simultaneous determination of aflatoxin B1, aflatoxin B2, mycophenolic acid and sterigmatocystin in grape pomace by UHPLC-MS/MS. World Mycotoxin Journal, 7, 121–129.
- Marley, E., Brown, P., Mackie, J., Donnelly, C., Wilcox, J., Pietri, A., & Macdonald, S. (2015). Analysis of sterigmatocystin in cereals, animal feed, seeds, beer and cheese by immunoaffinity column clean-up and HPLC and LC-MS/MS quantification. Food Additives and Contaminants Part A-Chemistry, 32, 2131–2137.
- Posthuma-Trumpie, G. A., Korf, J., & van Amerongen, A. (2009). Lateral flow (immuno)assay: its strengths, weaknesses, opportunities and threats. A literature survey. Analytical and Bioanalytical Chemistry, 393, 569–582.
- Reverberi, R., & Reverberi, L. (2007). Factors affecting the antigen-antibody reaction. Blood transfusion = Trasfusione del sangue, 5, 227–240.
- Sajid, M., Kawde, A. N., & Daud, M. (2015). Designs, formats and applications of lateral flow assay: A literature review. Journal of Saudi Chemical Society, 19, 689–705.
- Song, S., Lin, F., Liu, L., Kuang, H., Wang, L., & Xu, C. (2010). Immunoaffinity removal and immunoassay for rhodamine B in chilli powder. International Journal of Food Science & Technology, 45, 2589–2595.
- Song, S. Q., Liu, N., Zhao, Z. Y., Ediage, E. N., Wu, S. L., Sun, C. P., De Saeger, S., & Wu, A. B. (2014). Multiplex lateral flow immunoassay for mycotoxin determination. Analytical Chemistry, 86, 4995–5001.
- Stroka, J., Dasko, L., Spangenberg, B., & Anklam, E. (2004). Determination of the Mycotoxin, Sterigmatocystin, by Thin-Layer Chromatography and Reagent-Free Derivatisation. Journal of Liquid Chromatography & Related Technologies, 27, 2101–2111.
- Suryoprabowo, S., Liu, L. Q., Peng, J., Kuang, H., & Xu, C. L. (2014). Development of a broad specific monoclonal antibody for fluoroquinolone analysis. Food Analytical Methods, 7, 2163–2168.
- Tarakanova, Y. N., Dmitriev, D. A., Massino, Y. S., Smirnova, M. B., Segal, O. L., Fartushnaya, O. V., Yakovleva, D. A., Kolyaskina, G. I., Lavrov, V. F., & Dmitriev, A. D. (2012). Effect of conditions of monoclonal antibody adsorption on antigen-binding activity. Applied Biochemistry and Microbiology, 48, 506–512.
- Versilovskis, A., & De Saeger, S. (2010). Sterigmatocystin: Occurrence in foodstuffs and analytical methods–an overview. Molecular Nutrition & Food Research, 54, 136–147.
- Wang, C. M., Liu, Y. H., Guo, Y. R., Liang, C. Z., Li, X. B., & Zhu, G. N. (2009). Development of a McAb-based immunoassay for parathion and influence of the competitor structure. Food Chemistry, 115, 365–370.
- Xu, L. H., Fang, G. Z., Pan, M. F., Wang, X. F., & Wang, S. (2016). One-pot synthesis of carbon dots-embedded molecularly imprinted polymer for specific recognition of sterigmatocystin in grains. Biosensors and Bioelectronics, 77, 950–956.
- Yan, H. J., Liu, L. Q., Xu, N. F., Kuang, H., & Xu, C. L. (2015). Development of an immunoassay for carbendazim based on a class-selective monoclonal antibody. Food and Agricultural Immunology, 26, 659–670.