
ABSTRACT
A monoclonal antibody (MAb) was produced against paromomycin and used in the development of an immunoassay and a lateral flow strip test for the detection of paromomycin residues in food matrices. The MAb had 25.1% cross-reactivity with neomycin, but was insensitive to other aminoglycosides. Tested under optimized conditions in 0.01 M phosphate-buffered saline, the half maximum inhibitory concentration (IC50) of the MAb was 0.61 ng/ml for paromomycin and 2.43 ng/ml for neomycin, with results obtained within 90 min. The mean recoveries from spiked food matrices were within the range of 64.56–105.85% for paromomycin and 54.08–100.55% for neomycin. The strip test results for different food matrices were obtained within 5 min and showed visual detection limits of 2.5–20 ng/ml (µg/kg) for paromomycin and 10–30 ng/ml for neomycin. Therefore, the developed immunoassay and strip test can be used in food analysis for routinely monitoring not only paromomycin but also neomycin residues.
Introduction
Paromomycin is a water-soluble broad-spectrum aminoglycoside antibiotic derived from Streptomyces rimosus var. paromomycinus (Pujol-Brugués, Calpena-Campmany, Riera-Lizandra, Halbaut-Bellowa, & Clares-Naveros, Citation2014) Like other aminoglycosides, the mechanism of its activity involves its specific binding to the bacterial ribosomal RNA oligonucleotide at the A site, causing misreading and the premature termination of translation, the inhibition of protein synthesis, and consequent cell death (Armstrong et al., Citation2012; Hermann & Westhof, Citation1999). Paromomycin is structurally related to neomycin, and the only major difference is that neomycin has a 6′-amino group and paromomycin a 6′-hydroxyl group ().
Figure 1. Chemical structures of paromomycin and neomycin compared to those of other aminoglycosides.
The antibacterial spectrum of paromomycin is similar to that of neomycin, but it is also active against some protozoa, including Leishmania spp., Entamoeba histolytica, and Cryptosporidium spp., and has anthelmintic properties against tapeworms (Armstrong et al., Citation2012; Bavarsad, Bazzaz, Khamesipour, & Jaafari, Citation2012). In human therapies, paromomycin sulfate is used to treat amebiasis, giardiasis, and leishmaniosis (Bavarsad et al., Citation2012). It is also used as a veterinary drug for the treatment of bacterial infections in different species, including poultry, where it exerts preventive effects against histomoniasis, a debilitating disease in turkeys (Bories et al., Citation2009).
The Committee for Veterinary Medicinal Products (CVMP) of the European Medicines Agency (EMA) is responsible for preparing opinions on questions concerning the safe utilization of veterinary drugs. The EMA/CVMP has assessed paromomycin sulfate on several occasions (EMA/CVMP, Citation1996, Citation2000, Citation2002) and authorized it as a veterinary drug for parenteral (calves, pigs, and dry cows) or oral administration through feed and water (calves, piglets, and chickens).
Maximum residual limits (MRLs) have been set for muscle (500 μg kg–1) and liver and kidney (1500 μg kg–1) in all species, including poultry, and are enforced (Bories et al., Citation2009; Hafez, Hauck, Gad, De Gussem, & Lotfi, Citation2010). Although paromomycin is registered for use in all food-producing animal species, its use is not permitted in animals that produce milk or eggs for human consumption (Hafez et al., Citation2010).
Because paromomycin is used in both human and veterinary medicine, serious consequences of antibiotic therapy can be anticipated when paromomycin is used as a feed additive (Bories et al., Citation2009). It has been demonstrated that paromomycin, even at the lowest proposed feed concentration, selects for resistance and cross-resistance against variety of other aminoglycosides among intestinal bacteria (Bories et al., Citation2009). Therefore, it is important to regulate the use of paromomycin by monitoring its residual content in edible livestock tissues. Such monitoring requires highly selective and sensitive techniques to measure the residual content of paromomycin in foods of animal origin.
Chromatographic methods are commonly used to detect aminoglycoside residues in foods (Faten, Azzazy, & Niessen, Citation2015; Kumar, Rubies, Companyo, & Centrich, Citation2012; Tian, Chen, Guo, Guo, & Mei, Citation2015) and a liquid chromatographic method for the detection of paromomycin has been developed (Pujol-Brugués et al., Citation2014). However, paromomycin, like other aminoglycosides, cannot be measured by UV absorption because it lacks a chromophore and has poor chromatographic properties on reversed-phase liquid chromatography (Faten et al., Citation2015). Chromatographic methods are also expensive and require time-consuming and laborious sample pretreatment steps, sophisticated laboratory equipment, and technical personnel (Li et al., Citation2016; Lourenco, Barbosa, & Pinto, Citation2011; Xu et al., Citation2011). Therefore, alternative methods for determining paromomycin residues in foods must be developed.
The enzyme-linked immunosorbent assay (ELISA) and the lateral flow strip test allow the semi-quantitative analysis of various drug residues and have the advantages of simplicity, rapidity, specificity, convenience, high sensitivity, and cost effectiveness, and the samples need only be pretreated simply before detection (Gu, Liu, Song, Kuang, & Xu, Citation2016; Peng, Song, Liu, Kuang, & Xu, Citation2016; Wang et al., Citation2016; Yu, Liu, Song, Kuang, & Xu, Citation2016).
Although several ELISA methods have been developed and used for the detection of aminoglycosides (Burkin & Galvidis, Citation2013; Isanga et al., Citation2016; Xu et al., Citation2014), there are no reports of their use in the detection of paromomycin residues in food. Therefore, the main objective of this study was to develop a monoclonal antibody (MAb) assay and a lateral flow strip test to detect paromomycin residues in foods of animal origin.
Materials and methods
Chemicals and apparatus
Paromomycin, neomycin, streptomycin, kanamycin, amikacin, gentamicin, apramycin, lincomycin, spectinomycin, and tobramycin were obtained from Toronto Research Chemicals Inc. (Toronto, Canada). Freund’s complete adjuvant (FCA), Freund’s incomplete adjuvant (FIA), and enzyme-immunoassay-grade horseradish peroxidase (HRP)-labeled goat anti-mouse immunoglobulin G (IgG) were from Sigma (St. Louis, MO, USA). Gelatin was purchased from Beijing Biodee Biotechnology Co., Ltd (Beijing, China). Tetramethylbenzidine (TMB) and HRP were supplied by Aladdin Chemistry Co., Ltd. All cell fusion reagents were acquired from Sunshine Biotechnology Co., Ltd (Nanjing, China). Bovine serum albumin (BSA) and ovalbumin (OVA) were obtained from Solarbio Science & Technology Co., Ltd (Beijing, China). Other reagents and chemicals were purchased from the National Pharmaceutical Group Chemical Reagent Co., Ltd (Shanghai, China). Dialysis tubes (nominal pore size: 10 nm) and 96-well microtiter plates were from Green Bird Biotechnology Development Company Ltd (Shanghai, China) and Wuxi Biotechnology Company (Wuxi, China), respectively. Eight-week-old female BALB/c mice were obtained from Nanjing Biotechnology Company (Nanjing, China). Nitrocellulose high-flow plus membranes (PuraBind™ RP) were purchased from Whatman-Xinhua Filter Paper Co., Ltd (Hanzhou, China). The glass fiber membrane (CB-SB08) used for the sample pad, polyvinylchloride (PVC), and absorbance pad (SX18) were supplied by Goldbio Tech Co., Ltd (Shanghai China).
Solutions and buffers
The ELISA substrate solution was prepared by mixing 2 ml of 0.06% (w/v) TMB in glycol with 10 ml of 0.1 M citrate phosphate buffer (pH 5.0) containing 1.8 μl of 30% hydrogen peroxide. The ELISA stop solution consisted of 2 M sulfuric acid. The coating buffer (pH 9.6) consisted of 1.59 g of Na2CO3 and 2.93 g of NaHCO3 in one liter of water. All other buffers were prepared with 0.01 M phosphate-buffered saline (PBS; pH 7.5): blocking buffer (0.2% [w/v] gelatin in coating buffer), washing buffer (PBS containing 0.05% [v/v] Tween 20, PBST), and antibody dilution buffer (PBS containing 0.1% [w/v] gelatin and 0.05% [v/v] Tween 20).
Design and synthesis of antigens
The immunogens and coating antigens were prepared with the glutaraldehyde (GDA) and carbodiimide (EDC) coupling methods reported in previous studies (Isanga et al., Citation2016; Xu et al., Citation2011; Xu et al., Citation2014), as briefly described below.
Gda coupling method
Various amounts of paromomycin (PR) [8.52, 25.57, or 31.96 mg] corresponding to different PR:BSA ratios (40:1, 120:1, or 150:1) were dissolved in 4 ml of 0.01 M PBS, and 200 µl of freshly prepared 1% GDA was added dropwise with constant stirring for 15 min. The paromomycin (PR)–GDA mixtures were added to 20 mg of BSA dissolved in 2 ml of 0.01 M PBS and allowed to equilibrate with constant stirring for 1 h at 4°C. Sodium borohydride was added to a final concentration of 2 mg/ml, and the solutions were incubated at 4°C for 2 h. The mixtures were then dialyzed against 0.01 M PBS for 3 days at room temperature with frequent changes of PBS solution (every 4–5 h) to remove uncoupled haptens. The success of conjugation was confirmed using polyacrylamide gel electrophoresis. The conjugates were then stored at −20°C. The same procedure was used to prepare the PR–GDA–OVA coating conjugate, with PR:OVA ratios of 90:1 and 120:1.
Edc coupling method
In this procedure, 20 mg of BSA dissolved in 2 ml of 0.1 M 2-(N-morpholino) ethanesulfonic acid (MES; pH 4.7) were activated with 4 mg of EDC and an equimolar amount of N-hydroxysuccinimide (NHS; 2.4 mg) dissolved in 2 ml of 0.05 M KH2PO4 (pH 8.6). The mixture was incubated with constant stirring for 2 h at room temperature. The activated protein solution was slowly added to different amounts of paromomycin (8.52, 25.57, or 31.96 mg) corresponding to different PR:BSA ratios (40:1, 120:1, or 150:1) dissolved in 2 ml of 0.05 M KH2PO4 (pH 8.6). The mixtures were allowed to equilibrate with constant stirring for 3 h at room temperature. The conjugates were dialyzed against 0.01 M PBS for 3 days with frequent changes of PBS solution (every 4–5 h) to remove uncoupled haptens. Successful conjugation was confirmed using polyacrylamide gel electrophoresis. The conjugates were then stored at −20°C. The same procedure was used to prepare PR–EDC–OVA coating conjugates, with PR:OVA ratios of 90:1 and 120:1.
Mouse immunization
Sterile 0.9% (w/v) sodium chloride (NaCl) was used to dilute the immunogens (PR–GDA–BSA and PR–EDC–BSA), which were then thoroughly mixed with an equal volume of FCA, and administered subcutaneously at multiple sites on the backs of female BALB/c mice (6–8 weeks of age).
The first dose consisted of 100 µl of the diluted immunogen emulsified with FCA. Four subsequent booster injections of 50 µl of immunogen, each emulsified with FIA, were administered at 21-day intervals. Seven days after the third booster, the mice were tail-bled. The blood samples (containing antisera) were screened for anti-paromomycin activity with an indirect competitive ELISA (idcELISA). The mouse with the greatest inhibition and highest titer was intraperitoneally administered a sixth injection and 4 days later, its spleen was removed and used for hybridoma production.
Cell fusion, screening, and purification of MAb
During hybridoma cell production, mouse spleen lymphocytes were fused with myeloma cells using polyethylene glycol (PEG) 1500 as the fusing agent. Seven days after cell fusion, the hybridoma cells were analyzed with ELISA for the presence of anti-paromomycin antibodies. Cell lines with high optical density (OD450 nm) values and significant paromomycin recognition activity were selected and subcloned five times at intervals of 6–7 days. The selected hybridoma cell lines were injected intraperitoneally into 10 mature female BALB/c mice to produce ascites fluid. The ascites fluid was harvested 7–14 days after injection, then purified with the caprylic acid–ammonium sulfate precipitation method (Kuang et al., Citation2013), dialyzed against PBS for 3 days, and stored at −20°C.
Elisa procedure
An idcELISA was used in this study with PR–EDC–OVA as the coating antigen. The concentration of the coating antigen and antiserum or MAb was optimized with the checkerboard method. Microtiter plates were coated with 100 μl/well PR–EDC–OVA and incubated overnight at 4°C. The plates were then washed three times with PBST and blocked with blocking buffer (200 μl/well). After incubation at 37°C for 2 h, the plates were washed twice, and 50 μl of standard solution was added to each well. Then 50 μl of either diluted antiserum or MAb solution was added to each well, and the plates were incubated for 30 min at 37°C. After the plates were washed three times, a secondary antibody (HRP-labeled goat anti-mouse IgG) diluted 1:3,000 with antibody dilution buffer was added (100 μl/well). The microtiter plates were incubated for 30 min and washed four times. Freshly prepared TMB substrate solution was added to the plates (100 μl/well) and allowed to react in the dark for 15 min at 37°C. Sulfuric acid (2 M) was used to stop the chromogenic reaction (50 μl/well). The optical density was measured at 450 nm (OD450) with a microplate reader. Competition curves were constructed by plotting OD450 against the logarithm of the analyte concentration. The software package OriginPro 8.5 (OriginLab Corporation, Northampton, MA, USA) was used to calculate the four-parameter sigmoidal curve equation:where A is the maximum absorbance in the absence of analyte, B is the curve slope at the inflection point, C is the concentration of the analyte resulting in 50% inhibition (IC50), and D is the minimum absorbance at infinite concentration. The IC50 value was used to evaluate the sensitivity of the ELISA.
Optimization of immunoassay conditions
The immunoassay was optimized in 0.01 M PBS by varying the pH range from 5.0 to 9.0 and the concentration (w/v) of sodium chloride from 0% to 3.2%.
Cross-reactivity determination
A standard paromomycin calibration curve (0.0–24.3 ng/ml) was generated under the optimized conditions. The limit of detection was determined from the paromomycin concentration that resulted in 50% inhibition. Several aminoglycosides, including kanamycin, streptomycin, neomycin, gentamicin, apramycin, amikacin, lincomycin, spectinomycin, and tobramycin, were analyzed for cross-reactivity (CR) using idcELISA. The CR values were calculated with the following equation:
Pretreatment and analysis of spiked food samples
Three food matrices (bovine milk, whole egg, and swine liver) were purchased from a local supermarket. The food samples were confirmed to be residue-free with high-performance liquid chromatography–tandem mass spectrometry (HPLC–MS/MS). Each sample was spiked with three different concentrations of paromomycin dissolved in 0.01 M PBS (pH 7.5). For cross-reactivity testing, corresponding food samples were also spiked separately with neomycin. The spiking and extraction of the food samples were performed as detailed below.
Bovine milk
Paromomycin sulfate (10,000 ng/ml in 0.01 M PBS [pH 7.5]) was added to milk samples at a final concentration of 100, 200, or 400 ng/ml in a total volume of 1 ml. To test the antibody cross-reactivity, neomycin sulfate was also added similarly to separate milk samples, to a final concentration of 200, 600, or 1000 ng/ml. The spiked milk samples were thoroughly mixed, placed on a shaker at room temperature for 30 min, and diluted 200-fold with 0.01 M PBS (pH 7.5). Aliquots (50 µl) of the diluted milk samples were transferred to a microtiter plate for analysis. Recovery was calculated based on the standard curve generated with idcELISA.
Whole egg
The egg white and yolk were thoroughly mixed in a blender and stored at −20°C. Paromomycin sulfate (10,000 ng/ml in 0.01 M PBS [pH 7.5]) was added to the egg samples to a final concentration of 200, 400, or 800 ng/ml in a total volume of 1 ml. For antibody cross-reactivity testing, neomycin sulfate was similarly added to other egg samples to a final concentration of 4000, 6000, or 8000 ng/ml. The spiked egg samples were thoroughly mixed in a vortex machine for 20 s and diluted 400-fold with 0.01 M PBS (pH 7.5). Aliquots (50 µl) of the diluted samples were transferred to a microtiter plate for analysis. Recovery was calculated based on the standard curve generated with idcELISA.
Swine liver
Swine liver samples were each cut into small pieces and blended to a paste-like homogenate. The homogenized tissue samples (1 g wet mass) were accurately weighed and transferred into polypropylene centrifuge tubes. Paromomycin sulfate (10,000 ng/ml in 0.01 M PBS) was added to the weighed liver samples (submerged in PBS) to a final concentration of 200, 500, or 1000 µg/kg in a total volume of 5 ml. For cross-reactivity testing, neomycin sulfate was similarly added to separate liver samples to a final concentration of 500, 1000, or 2000 µg/kg. The mixtures were vortexed for 30 s, placed on a shaker at room temperature for 30 min, and centrifuged at 3000 ×g for 12 min at room temperature. The supernatants were diluted 100-fold with 0.01 M PBS (pH 7.5). Aliquots (50 µl) of the diluted samples were transferred to a microtiter plate for analysis. Recovery was calculated based on the standard curve generated with idcELISA.
Recovery analysis
Interassay variability was determined from triplicate spiked food samples analyzed three times on nine different days. Intra-assay variability was determined from triplicate spiked food samples, repeatedly analyzed six times on a single day. Recovery data and precision are expressed as the coefficient of variation (CV), calculated with the following formula:
One-step strip preparation and test procedure
Preparation of colloidal gold particles
A lateral flow strip was constructed according to the method reported by Luo et al. (Citation2014). Briefly, all solvents were prepared with doubly distilled water and passed through a 0.22-µm membrane. Chlorauric acid solution (0.1 M, 50 ml) was heated to boiling with constant stirring at 100×g and mixed with 2 ml of 1% (w/v) trisodium citrate solution for 6 min. Once the solution turned wine red, it was allowed to cool at room temperature and was stored at 4°C. A transmission electron microscopy analysis showed that the gold nanoparticles had a nearly uniform particle size of 30 nm. The UV–visible spectrum showed a maximum absorbance peak at 530 nm.
Preparation of colloidal gold-labeled antibodies
The colloidal gold solution used for conjugation (10 ml) was adjusted to pH 7.0 with 0.1 M K2CO3. The MAb (1 ml) was added dropwise to the solution, and after 50 min, 1 ml of 0.5% (w/v) casein was added and mixed for 2 h. The products were centrifuged at 7000 × g for 50 min to remove the gold aggregates. The red supernatant was further centrifuged at 7000 × g for 50 min. The resulting lower phase (red gold-labeled MAb) was washed with 0.02 M phosphate buffer containing 5% sucrose, 1% BSA, and 0.5% PEG 6000 (pH 7.4) and purged three times to remove unlabeled MAb. The conjugation products were reconstituted to 1 ml with 0.02 M phosphate buffer containing 0.02% sodium nitrite (NaN3), and stored at 4°C.
Selection of coating antigen for strip assembly
Four different coating antigens (PR–GDA–OVA, PR–EDC–OVA, PR–EDC–BSA, and PR–GDA–BSA), each at a concentration of 0.5 mg/ml, were used to construct the test strip. Gold nanoparticles (1 ml) were diluted with 4 µl of K2CO3 and mixed with 8 µg/ml antibody 2C4. To prepare the zero standard, 7 μl of gold nanoparticles was mixed with 43 μl of PBST, and an aliquot (50 μl) was mixed with 150 μl of PBS.
Preparation of nitrocellulose capture membranes
The coating antigen (PR–GDA–BSA) and goat anti-mouse IgG antibody were used as the capture reagents in the control line. The coating antigen mixed with the MAb or goat anti-mouse IgG antibody coating was sprayed onto the nitrocellulose membrane at 1 μl/cm to generate the test line or control line on the strip, respectively. The membrane was dried at 37°C for 30 min and stored at room temperature. The capture reagent was sprayed onto a glass fiber membrane to prepare the conjugate pad, which was dried at 37°C for 2 h. The nitrocellulose membrane coated with capture reagents was pasted onto the center of the PVC plastic backing plate, and the conjugate pad (glass fiber), sample pad, and absorbent pad were sequentially attached to the backing plate. Finally, the plate was cut into 3-mm wide strips with a strip cutter.
Strip test detection of paromomycin and neomycin in 0.01 m PBS
The test line contained 1 ml of gold nanoparticles with 4 μl of potassium carbonate (K2CO3) and 8 μg/ml antibody 2C4. The coating concentration used was 0.5 mg/ml. To prepare the zero standard, 7 μl of gold nanoparticles was mixed with 43 μl of PBST, and a 50 μl aliquot was mixed with 150 μl of PBS. The same procedure was used to determine neomycin cross-reactivity.
Strip test detection of apramycin and neomycin in spiked food samples
The capture test line was constructed by mixing 1 ml of gold nanoparticles with 4 μl of K2CO3 and 8 μg/ml antibody 2C4. The coating concentration used was 0.5 mg/ml. To prepare the zero standard, 7 μl of gold nanoparticles was mixed with 43 μl of PBST, and a 50 μl aliquot was mixed with 150 μl of food sample.
Results and discussion
Immunogen and coating antigen preparation
Like most drugs, toxins, and synthetic hormones, paromomycin has a low molecular weight (<5,000 Da). Therefore, it does not directly induce an antibody response, and consequently lacks immunogenicity (Isanga et al., Citation2016). Therefore, to make it immunogenic, paromomycin must be conjugated with a bigger molecule via one of its functional groups. The chemical structure of paromomycin ((a)) has eight hydroxyl and five amino groups that can be utilized to link the paromomycin molecule to macromolecules such as proteins and carbohydrates.
Figure 2. (a) Paromomycin chemical structure. Any of its five amino groups and eight hydroxyl groups can be used to link the PR molecule to a protein or carbohydrate carrier. (b) Polyacrylamide gel electrophoresis image of paromomycin-BSA conjugates. 1- BSA standard, 2- PR-GDA-BSA/150:1, 3- PR-GDA-BSA/120:10:1, 4- PR-GDA-BSA/40:1.
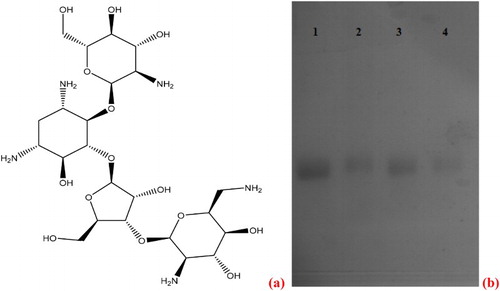
Paromomycin was conjugated to the carrier protein (BSA or OVA) using GDA or EDC. In theory, any of the five amino groups in the paromomycin chemical structure ((a)) can be linked to the carrier protein (Isanga et al., Citation2016; Xu et al., Citation2014). The BSA carrier protein was used in the two methods used to synthesize the immunogens (PR–GDA–BSA and PR–EDC–BSA), whereas OVA was used to synthesize the coating antigens (PR–GDA–OVA and PR–EDC–OVA).
Since paromomycin does not show any significant peaks within the UV range of 190-1100 nm, polyacrylamide gel electrophoresis was used to confirm the success of conjugation as shown in (b). All the 3 ratios tested showed successful conjugation of paromomycin to BSA protein as indicated in the migration of bands 2, 3, and 4 which lagged behind band 1 of the BSA standard. However from (b), the ratios 40:1 and 150:1 showed better conjugation than ratio 120:1.
The experimental design involved the use of both homologous and heterologous coating antigens to determine the titer and inhibition level of the antiserum. After checkerboard titration experiments with the serum (results not shown), the best mouse (immunized with PR–GDA–BSA) showed a good optical density and inhibition ≥ 50% at the standard concentration of 2 ng/ml when tested on the heterologous coating antigen PR–EDC–OVA, and was selected for cell fusion.
Antibody production and selection
During hybridoma screening with idcELISA, five wells of the culture supernatant were found to contain a paromomycin-specific antibody. After five cycles of subcloning (results not shown) and the intraperitoneal injection of the hybridoma cells into mice, the ascites fluid was collected and purified. The MAb secreted by the hybridoma in well 2C4 was most sensitive, with an IC50 of 0.65 ng/ml. Therefore, MAb 2C4 was selected for further study. Both homologous and heterologous coating antigens were used to further evaluate the performance of MAb 2C4, but none performed better than the heterologous coating antigen PR–EDC–OVA in terms of sensitivity and affinity. This observation is consistent with our recent study (Isanga et al., Citation2016) and previous findings, where it was reported that assay sensitivity may be improved using a heterologous coating antigen (Xu et al., Citation2011; Yan, Liu, Xu, Kuang, & Xu, Citation2015). In earlier studies (Chen, Shang, Wu, Qi, & Xiao, Citation2007), this improvement was attributed to the fact that hapten heterology eliminates the strong affinity of antibodies for spacer arms or cross-linking sites.
Optimization of immunoassay conditions
The antibody was evaluated based on the IC50 and the maximum absorbance (Amax) at 450 nm. After preliminary checkerboard titration experiments (results not shown), the optimum concentrations of coating antigen (PR–EDC–OVA) and antibody (2C4) were determined to be 0.8 and 0.6 μg/ml, respectively. The effects of pH and salt concentration on antibody performance were then assessed because, as observed in previous studies (Isanga et al., Citation2016; Tochi et al., Citation2015), these two factors vary in different foods and contribute to matrix interference. The interaction between paromomycin and the antibody is also readily affected by assay pH and ionic strength because the drug is water soluble and has many hydroxyl and amino groups in its chemical structure, as shown in (a). Furthermore, like any other protein, the isoelectric point of the antibody is affected by variations in pH, making pH an important factor in assay performance (Yu et al., Citation2016).
The variation in the assay pH (5, 6, 7, 7.5, 8, and 9) did not significantly affect Amax values and there was no clear correlation between pH and Amax, as shown in (a). This observation is similar to those of previous studies (Suryoprabowo, Liu, Peng, Kuang, & Xu, Citation2014; Xu et al., Citation2011). However, pH significantly affected the IC50 value ((a)). In a pH range of 5–7.5, IC50 decreased with increasing pH, but started to increase in the pH range 7.5–9, as shown in (a). This observation is consistent with our recent study (Isanga et al., Citation2016). Therefore, an assay pH of 7.5 was selected as optimal and used for subsequent ELISAs because it gave the lowest IC50 and a good Amax value (within an adequate range of 1.5–2.0).
Figure 3. Effect of (a) pH Variation and (b) Salt Concentration on Amax and IC50 Values. (c) Paromomycin and neomycin standard curves under optimized conditions. n = 7.
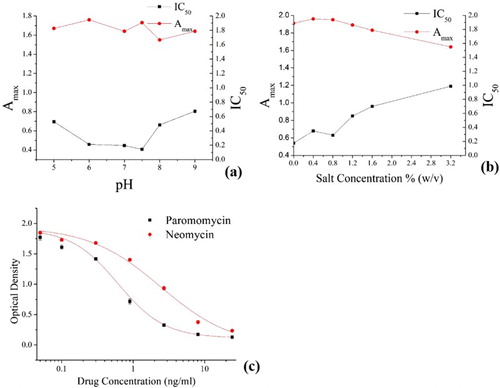
Within a range of salt (NaCl) concentrations of 0.0–1.6% (w/v), the salt concentration had no significant effect on the Amax values ((b)). Although there was a slight gradual decline in Amax with salt concentrations in the range of 0.8–3.2% (w/v), the Amax values remained within the adequate range of 1.5–2.0, as shown in (b). Therefore, the salt concentration generally had no significant effect on Amax.
However, the salt concentration had a significant effect on IC50. The IC50 values were lower (0.54–0.68 ng/ml) within the low salt concentration range of 0.0–0.8% (w/v), but within the higher concentration range of 1.2–3.2% (w/v), the IC50 values increased (0.85–1.19 ng/ml) as the salt concentration increased, as shown in (b). Although the assay with no salt gave the lowest IC50 of 0.54 ng/ml, the assay with 0.8% (w/v) salt was selected as optimal because it had the lowest IC50 (0.63 ng/ml) among the assays that contained some salt and the antibody was to be applied to food in which salt is a common component.
Cross-reactivity determination
When tested under the optimized conditions, the MAb detected paromomycin (100%) and neomycin (25.1%), but showed negligible or no affinity for the other drug analogues tested ().
Table 1. Cross-reactivity of paromomycin MAb with different aminoglycosides.
The cross-reactivity of the anti-paromomycin MAb to neomycin can be attributed to the close structural similarity between neomycin and paromomycin, in which the only major difference is the 6′-amino group in neomycin and the 6′-hydroxyl group in paromomycin, as illustrated in . Both paromomycin and neomycin also have three amino sugars linked by glycosidic bonds to the hexose nucleus, unlike other aminoglycosides, where only two amino sugars are linked to the nucleus (Jin, Jang, Lee, & Han, Citation2006; Wang, Xu, Zhang, & He, Citation2009), as shown in . This structural difference explains the negligible cross-reactivity of the anti-paromomycin MAb to the other aminoglycosides tested.
The observation and confirmation of the cross-reactivity of the MAb with neomycin was considered when designing all further experiments involving the anti-paromomycin MAb. Standard calibration curves were generated with the Origin Pro 8.5 software ((c)). The MAb IC50 for paromomycin was 0.61 ng/ml, whereas it was 2.43 ng/ml for neomycin.
Recovery analysis from spiked food matrices
Three different concentrations of paromomycin and neomycin were used to separately spike different samples of bovine milk, whole egg, and swine liver. The average intra- and interassay recoveries were determined, and are shown in . The intra-assay recoveries were in the ranges of 67.8–102.35% for paromomycin and 54.08–100.55% for neomycin (). The interassay recoveries were in the ranges of 64.56–105.85% for paromomycin and 55.43–98.27% for neomycin (). Generally, the intra-assay coefficients of variation were 1.12–5.08%, whereas the interassay coefficients of variation were 1.22–3.94% (), illustrating the sensitivity and stability of the assay. The observed ranges of the recoveries and the coefficients of variation show that the method of extraction and the dilution ratios used were adequate to minimize the effect of matrix interference on assay performance.
Table 2. Paromomycin and neomycin recovery from different spiked food samples.
Strip test procedure and principle
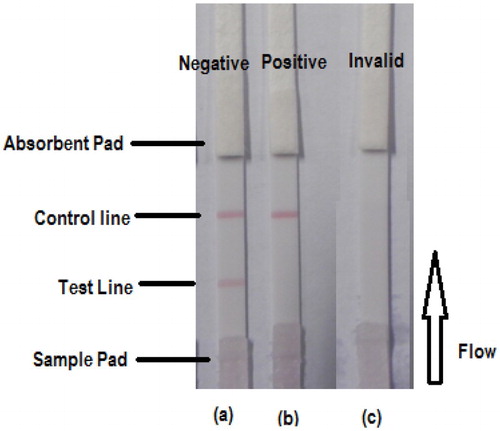
The principle of the strip test and the procedure used in this study were similar to those used in previous studies (Gu et al., Citation2016; Isanga et al., Citation2016; Peng et al., Citation2016). Briefly, 50 μl of sample was added to the conjugate layer containing a colloidal-gold-labeled antibody. The solution flowed in the direction of the absorbent pad under capillary action (). Because the test line was already impregnated with the PR–GDA–BSA coating antigen, the presence of paromomycin in the sample competed for the finite amount of anti-paromomycin MAb. Therefore, the higher the concentration of paromomycin in the sample, the weaker the color of the test line. When a sufficient amount of paromomycin was present, the free paromomycin bound to all the labeled MAb, preventing any binding to the coating antigen (PR–GDA–BSA) on the test line, as shown in (b). When paromomycin was absent from the sample, the limited amount of colloidal-gold-labeled MAb was trapped by the immobilized coating antigen (PR–GDA–BSA), which in turn created a clearly visible red test line, as shown in (a). For the strip to work well, the flow must reach the control line that is impregnated with anti-mouse IgG antibody. When only the control line appears, the result is positive, whereas the appearance of both the control line and the test line indicates a negative result ().
Figure 4. Illustration of typical strip test results. (a) When both the control and test line appear, the test is negative. (b) A test is positive if only the control line appears but without the test line. (c) The test is invalid either when only the test line appears without the control line or if both test line and control lines do not appear.
Selection of the strip coating antigen
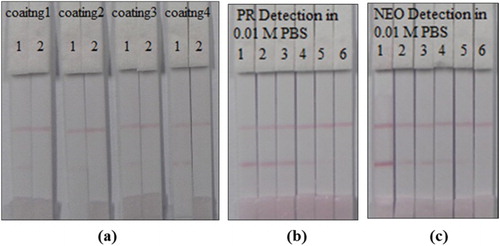
As shown in (a), four coating antigens (PR–GDA–OVA, PR–EDC–OVA, PR–EDC–BSA, and PR–GDA–BSA), each at a fixed concentration of 0.5 mg/ml, were initially tested. Coating antigen PR–GDA–BSA was selected for further experiments because it showed greater and more distinct color intensity in the test line than the other antigens, and the results were obtained within 5 min.
Figure 5. (a) Selection of a coating antigen for use in strip construction. Four coating antigens were tested; 1 = PR-GDA-OVA, 2 = PR-EDC-OVA, 3 = PR-EDC-BSA and 4 = PR-GDA-BSA each with a fixed concentration of 0.5 mg/ml. Two paromomycin concentrations (1 = 0 ng/ml and 2 = 5 ng/ml) were used for negative and positive testing, respectively. (b) Test strip detection of different paromomycin concentrations prepared in 0.01 M PBS; 1 = 0 ng/ml, 2 = 0.1 ng/ml, 3 = 0.25 ng/ml, 4 = 0.5 ng/ml, 5 = 1 ng/ml, and 6 = 2.5 ng/ml ng/ml. (c) Cross-reactivity strip test detection of various neomycin concentrations prepared in 0.01 M PBS; 1 = 0 ng/ml, 2 = 0.5 ng/ml, 3 = 1.0 ng/ml, 4 = 2.5 ng/ml, 5 = 5.0 ng/ml, and 6 = 10 ng/ml ng/ml.
Strip detection of paromomycin and neomycin in 0.01 m PBS
Various concentrations of paromomycin (0, 0.1, 0.25, 0.5, 1.0, or 2.5 ng/ml) were prepared in 0.01 M PBS and then analyzed with the strip test. As shown in (b), the visual limit of detection was 2.5 ng/ml and the results were obtained within 5 min.
For cross-reactivity testing, different neomycin concentrations (0, 0.5, 1.0, 2.5, 5.0, or 10 ng/ml) were prepared in 0.01 M PBS and analyzed with the strip test. The results were obtained within 5 min and the visual limit of detection was 10 ng/ml, as shown in (c).
Strip detection of paromomycin and neomycin in spiked food samples
Bovine milk and whole egg samples spiked with different concentrations of paromomycin (0, 0.5, 1.0, 2.5, or 5 ng/ml) were analyzed with the test strip, as shown in (a,b). The visual limit of detection was 2.5 ng/ml for both bovine milk and whole egg. There are no established MRLs for milk and eggs, but paromomycin is prohibited for use in animals that produce milk or eggs for human consumption (Bories et al., Citation2009; Hafez et al., Citation2010). Therefore, our visual detection limit of 2.5 ng/ml in milk and eggs is sufficient for the detection of paromomycin drug residues in these food matrices.
Figure 6. Strip test detection of different paromomycin and neomycin concentrations in spiked food samples. For (a) and (b); 1 = 0 ng/ml, 2 = 0.5 ng/ml, 3 = 1.0 ng/ml, 4 = 2.5 ng/ml and 5 = 5.0 ng/ml. (c); 1 = 0 µg/kg, 2 = 1.0 µg/kg, 3 = 2.5 µg/kg, 4 = 5.0 µg/kg, 5 = 10 µg/kg, 6 = 20 µg/kg, and 7 = 30 µg/kg. For (d), (e) and (f); 1 = 0 ng/ml, 2 = 2.0 ng/ml, 3 = 5.0 ng/ml, 4 = 10 ng/ml, 5 = 20 ng/ml and 6 = 30 ng/ml.
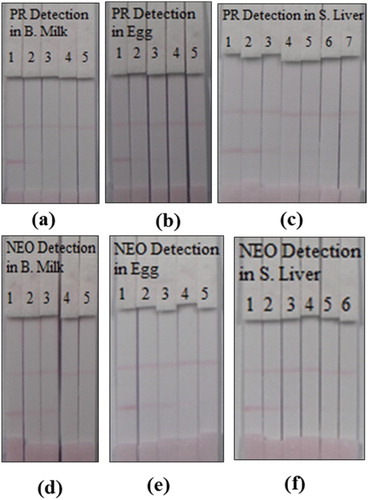
The samples of swine liver were spiked with paromomycin concentrations of 0, 1.0, 2.5, 5.0, 10, 20, or 30 µg/kg and then analyzed with the test strip, as shown in (c). The visual limit of detection for paromomycin was 20 µg/kg in swine liver. This value is far below the paromomycin MRL of 1500 µg/kg recommended by the European Union Food Safety Authority (Bories et al., Citation2009). Therefore, the strip test developed here detects the current MRLs for paromomycin and is suitable for screening food matrices for residues of the drug.
To test the cross-reactivity of the MAb, these food matrices were separately spiked with various concentrations of neomycin (0, 2.0, 5.0, 10, 20, or 30 ng/ml) and then analyzed with the test strip, as shown in (d–f). The visual limit of detection for both bovine milk and whole egg was 20 ng/ml, whereas that for swine liver was 30 µg/kg. All the strip test results were obtained within 5 min.
Our visual detection limits of 30 µg/kg in swine liver and 20 ng/ml in bovine milk and whole egg are far below the neomycin MRLs of 500 (liver), 1500 (milk), and 500 ng/ml (egg) established by both the European Union (EU, Citation2013) and Health Canada (Aglukkaq, Citation2015). Therefore, our strip test is sufficiently sensitive to detect the current neomycin MRLs and can be used effectively to screen food matrices for residues of both neomycin and paromomycin.
Conclusion
The MAb assay developed in this study detects paromomycin and is also significantly cross-reactive with neomycin, but is insensitive to other aminoglycoside analogues. When tested under the optimized assay conditions in 0.01 M PBS, the MAb IC50 was 0.61 ng/ml for paromomycin and 2.43 ng/ml for neomycin, and the ELISA results were obtained within 90 min. The observed mean recoveries and coefficients of variation for both paromomycin and neomycin were within acceptable ranges and confirmed that the methods of spiking and extraction adequately minimized the effects of matrix interference on the assay sensitivity. The strip test results for different food matrices were obtained with 5 min, with visual detection limits of 2.5–20 ng/ml (µg/kg) for paromomycin and 10–30 ng/ml for neomycin, which are far below the established MRLs. Therefore, the immunoassay and strip test developed in this study can be used effectively to routinely screen for both paromomycin and neomycin drug residues in various food matrices.
Disclosure statement
No potential conflict of interest was reported by the authors.
Notes on contributors
Joel Isanga was born in Uganda and began to study as a Ph.D. student in the School of Food Science and Technology of Jiangnan University in 2013. His research interests are monoclonal antibody development and applications.
Daniel Mukunzi was born in Rwanda and began to study as a Ph.D. student in the School of Food Science and Technology of Jiangnan University in 2012. His research interests are immunoassays development for agonists.
Yanni Chen obtained his bachelor’s degree from Liaoning Medical University, Jinzhou, China, in 2012 and then she began to study in Jiangnan University (Wuxi, China) as a Ph.D. student in Food Science. Her research interests are immunoassay applications in food.
Steven Suryoprabowo was born in Indonesia and obtained his bachelor’s degree from Pelita Harapan University (Indonesia); then he obtained his master’s degree in Food Science (2014) from Jiangnan University, Wuxi, China. His research interests are monoclonal antibodies development and immunochromatographic strip test and applications.
Liqiang Liu obtained his Ph.D. in Food Science in 2014 from Jiangnan University, Wuxi, China and then became a faculty in the College of Food Science and Technology of Jiangnan University. His research interests are immunochromatographic strip design and application.
Hua Kuang obtained her Ph.D. from China Agricultural University in 2009 and then began to work as a faculty in the College of Food Science and Technology of Jiangnan University. She is currently a full professor in Food Safety. Her research interests are biosensor development.
Chuanlai Xu is a full professor of Food Science and Technology of Jiangnan University. He obtained his Ph.D. in Food Science in 2002. His research interests are fast detection technology and food safety evaluation.
Additional information
Funding
References
- Aglukkaq, L. (2015). Marketing authorization for maximum residue limits for veterinary drugs in foods. Ottawa: Health Products and Food Branch, Health Canada. Retrieved from http://www.hc-sc.gc.ca/dhp-mps/vet/mrl-lmr/mrl-lmr_versus_new-nouveau-eng.php
- Armstrong, E. S., Kostrub, C. F., Cass, R. T., Moser, H. E., Serio, A. W., & Miller, G. H. (2012). Aminoglycosides. In T. J. Dougherty, & M. J. Pucci (Eds.), Antibiotic discovery and development (pp. 229–269). New York, NY: Springer Science+Business Media, LLC. doi:10.1007/978-1-4614-1400-1.
- Bavarsad, N., Bazzaz, B. S. F., Khamesipour, A., & Jaafari, M. R. (2012). Colloidal, in vitro and in vivo anti-leishmanial properties of transfersomes containing paromomycin sulfate in susceptible BALB/c mice. Acta Tropica, 124, 33–41. doi: 10.1016/j.actatropica.2012.06.004
- Bories, G., Brantom, P., Brufau de Barberà, J., Chesson, A., Cocconcelli, P. S., Debski, B., … Wester, P. (2009). Preliminary evaluation of the safety and efficacy of paromomycin sulphate for turkeys for fattening and turkeys reared for breeding. The European Food Safety Authority Journal, 1095, 1–22.
- Burkin, M., & Galvidis, I. (2013). Immunochemical detection of apramycin as a contaminant in tissues of edible animals. Food Control, 34(2), 408–413. doi: 10.1016/j.foodcont.2013.05.001
- Chen, Y.-Q., Shang, Y.-H., Wu, X.-P., Qi, Y.-T., & Xiao, X.-L. (2007). Enzyme-linked immunosorbent assay for the detection of neomycin in milk: Effect of hapten heterology on assay sensitivity. Food and Agricultural Immunology, 18(2), 117–128. doi: 10.1080/09540100701579829
- EMA/CVMP. (1996). Committee for veterinary medicinal products (CVMP): Aminosidine. Summary report (1). In CVMP (Ed.), European Medicines Agency (EMA) (pp. 1–5). London: European Union.
- EMA/CVMP. (2000). Committee for veterinary medicinal products (CVMP): Paromomycin. Summary report (2). In CVMP (Ed.), European Medicines Agency (EMA) (pp. 1–6). London: European Union.
- EMA/CVMP. (2002). Committee for veterinary medicinal products (CVMP): Paromomycin. Summary report (3). In CVMP (Ed.), European Medicines Agency (EMA) (pp. 1–2). London: European Union.
- EU. (2013). European public MRL assessment report (EPMAR) for neomycin (including framycetin). In Commission implementing regulation (EU) No 1056, O.J. L 288 (Vol. 1056, pp. 1–13). London: European Medicines Agency.
- Faten, F., Azzazy, H. M. E., & Niessen, W. M. A. (2015). Challenges in the determination of aminoglycoside antibiotics, a review. Analytica Chimica Acta, 890, 21–43. doi: 10.1016/j.aca.2015.06.038
- Gu, H., Liu, L., Song, S., Kuang, H., & Xu, C. (2016). Development of an immunochromatographic strip assay for ractopamine detection using an ultrasensitive monoclonal antibody. Food and Agricultural Immunology, 27(4), 471–483. doi: 10.1080/09540105.2015.1126808
- Hafez, M., Hauck, R., Gad, W., De Gussem, K., & Lotfi, A. (2010). Pilot study on the efficacy of paromomycin as a histomonostatic feed additive in Turkey poults experimentally infected with histomonas meleagridis. Archives of Animal Nutrition, 64(1), 77–84. doi: 10.1080/17450390903478851
- Hermann, T., & Westhof, E. (1999). Docking of cationic antibiotics to negatively charged pockets in RNA folds. Journal of Medicinal Chemistry, 42(7), 1250–1261. doi: 10.1021/jm981108g
- Isanga, J., Tochi, B. N., Mukunzi, D., Chen, Y., Liu, L., Kuang, H., & Xu, C. (2016). Development of a specific monoclonal antibody assay and a rapid testing strip for the detection of apramycin residues in food samples. Food and Agricultural Immunology, 10.1080/09540105.2016.1202211, 1–18.
- Jin, Y., Jang, J.-W., Lee, M.-H., & Han, C.-H. (2006). Development of ELISA and immunochromatographic assay for the detection of neomycin. Clinica Chimica Acta, 364, 260–266. doi: 10.1016/j.cca.2005.07.024
- Kuang, H., Xing, C., Hao, C., Liu, L., Wang, L., & Xu, C. (2013). Rapid and highly sensitive detection of lead ions in drinking water based on a strip immunosensor. Sensors, 13(16), 4214–4224. doi: 10.3390/s130404214
- Kumar, P., Rubies, A., Companyo, R., & Centrich, F. (2012). Determination of aminoglycoside residues in kidney and honey samples by hydrophilic interaction chromatography-tandem mass spectrometry. Journal of Separation Science, 35, 2710–2717. doi: 10.1002/jssc.201200344
- Li, A., Tang, L., Song, D., Song, S., Ma, W., Xu, L., … Xu, C. (2016). A SERS-active sensor based on heterogeneous gold nanostar core–silver nanoparticle satellite assemblies for ultrasensitive detection of aflatoxinB1. Nanoscale, 8, 1873–1878. doi: 10.1039/C5NR08372A
- Lourenco, F. R., Barbosa, E. A., & Pinto, T. J. A. (2011). Microbiological assay for apramycin soluble powder. Latin American Journal of Pharmacy, 30, 554–557.
- Luo, L., Suryoprabowo, S., Liu, L., Peng, J., Kuang, H., & Xu, C. (2014). Development of an immunochromatographic strip test for rapid detection of ciprofloxacin in milk samples. Sensors, 14, 16785–16798. doi: 10.3390/s140916785
- Peng, S., Song, S., Liu, L., Kuang, H., & Xu, C. (2016). Rapid enzyme-linked immunosorbent assay and immunochromatographic strip for detecting ribavirin in chicken muscles. Food and Agricultural Immunology, 27(4), 449–459. doi: 10.1080/09540105.2015.1104657
- Pujol-Brugués, A., Calpena-Campmany, A. C., Riera-Lizandra, C., Halbaut-Bellowa, L., & Clares-Naveros, B. (2014). Development of a liquid chromatographic method for the quantification of paromomycin. Application to in vitro release and ex vivo permeation studies. Spectrochimica Acta Part A: Molecular and Biomolecular Spectroscopy, 133, 657–662. doi: 10.1016/j.saa.2014.06.017
- Suryoprabowo, S., Liu, L. Q., Peng, J., Kuang, H., & Xu, C. L. (2014). Development of a broad specific monoclonal antibody for fluoroquinolone analysis. Food Analytical Methods, 7(10), 2163–2168. doi: 10.1007/s12161-014-9863-1
- Tian, Y.-F., Chen, G.-H., Guo, L.-H., Guo, X., & Mei, X.-Y. (2015). Methodology studies on detection of aminoglycoside residues. Food Analytical Methods, 8, 1842–1857. doi: 10.1007/s12161-014-0067-5
- Tochi, B. N., Khaemba, G., Isanga, J., Mukunzi, D., Liu, L., Peng, J., … Xu, C. (2015). Monoclonal antibody for the development of specific immunoassays to detect enrofloxacin in foods of animal origin. Food and Agricultural Immunology, 27(4), 435–448. doi: 10.1080/09540105.2015.1089844
- Wang, S., Xu, S., Zhang, Y., & He, J. X. (2009). Development of enzyme-linked immunosorbent assay (ELISA) for the detection of neomycin residues in pig muscle, chicken muscle, egg, fish, milk and kidney. Meat Science, 82, 53–58. doi: 10.1016/j.meatsci.2008.12.003
- Wang, Z., Zou, S., Xing, C., Song, S., Liu, L., & Xu, C. (2016). Preparation of a monoclonal antibody against testosterone and its use in development of an immunochromatographic assay. Food and Agricultural Immunology, 27(4), 547–558. doi: 10.1080/09540105.2015.1137276
- Xu, F., Jiang, W., Zhou, J., Wen, K., Wang, Z., Jiang, H., & Ding, S. (2014). Production of monoclonal antibody and development of a new immunoassay for apramycin in food. Journal of Agricultural and Food Chemistry, 62(14), 3108–3113. doi: 10.1021/jf405379r
- Xu, N., Qu, C., Ma, W., Xu, L., Liu, L., Kuang, H., & Xu, C. (2011). Development and application of one-step ELISA for the detection of neomycin in milk. Food and Agricultural Immunology, 22(3), 259–269. doi: 10.1080/09540105.2011.569882
- Yan, H., Liu, L., Xu, N., Kuang, H., & Xu, C. (2015). Development of an immunoassay for carben-dazim based on a class-selective monoclonal antibody. Food and Agricultural Immunology, 26(5), 659–670. doi: 10.1080/09540105.2015.1007446
- Yu, L., Liu, L., Song, S., Kuang, H., & Xu, C. (2016). Development of an immunochromatographic test strip and ic-ELISA for tetrabromobisphenol: A detection in lake water and rice pudding samples. Food and Agricultural Immunology, 27(4), 460–470. doi: 10.1080/09540105.2015.1126234