
ABSTRACT
3-amino-2-oxazolidinone (AOZ) is the metabolite of furazolidone, which has been banned as a veterinary drug due to the potential harmful effects on human health. In this study, a novel immunochromatography test strip (ICTS) based on colloidal gold–McAb probe for detection of AOZ within tissue samples was developed. With this method, the visual cut-off levels for the test strip was achieved at 10 μg/L. Using a test strip reader, the 50% inhibition was 1.3 μg/L. The limit of detection and limit of quantification in four kinds of animal tissues were 0.15 μg/kg and 0.31 μg/kg, respectively. When used to analyze fortified samples of animal tissue, acceptable recovery rates of 76.3–98.4% were obtained. The fortified samples were detected by ICTS and confirmed by LC-MS/MS. The results of the two methods were in good agreement. The proposed ICTS was demonstrated to be a rapid and simple analytical method for detecting AOZ in animal tissue.
Introduction
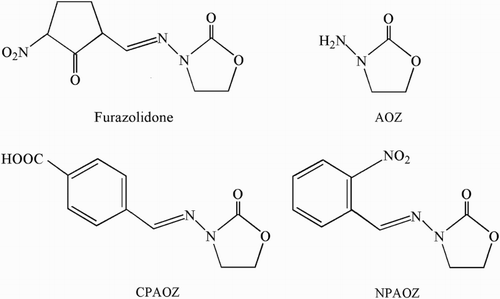
Furazolidone [N-(5-nitro-2-furfurylidene-3-amino)-2-oxazolidinone], furaltadone, nitrofurazone and nitrofurantoin are antibiotics of the nitrofuran family with a group of broad-spectrum antibiotics for treatment of gastrointestinal and dermatological infections and as growth promoters and feed additives in animal husbandry (Barbosa et al., Citation2011). Since various experimental animal studies have shown that their residues have potential carcinogenicity and mutagenicity, all nitrofurans are prevented from being used in food-producing animals since 1995 (Li et al., Citation2015). As a consequence, nitrofurans have been banned as veterinary drugs in food-producing animals in China, EU, United States and other countries (Auro, Sumano, Ocampo, & Barragan, Citation2004; European Commission, Citation2005; Khong et al., Citation2004). The EU set the minimum required performance limits (MRPLs) to be 1 μg/kg for each nitrofuran metabolite in food of animal origin (European Commission, Citation2003). Nitrofurans are rapidly metabolized into tissue-bound metabolites, which causes them to disappear rapidly from blood, so that no parent drug can be detected in edible tissues over 12 h after administration. Therefore, the analytical detection of furazolidone, furaltadone, nitrofurazone and nitrofurantoin can be monitored through the measurement of their metabolites, 3-amino-2-oxazolidinone (AOZ), 3-amino-5-morpolinomethyl-2-oxazolidone (AMOZ), semicarbazide (SEM) and1-amino-hydantoin (AHD), respectively (Auro et al., Citation2004; Cooper & Kennedy, Citation2005). The chemical structures of furazolidone, its metabolite AOZ and other derivatives are shown in . As AOZ is covalently bound to proteins, the analysis usually entails releasing of the metabolite from the tissues under acidic conditions and a derivatization step with o-nitrobenzaldehyde (o-NBA) to form a nitrophenyl derivative (NPAOZ) prior to detection.
Figure 1. The molecular structures of furazolidone, AOZ, CPAOZ and NPAOZ.
Many methods for the detection of AOZ have been developed, such as high-performance liquid chromatography with ultraviolet (Hu, Xu, & Yediler, Citation2007) and liquid chromatography-tandem mass spectrometry (LC-MS/MS) (Hu et al., Citation2007; Valera-Tarifa, Plaza-Bolaños, Romero-González, Martínez-Vidal, & Garrido-Frenich, Citation2013; Wilasinee, Sutthivaiyakit, & Sutthivaiyakit, Citation2015; Zhang, Qiao, Chen, Wang, & Xia, Citation2016), high-performance liquid chromatography diode array detection (Fernando, Munasinghe, Gunasena, & Abeynayake, Citation2017) and enzyme-linked immunosorbent assays (Chang, Peng, Wu, Wang, & Yuan, Citation2008; Cheng et al., Citation2009; Cooper, Caddell, Elliott, & Kennedy, Citation2004; Diblikova, Cooper, Kennedy, & Franek, Citation2005; Franek et al., Citation2006; Jester, Abraham, Wang, EI Said, & Plakas, Citation2014; Le & Yu, Citation2015; Liu et al., Citation2010; Vass et al., Citation2005; Zhu et al., Citation2010). These analytical methods have many advantages of quantitative nature, precision and accuracy; however, they are time-consuming, expensive and unsuitable for analysis of large number of samples and also require expensive equipment and the procedure involves multiple steps. Therefore, the development of a simple, rapid and low-cost analytical technique was urgently in need.
Compared to other methods, the immunochromatographic test strip (ICTS) presents additional advantages: simplicity, speed, low cost and no requirement for skilled technicians or expensive equipment (Le et al., Citation2011; Le, Xie, Zhu, & Zhang, Citation2016). Recently, several reports on colloidal gold-based ICTS methods have been published for the detection of AMOZ (Li et al., Citation2015), SEM (Tang, Xu, Wang, Xiang, & Yang, Citation2011; Yin, Liu, Song, Kuang, & Xu, Citation2015) and AHD (Tang, Xu, Liu, et al., Citation2011; Xu et al., Citation2009), but there have been no reports of colloidal gold-based ICTS method being used to measure AOZ in animal tissues. Based on the monoclonal antibody (McAb) against AOZ’s derivates (NPAOZ) produced in our lab (Le & Yu, Citation2015), the aim of this study was to develop a rapid ICTS using colloidal gold-antibody probe for quantitative and sensitive detection of AOZ in animal tissues. Experimental results demonstrate that ICTS displayed the properties of high sensitivity, specificity, accuracy, precision and stability for AOZ detection.
Materials and methods
Materials and reagents
Furazolidone, AOZ, 3-[[(2-nitrophenyl)-methylene]-amino]-2-oxazolidinone (NPAOZ) and 2-nitrobenzaldehyde were purchased from WITEGA Laboratorien (Berlin, Germany). N,N-Dimethylformamide, Tween 20, ethyl acetate and methanol were obtained from Sinopharm Chemical Reagent Co. Ltd (Beijing, China). Goat anti-mouse IgG antibodies were obtained from Jackson ImmunoResearch Laboratories (West Grove, PA, USA). Nitrocellulose membranes, glass fibers, sample pads and absorbent pads were purchased from Millipore Corporation (Billerica, MA, USA). Gold chloride was provided by Sigma Company (St. Louis, MO, USA). Artificial antigen of CPAOZ-Bovine serum albumin (CPAOZ-BSA) conjugates, purifying anti-NPAOZ monoclonal antibodies (McAbs) was produced in our laboratory (Le & Yu, Citation2015). All other chemicals and organic solvents were of analytical grade or better.
Equipment
The BioDot (Irvine, CA, USA) XYZ Platform combining motion control with an AirJet Quanti3000™ dispenser, a BioJet Quanti3000™ dispenser, the programmable strip cutter CM4000 and BioDot TSR3000 Membrane Strip Reader were provided by Gene Company Limited (ShangHai Branch, China). The UPLC system coupled to a Micro mass Quattro Premier XE triple quadrupole mass spectrometer was obtained from Waters (Manchester, UK).
Preparation of gold nanoparticles and colloidal gold–McAb conjugate
Colloidal gold with a mean diameter of 20 nm was prepared by using the citrate-reduction method according to our previous reports (Le et al., Citation2011; Ngom et al., Citation2011). The prepared colloidal gold nanoparticles were stored at 4°C for further use.
Colloidal gold-labeled anti-NPAOZ McAb was prepared by conjugation of the colloidal gold with the McAb according to the method described previously (Le et al., Citation2011; Le, He, Niu, Chen, & Xu, Citation2013). Briefly, the pH value of the prepared colloidal gold solution was adjusted to 8.0 with 0.2 M K2CO3. With gentle stirring, 0.1 mL of purified McAb (0.2 mg/mL) diluted in 100 mL of distilled water was added gently into 10 mL of gold colloid solution previously adjusted to pH 8.0 with 0.1 M of K3CO3, and the mixture was stirred vigorously for 30 min. Then, 1 mL of 10% (w/v) BSA aqueous solution was added to block excess reactivity of the gold colloid, followed by stirring for 30 min. The solution was maintained at 4°C for 2 h, and finally centrifuged at 13,000 rpm for 40 min to remove the unconjugated antibodies. After discarding the colorless supernatant, the loose sediment of the colloidal gold-labeled antibody was resuspended with 2 mM PBS (pH 7.4) containing 5%sucrose, 0.5% BSA, 0.5% Tween-20, 0.2% PEG 20000 and 0.02% NaN3.The concentrated colloidal gold-labeled antibody was stored at 4°C for further experiment.
Preparation and assembling of ICTS
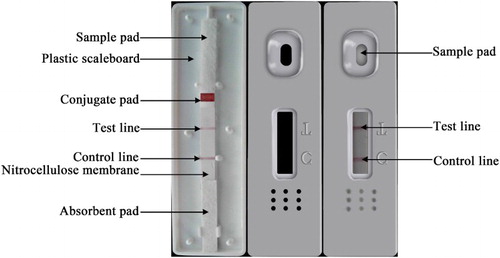
The preparation and assembling of ICTS have been described previously (Le et al., Citation2011; Le et al., Citation2013; Ngom et al., Citation2011), and are shown in . The strip was made of a sample pad, conjugate pads, blotted nitrocellulose membrane and absorbent pad. All of these parts were pasted on a backing card. The nitrocellulose membrane, which was coated with capture reagents and goat anti-mouse IgG, was an important element of the test strip. NPAOZ-BSA diluted to 0.5 mg/mL with 0.01 M carbonic acid buffer (pH 9.6) was used as the test line to capture the reagent, while goat anti-mouse IgG diluted to 0.5 mg/mL with 0.01 M phosphate-buffered saline (PBS; pH 7.4) was used as the control line to capture the reagent. These capture reagents were dispensed by the BioJet Quanti3000™ dispenser at 2.0 mL/cm onto a nitrocellulose membrane as the test and control lines. The test and control lines were situated 0.5 cm apart at the center of the membrane. After being dried at room temperature, they were stored at 4°C. Sample pad made of glass fiber was saturated with the mixture solution of PBST (0.01 M PBS, pH 7.4, containing 0.1% Tween 20) and polyvinylpyrrolidone (1%) at a ratio of 1:1. It was then dried at 60°C and kept in a desiccator at room temperature until use. A conjugate pad was made by dispensing the colloidal gold–McAb conjugate solution on to a 7 × 300 mm glass-fiber membrane at a speed of 50 mL/cm using an AirJet Quanti3000™, and then dried for 1 h at 56°C. The conjugate pads were sealed in a plastic bag with desiccant and stored in a desiccator at 4°C until use. The blotted nitrocellulose membrane, conjugate pad, sample pad and absorbent pad were laminated and pasted onto the PVC plate, which was then cut into 4-mm-wide and 60-mm-long strips using the programmable strip cutter CM4000. All strips were sealed in a plastic bag with a pack of desiccant gel and stored at 4°C.
Figure 2. Schematic illustration of ICTS detection of AOZ.
Samples of preparation
The matrix supernatants from AOZ free samples were prepared as follows: animal tissues from chicken, pork, carp and shrimp were homogenized and the homogenate was distributed (1.0 g each) into 10 mL disposable plastic centrifuge tubes. Then the samples were fortified by the addition of AOZ standard solution (10 μg/L) in PBS. Three milliliters of PBS was added into the tubes and the samples vortexed for 10 s. Samples were then placed in a boiling water bath for 10 min. After cooling to room temperature, 150 μL of 5 M HCl and 25 μL of 50 mM o-NBA in DMSO were added to the samples, and each tube was incubated at 37 °C overnight. After that, 0.3 mL of 2 M NaOH in concentrated PBS was added to each tube and the samples vortexed thoroughly for 20 s. Samples were centrifuged at 5000 rpm at 4°C for 20 min. The final pH of the samples was adjusted to 7.1–7.2 by addition of 1 M NaOH in combination with a pH-checker. The supernatants were transferred into new tubes and then were used for ICTS detection.
Calibration standards
Stock NPAOZ solution (1 μg/L in DMSO) was added to 21.56 mL of PBS to obtain a concentration of 2314 μg/L. Ten microliters of this solution was added to 990 μL of matrix supernatant to obtain an ICTS calibration standard of a concentration of 23.14 μg/L. This standard NPAOZ solution was diluted with matrix supernatant to obtain ICTS standards in matrix-matched concentration standards of 0.02, 0.07, 0.23, 0.69, 2.31, 6.94, 23.14, 69.42 and 231.4 μg/L. All analytical data were calculated on the basis of underivatized AOZ, a more conventional expression than the derivatized form (NPAOZ). After accounting for the increases in mass arising from derivatization with o-NBA using the coefficient 2.314, the respective concentrations of the AOZ equivalents were 0.01, 0.03, 0.1, 0.3, 1, 3, 10, 30 and 100 μg/L.
Evaluation of the ICTS performance
The ICTS developed in this study was validated by determining the limit of detection (LOD), limit of quantification (LOQ), recovery and precision. The performance of the test strip was determined by testing a matrix-matched standard or sample. The intensity of the test line was measured with a test strip reader. The concentrations of analyte in matrix supernatant, determined by ICTS, were read from the matrix-matched calibration curve. The assays were carried out in quintuplicate by using the test strip methods as described above. The intensity of the test line was measured with a test strip reader. The AOZ quantitative analysis was calculated according to a linear regression equation of the AOZ calibration curve. The standard curve was established by plotting the F/F0 × 100% against the logarithm of the AOZ concentration, where F and F0 represented fluorescence intensity, with and without the presence of competitive antigen (AOZ) in the standard solutions. To obtain a result in μg/kg, the concentration read from the matrix-matched calibration curve for AOZ was multiplied by a final sample volume V (= dilution factor). For V = 4.8 mL, the sample concentration is calculated as follows: Result (μg/kg) = Result of ICST (μg/L) × 4.8.
The determination of LOD was based on 20 blank animal tissue samples accepting no false positive rates, with an average plus 3 times standard deviation (SD). The same 20 blank samples were also assayed, following fortification with AOZ, to determine the LOQ, with an average plus 10 times SD. The visual cut-off level of the assay may be defined as the minimum AOZ concentration when the color on the test line had almost disappeared.
Recovery of fortified samples and LC-MS/MS confirmation
Animal tissue samples were obtained from a local supermarket. Before spiking, tissue samples were minced and homogenized thoroughly. All samples were fortified with AOZ at a content of 1.0, 5.0 and 10.0 μg/kg, and then analyzed by LC-MS/MS and ICTS. The LC-MS/MS testing method was performed according to a previously published paper (Wilasinee et al., Citation2015). The recovery of the added AOZ was calculated as follows: Recovery (%) = AOZ conc. measured/AOZ conc. fortified × 100. The analyses were performed in eight replicates for each concentration (n = 8).
Results and discussion
Principle of ICTS and result evaluation
schematically illustrates the configuration and measuring principle of ICTS. This ICTS is composed of sample pad, conjugation pad, absorption pad, nitrocellulose membrane and plastic scaleboard (). When the NPAOZ standard (or sample) solution was added to the well of the sample pad, the liquid solution was moved forward to the absorbent pad and the colloidal gold–McAb on the conjugate pad was dissolved and then trained up by the liquid through capillary action force. If there was no AOZ in the sample solution, the free colloidal gold-McAbs would be trapped by immobilized CPAOZ-BSA conjugates and form clear red bands on the test line. Meanwhile, the free colloidal gold-McAbs were subsequently caught by the specific secondary goat anti-mouse IgG antibodies at the control line, and the control line would appear due to the accumulation of red-colored colloidal gold-McAbs. Contrarily, for a standard or sample solution containing AOZ, the binding sites on the specific antibody molecules would be occupied first by AOZ, leaving fewer binding sites for the coating antigen (CPAOZ-BSA). The more AOZ was presented in the sample, the weaker the test line color was. Consequently, the degree of intensity of the gold color of the test line was the reverse of the concentration of NPAOZ and the visual result could be observed within a few minutes. If no color appeared at the control line or only a red line at the test line appears, it would mean that the test procedure was either improperly conducted or the strip was invalid. With the strip reader, the intensity was measured for quantitative determination of AOZ. The visual negative result was judged by the appearance of two red lines in the control and test lines. If the band with red color of sample was weaker than that of the negative sample without AOZ, the sample was considered to be weakly positive. The positive result was evaluated by the appearance of only a single line in the control line.
Properties of the ICTS
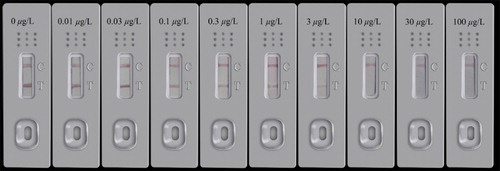
Under optimal assay conditions, AOZ standard solutions in a concentration range of 0–100 μg/L were directly detected by ICTS in quintuplicate with a derivatization step. After adding AOZ derivatized sample solution to the sample pad, 10 min later, the red color could be visualized by the naked eye. As shown in , upon adding increasing concentrations of AOZ, the intensity of the color on test lines was gradually decreased. The color intensity of the test line was similar to or weaker than that of the control line for the negative sample, which became obviously weaker at 3 μg/L, and the red line disappears in the presence of >10 μg/L. Thus 10 μg/L AOZ was considered to be the visual cut-off level for ICTS.
Figure 3. A series of diluted derivative solutions were tested by ICTS for NPAOZ in buffer, and visual results were examined after 10 min. Concentrations are expressed as equivalent underivatized AOZ. The sample was fortified with AOZ at levels of 0, 0.01, 0.03, 0.1, 0.3, 1, 3, 10, 30 and 100 μg/L.
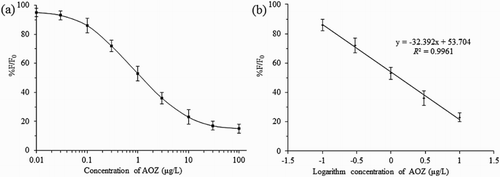
The color intensities of the test lines were measured using a strip reader, and the sensitivity of the ICTS for AOZ was expressed by 50% inhibitions (IC50 values). Under optimized conditions, the dose–response curves for NPAOZ in the assay buffer developed and are shown in (a). After transposing, as shown in (b), the good linearity was between 0.1 and 10 μg/L with an acceptable correlation coefficient (R2 = 0.9961, y = −32.392x + 53.704). The IC50 value was 1.3 μg/L.
Figure 4. Dose–response curve and calibration curve in the linear range for NPAOZ. Concentrations are expressed as equivalent underivatized AOZ. Normalized signals expressed as 100 (F/F0) (where F and F0 are the peak fluorescence signal intensity obtained with the AOZ analyte and the blank sample, respectively) were plotted versus the logarithm of AOZ concentration. The bars show the standard deviation for five replicate assays performed.
Based on the results from 20 different blank animal tissue samples (chicken, pork, carp and shrimp), the LODs and LOQs of ICTS were 0.15 and 0.31 μg/kg, respectively. The LOD and LOQ values achieved in this study were lower than those in published papers (Li et al., Citation2015; Tang, Xu, Liu, et al., Citation2011; Tang, Xu, Wang, et al., Citation2011; Xu et al., Citation2009). The LOD for the quantitative analyses were below 0.2 μg/kg, which is lower than the MRPL for AOZ residue set by the European Commission (European Commission., Citation2003).
Fortified sample analysis and comparison of ICST with LC-MS/MS
In order to test the applicability of the proposed ICTS for sample analysis, four collected samples (chicken, pork, carp and shrimp) were fortified with AOZ at a content of 1.0, 5.0 and 10.0 μg/kg. After pretreatment of the fortified samples, the extraction solutions were detected by ICTS and LC-MS/MS simultaneously. The NPAOZ concentration was measured and converted into AOZ concentration according to the standard curve run in the same day. The results obtained from ICTS and LC-MS/MS for AOZ are summarized in . For quantitative analysis by ICTS, the recoveries and CVs were found to be 76.3–98.2% and 9.1–11.6% (n = 8), respectively. For LC-MS/MS analysis, the recovery rates of 86.8–106.2% and CVs of 6.8–9.2% (n = 8) were obtained. A side-by-side comparison shows excellent correlations between ICTS/LC-MS/MS (y = 0.9858x−0.1272,R2 = 0.993). indicates that the ICTS showed, more or less, an underestimation of AOZ concentration in comparison to LC-MS/MS. The ICTS underestimation may be due to the incomplete derivatization of AOZ, extraction efficiencies, special matrix effects or other factors. The results showed that the ICTS is reliable for the quantitative detection of AOZ residue in animal tissue samples. Compared with the enzyme-linked immunosorbent assay method developed by Liu et al. (Citation2010), Zhu et al. (Citation2010), Jester et al. (Citation2014), and Le and Yu (Citation2015), the ICTS could also help save time without losing accuracy and precision.
Table 1. Recovery results and coefficient of variation (CV) for AOZ determination from four fortified samples measured by LC-MS/MS and ICTS (n = 8).
Conclusions
In this study, an immunochromatographic assay using colloidal gold conjugated with McAbs for the detection of AOZ in animal tissue was successfully developed. ICTS detection can be completed within 10 min. The intensity of red fluorescence on the test line was inversely related to the analyte concentration, and the visual cut-off level for ICTS was achieved at 10 μg/L. In practice, the LOD and LOQ for AOZ quantitative detection of the test strip could be 0.15 and 0.31 μg/kg by the use of the strip reader. The results of the assay for fortified samples were in good agreement with those of LC-MS/MS. In summary, this study demonstrated that this method is simple, sensitive, rapid, cost-effective and convenient for the on-site detection of AOZ residue in animal tissues.
Disclosure statement
No potential conflict of interest was reported by the authors.
Notes on contributors
Yong Xie has received her Bachelor and Master degrees in Food safety from Institute of biological engineering, University of Chongqing. She is currently a PhD candidate under the College of Life Science, Chongqing Normal University. Her main interest is in the Food safety inspection technology and immune detection technology.
Lei Zhang has received her Bachelor, Master and PhD degrees in Food from College of Food Science, University of Southwest. Her main interest is in the application of immune detection technology.
Tao Le has received his Bachelor, Master and PhD degrees in Preventive Veterinary Medicine from Institute of Animal Medicine, Huazhong Agricultural University. His main interest is in the application of immunochromatographic assay and ELISA.
Additional information
Funding
References
- Auro, A., Sumano, H., Ocampo, L., & Barragan, A. (2004). Evaluation of the carcinogenic effects of furazolidone and its metabolites in two fish species. Pharmacogenomics Journal, 4, 24–28. doi: 10.1038/sj.tpj.6500216
- Barbosa, J., Freitas, A., Moura, S., Mourão, J. L., Noronha da Silveira, M. I., & Ramos, F. (2011). Detection, accumulation, distribution, and depletion of furaltadone and nifursol residues in poultry muscle, liver, and gizzard. Journal of Agricultural and Food Chemistry, 59, 11927–11934. doi: 10.1021/jf2029384
- Chang, C., Peng, D. P., Wu, J. E., Wang, Y. L., & Yuan, Z. H. (2008). Development of an indirect competitive ELISA for the detection of furazolidone marker residue in animal edible tissues. Journal of Agricultural and Food Chemistry, 56, 1525–1531. doi: 10.1021/jf0726684
- Cheng, C. C., Hsieh, K. H., Lei, Y. C., Tai, Y. T., Chang, T. H., Sheu, S. Y., … Kuo, T. F. (2009). Development and residue screening of the furazolidone metabolite, 3-amino-2-oxazolidinone (AOZ), in cultured fish by an enzyme-linked immunosorbent assay. Journal of Agricultural and Food Chemistry, 57, 5687–5692. doi: 10.1021/jf900859r
- Cooper, K. M., Caddell, A., Elliott, C. T., & Kennedy, D. G. (2004). Production and characterisation of polyclonal antibodies to a derivative of 3-amino-2-oxazolidinone, a metabolite of the nitrofuran furazolidone. Analytica Chimica Acta, 520, 79–86. doi: 10.1016/j.aca.2004.05.074
- Cooper, K. M., & Kennedy, D. G. (2005). Nitrofuran antibiotic metabolites detected at parts per million concentrations in retina of pigs – A new matrix for enhanced monitoring of nitrofuran abuse. Analyst, 130, 466–468. doi: 10.1039/B418374F
- Diblikova, I., Cooper, K. M., Kennedy, D. G., & Franek, M. (2005). Monoclonal antibody-based ELISA for the quantification of nitrofuran metabolite 3-amino-2-oxazolidinone in tissues using a simplified sample preparation. Analytica Chimica Acta, 540, 285–292. doi: 10.1016/j.aca.2005.03.039
- European Commission. (2003). 2003/182/EC Commission decision of 13 March amending decision 2002/657/EC as regards the setting of minimum required performance limits (MRPLs) for certain residues in food of animal origin. Official Journal of the European Communities, L71, 17–18.
- European Commission. (2005). Commission regulation (EC) 1442/95. Official Journal of the European Communities, L143/26.
- Fernando, R., Munasinghe, D. M. S., Gunasena, A. R. C., & Abeynayake, P. (2017). Determination of nitrofuran metabolites in shrimp muscle by liquid chromatography-photo diode array detection. Food Control, 72, 300–305. doi: 10.1016/j.foodcont.2015.08.044
- Franek, M., Diblikova, I., Vass, M., Kotkova, L., Stastny, K., Frgalova, K., & Hruska, K. (2006). Validation of a monoclonal antibody-based ELISA for the quantification of the furazolidone metabolite (AOZ) in eggs using various sample preparation. Veterinary Medicine, 51, 248–257.
- Hu, X. Z., Xu, Y., & Yediler, A. (2007). Determinations of residual furazolidone and its metabolite, 3-amino-2-oxazolidinone (AOZ), in fish feeds by HPLC-UV and LC-MS/MS, respectively. Journal of Agricultural and Food Chemistry, 55, 1144–1149. doi: 10.1021/jf062902a
- Jester, E. L., Abraham, A., Wang, Y., EI Said, K. R., & Plakas, S. M. (2014). Performance evaluation of commercial ELISA kits for screening of furazolidone and furaltadone residues in fish. Food Chemistry, 145, 593–598. doi: 10.1016/j.foodchem.2013.08.090
- Khong, S. P., Gremaud, E., Richoz, J., Delatour, T., Guy, P. A., Stadler, R. H., & Mottier, P. (2004). Analysis of matrix-bound nitrofuran residues in worldwide-originated honeys by isotope dilution high-performance liquid chromatography-tandem mass spectrometry. Journal of Agricultural and Food Chemistry, 52, 5309–5315. doi: 10.1021/jf0401118
- Le, T., He, H. Q., Niu, X. D., Chen, Y., & Xu, J. (2013). Development of an immunochromatographic assay for detection of tylosin and tilmicosin in muscle, liver, fish and eggs. Food and Agricultural Immunology, 24, 467–480. doi: 10.1080/09540105.2012.716025
- Le, T., Xie, Y., Zhu, L. Q., & Zhang, L. (2016). Rapid and sensitive detection of 3-amino-2-oxazolidinone using a quantum dot-based immunochromatographic fluorescent biosensor. Journal of Agricultural and Food Chemistry, 64(45), 8678–8683. doi: 10.1021/acs.jafc.6b03732
- Le, T., & Yu, H. (2015). Determination of 3-amino-2-oxazolidinone in animal tissue by an enzymelinked immunosorbent assay and a time-resolved fluoroimmunoassay. Analytical Letters, 48(8), 1275–1284. doi: 10.1080/00032719.2014.979355
- Le, T., Yu, H., Wang, X. L., Ngom, B., Guo, Y. C., & Bi, D. R. (2011). Development and validation of an immunochromatographic test strip for rapid detection of doxycycline residues in swine muscle and liver. Food and Agricultural Immunology, 22(3), 235–246. doi: 10.1080/09540105.2011.556713
- Li, M. X., Yang, H., Li, S. Q., Liu, C. W., Zhao, K., Li, J. G., … Deng, A. P. (2015). An ultrasensitive competitive immunochromatographic assay (ICA) based on surface-enhanced Raman scattering (SERS) for direct detection of 3-amino-5-methylmorpholino-2-oxazolidinone (AMOZ) in tissue and urine samples. Sensors and Actuators B: Chemical, 211, 551–558. doi: 10.1016/j.snb.2014.12.135
- Liu, Y., Peng, D. P., Huang, L. L., Wang, Y. L., Chang, C., Ihsan, A., … Yuan, Z. H. (2010). Application of a modified enzyme-linked immunosorbent assay for 3-amino-2-oxazolidinone residue in aquatic animals. Analytica Chimica Acta, 664, 151–157. doi: 10.1016/j.aca.2010.02.010
- Ngom, B., Jin, X. E., Guo, Y. C., Shi, D. S., Zeng, Y., Le, T., … Bi, D. R. (2011). Monoclonal antibody against sulfaquinoxaline and quantitative analysis in chicken tissues by competitive indirect ELISA and lateral flow immunoassay. Food and Agricultural Immunology, 22(1), 1–16. doi: 10.1080/09540105.2010.514895
- Tang, Y., Xu, J., Wang, W., Xiang, J., & Yang, H. (2011). A sensitive immunochromatographic assay using colloidal gold–antibody probe for the rapid detection of semicarbazide in meat specimens. European Food Research and Technology, 232, 9–16. doi: 10.1007/s00217-010-1351-2
- Tang, Y., Xu, X. L., Liu, X., Huang, X. M., Chen, Y. Q., Wang, W. Z., & Xiang, J. J. (2011). Development of a lateral flow immunoassay (LFA) strip for the rapid detection of 1-amino-hydantoin in meat samples. Journal of Food Science, 76(6), T138–T143. doi: 10.1111/j.1750-3841.2011.02217.x
- Valera-Tarifa, N. M., Plaza-Bolaños, P., Romero-González, R., Martínez-Vidal, J. L., & Garrido-Frenich, A. (2013). Determination of nitrofuran metabolites in seafood by ultra high performance liquid chromatography coupled to triple quadrupole tandem mass spectrometry. Journal of Food Composition and Analysis, 30, 86–93. doi: 10.1016/j.jfca.2013.01.010
- Vass, M., Kotkova, L., Diblikova, I., Nevorankova, Z., Cooper, K. M., Kennedy, D. G., & Franek, M. (2005). Production and characterisation of monoclonal antibodies for the detection of AOZ, a tissue bound metabolite of furazolidone. Veterinary Medicine, 50, 300–310.
- Wilasinee, D., Sutthivaiyakit, P., & Sutthivaiyakit, S. (2015). Determination of nitrofurans in chicken feed by high-performance liquid chromatography–tandem mass spectrometry. Analytical Letters, 48, 1979–1987. doi: 10.1080/00032719.2015.1015075
- Xu, Y. P., Liu, L. Q., Li, Q. S., Peng, C. F., Chen, W., & Xu, C. L. (2009). Development of an immunochromatographic assay for rapid detection of 1-aminohydantoin in urine specimens. Biomedical Chromatography, 23, 308–314. doi: 10.1002/bmc.1115
- Yin, Y. Y., Liu, L. Q., Song, S. S., Kuang, H., & Xu, C. L. (2015). Development of a highly sensitive icELISA to detect semicarbazide based on a monoclonal antibody. Food and Agricultural Immunology, 26(3), 356–365. doi: 10.1080/09540105.2014.914891
- Zhang, Y., Qiao, H., Chen, C., Wang, Z., & Xia, X. (2016). Determination of nitrofurans metabolites residues in aquatic products by ultra-performance liquid chromatography–tandem mass spectrometry. Food Chemistry, 192, 612–617. doi: 10.1016/j.foodchem.2015.07.035
- Zhu, H. P., Liu, T. T., Liu, B., Yin, H. L., Li, X. L., Wang, L., & Wang, S. (2010). Antigens synthesis and antibodies preparation for furazolidone and its metabolite 3-amino-2-oxazolidinone. Chinese Chemical Letters, 21, 1049–1052. doi: 10.1016/j.cclet.2010.04.001