
ABSTRACT
A sensitive monoclonal antibody, 1H2, was generated in this study that simultaneously recognizes avermectin and ivermectin. An indirect competitive enzyme-linked immunosorbent assay (ic-ELISA) was developed, with 50% inhibitory concentrations of 0.491 ng/mL for avermectin and 0.770 ng/mL for ivermectin. A lateral-flow immunochromatographic assay (ICA) strip was also developed based on this monoclonal antibody for the semiquantitative and quantitative detection of avermectin and ivermectin. The semiquantitative (with the naked eye) analysis had visual limits of detection of 10 ng/mL for avermectin and 25 ng/mL for ivermectin, with cut-off values of 25 and 50 ng/mL, respectively. Using a strip scan reader, the quantitative results had calculated limits of detection of 1.3 ng/mL for avermectin and 2.9 ng/mL for ivermectin. In an analysis of raw milk samples, the recovery rates for the ic-ELISA ranged from 94% to 112% and for the ICA strip from 110% to 125%. Therefore, both methods are sensitive and effective for the on-site detection and rapid screening of samples, and are suitable for various other applications.
Introduction
Avermectin (AVM) is a 16-membered ring macrolide antibiotic produced by Streptomyces avermitilis and widely used in China in agricultural production as an effective antibiotic against nematodes, insects and mites, but with no antimicrobial activity (Sun et al., Citation2013; Lasota & Dybas, Citation1991). Ivermectin (IVM) is the hydrogenated derivative of AVM, and a new type of broad-spectrum, highly efficient, low-toxicity antibiotic drug-resistant parasites (Geary, Citation2005). As neurotoxins, AVM and IVM act through the glutamate- and/or γ-amino butyric acid (GABA)-gated chloride channels, with relatively low toxicity in mammals (Bai & Ogbourne, Citation2016). However, because these antibiotics are now extensively used in agriculture and animal husbandry, they potentially pose ecological risks (Sung, Huang, Fan, Lin, & Lin, Citation2009). Both have been shown to leave residues in daily foodstuffs, including fruit, vegetables, edible tissues, milk, and the tissues of animals (Howell et al., Citation2008). Therefore, sensitive and rapid analytical methods are required to reduce and monitor the residues of these antibiotics to ensure public health.
Liquid chromatography is the method most commonly used to detect macrolide antibiotics (Sheu & Chen, Citation2009) and can be conjugated with other devices in techniques such as high-performance liquid chromatography–quantitative nuclear magnetic resonance (Huang et al., Citation2016), liquid chromatography–tandem mass spectrometry (Ozdemir & Kahraman, Citation2016), high-performance liquid chromatography with fluorescence detection (Miao, Yang, Yang, Huang, & Hong, Citation2014), and high-performance liquid chromatography with ultraviolet detection (Rezaee et al., Citation2013). However, the expensive instruments, trained personnel, and complex preparative steps required limit the widespread use of these methods. Thin-layer chromatography, immunochemical methods, and ultraviolet methods are simple, but unsuitable for the strict region of each country.
Immunoassays are also efficient methods for the detection of antibiotics (Peng et al., Citation2016; Cao et al., Citation2015). The enzyme-linked immunosorbent assay (ELISA) is a sensitive method for quantification analyses and high-throughput sample screening (Guan et al., Citation2015). Xu developed an indirect competitive ELISA (ic-ELISA) specifically for AVM, with a 50% inhibitory concentration (IC50) of 101 ng/mL (Xu, Li, Sun, & Guo, Citation2009). The lateral-flow immunochromatographic assay (ICA) strip, an instrument-free method, is another rapid and simple diagnostic tool, which can be used for rapid on-site screening with qualitative or semiquantitative detection (Song et al., Citation2016; Xu et al., Citation2015).
In this study, a specific antigen was prepared based on AVM and used to immunize mice. After cell fusion, the monoclonal antibody (mAb) produced was used to develop a corresponding ic-ELISA and lateral-flow ICA strip. Raw milk samples were used to verify the methods developed.
Materials and methods
Chemicals
AVM, IVM, doramectin (DOR), eprinomectin (EP), emamectin (EMM), and succinic anhydride were obtained from J&K Scientific (Shanghai, China). Ovalbumin (OVA), bovine serum albumin (BSA), N-hydroxysuccinimide (NHS), 1-ethyl-3-(3-dimeth-ylaminopropyl) carbodiimide hydrochloride (EDC), and carbodiimide (CDI) were obtained from Sigma (St. Louis, MO, USA). Goat anti-mouse immunoglobulin (IgG) antibody was purchased from Jackson ImmunoResearch Laboratories (PA, USA). All other reagents and chemicals were from the National Pharmaceutical Group Chemical Reagent Co., Ltd (Shanghai, China).
Nitrocellulose (NC) high-flow membrane (PuraBind™ RP) was obtained from Whatman-Xinhua Filter Paper Co. (Hangzhou, China). The sample pad (CB-SB08), polyvinylchloride (PVC) backing card, and absorption pad (SX18) were supplied by Goldbio Tech Co. (Shanghai, China).
All buffer solutions were prepared with ultrapure water (Milli-Q Water Purification System, Millipore Co., Bedford, MA, USA). The hand-held strip scan reader was from Huaan Magnech Bio-Tech Co., Ltd (Beijing, China).
Antigen preparation
AVM was selected for the preparation of the antigens. Because AVM contains three hydroxyl groups, it can be conjugated with carrier proteins using different methods.
Antigen 1 (A1): AVM was conjugated with the carrier protein (BSA or OVA) with the NHS ester method (Xu et al., Citation2009). Because only hydroxyl groups are present on AVM, the compound was first modified with succinic anhydride. AVM (174.6 mg) was dissolved in 6 mL of pyridine, and then 24.1 mg of succinic anhydride was added to the solution. The mixture was reacted at 60°C for 24 h with stirring. The pyridine was removed with vacuum rotary evaporation and the sediment obtained was AVM–HS. To prepare the antigen, 20 mg of AVM–HS was dissolved in 2 mL of dimethyl formamide; 40 mg of NHS, and 70 mg of EDC were added and reacted at room temperature for 4 h with stirring. The protein (BSA or OVA) was dissolved in 0.1 M sodium carbonate–bicarbonate buffer (CB, pH 9.6) at 10 mg/mL. The reacted solution was added to the appropriate protein solution and reacted at room temperature for 4 h with stirring. The conjugates were dialyzed against 0.01 M phosphate-buffered saline (PBS) for 3 days in the dark.
Antigen 2 (A2): AVM was conjugated with the carrier protein (BSA or OVA) with the carbonyldimidazole method. AVM was first dissolved in dry dimethyl formamide at 10 mg/mL; 100 mg of CDI was added to 1 mL of AVM solution and reacted at 37°C for 8 h. The reacted solution was then added to the appropriate protein solution and reacted at room temperature for 4 h with stirring. The conjugates were dialyzed against 0.01 M PBS for 3 days in the dark.
The different antigens were characterized according to their UV spectra.
Preparation of monoclonal antibody
Female BALB/c mice (8–10 weeks old) were selected for immunization and injected with different antigens (AVM–HS–BSA-A1 or AVM–BSA-A2) and then tested with an ic-ELISA. The mice with high serum antibody titers and low inhibitory concentrations (IC50) values were selected for cell fusion. The cell screening procedure was as described previously (Wang et al., Citation2009) and effective hybridoma cell lines were obtained after three rounds of subcloning. After expansion culture, the selected hybridoma cells (1 × 10⁷) were injected into the peritoneal cavities of mice to produce ascites. The mAb was purified from the ascites with the caprylic acid–ammonium sulfate precipitation method (Kuang et al., Citation2013).
The antibody subtype was identified with a subtype kit. The affinity constant (Ka) of the mAb was determined with a simple antibody dilution method with an ELISA (Lew, Citation1984).
Development of the ic-ELISA
The ic-ELISA was produced with a conventional protocol (Kong, Liu, Song, Kuang, & Xu, Citation2016). The coating antigen was diluted with coating buffer (0.05 M CB, pH 9.6), added to each well of a 96-well plate (100 µL), and incubated for 2 h at 37°C. After the wells were washed three times, each well was blocked with 200 µL of blocking buffer (2% gelatin in 0.05 M CB, pH 9.6) and incubated at 37°C for 2 h. After the wells were washed three times, 50 µL of mAb and 50 µL of standard solution were added to each well and incubated at 37°C for 30 min. After the wells were washed three times, 100 µL of horseradish-peroxidase-labeled goat anti-mouse IgG antibody was added to each well and incubated at 37°C for 30 min. After the wells were washed four times, 100 µL of 3,3′,5,5′-tetramethylbenzidine substrate was added to each well and reacted at 37°C for 15 min in the dark. The color reaction was stopped with 50 µL of sulfuric acid (2 M) per well and the absorbance was read at 450 nm with a microplate reader.
Optimization of the ic-ELISA
The ic-ELISA was optimized by testing different potentially influential factors to produce a sensitive and effective tool. As previously reported, the optimization of the analytical method included optimizing the pH (5.0, 6.0, 7.4, 8.6, or 9.6), ionic strength (NaCl content: 0%, 0.4%, 0.8%, 1.6%, or 3.2%, m/v), and the acetonitrile content (0%, 5%, 10%, or 20%) of the standard dilution buffer (Yan, Liu, Xu, Kuang, & Xu, Citation2015).
Cross-reactivity
The specificity of the mAb was determined by testing its cross-reactivity (CR). AVM, IVM, DOR, EP, and EMM were tested with the ic-ELISA. The structure of each substance is shown in .
Figure 1. The structure of AVM structural analogues: (A) AVM; (B) IVM; (C) DOR; (D) EP and (E) EMM.
The CR values were calculated as follows: CR (%) = (IC50 of AVM/IC50 of competitor) × 100% (Liu, Yan, Zhang, Kuang, & Xu, Citation2015)
Preparation of the lateral-flow ICA strip
Four different components were assembled to prepare the lateral-flow ICA strip. A PVC backing card was used as the baseboard, and an NC membrane was attached to the center section of it. The sample pad and absorption pad were attached at each end of the PVC backing card and both overlapped the NC membrane by 2 mm. Before the fabrication of the ICA strip, the sample pad was immersed in 0.01 M PBS (containing 1% BSA and 0.2% Tween 20) to reduce matrix interference, and then dried at 37°C (Liu, Xing, Yan, Kuang, & Xu, Citation2014). After fabrication, the goat anti-mouse IgG antibody (0.5 mg/mL) was sprayed onto the NC membrane close to the absorption pad at 1 µL/cm with a membrane dispenser (Xinqidian Gene-Technology Co. Ltd, Beijing, China) to form the control line (C line). The coating antigen was sprayed onto the NC membrane close to the sample pad at 1 µL/cm to form the test line (T line). The assembled strip card was dried at 37°C for 30 min and then cut into individual test strips.
To produce the gold nanoparticle (GNP)-labeled mAb, GNPs were prepared as described previously (Feng et al., Citation2015). The pH of the GNP solution (10 mL, 1 nM) was adjusted to pH 8.4 with 40 µL of 0.1 M K2CO3 and then 80 µg of the prepared mAb was added to the GNP solution for the conjugation reaction. The mixed solution was reacted at room temperature for 50 min, 0.5% BSA (w/v) was added, and the solution was incubated at room temperature for a further 2 h to block and stabilize the GNP-labeled mAb. The reacted solution was centrifuged at 7000 × g for 30 min and the precipitate was washed three times with 0.02 M PBS containing 5% sucrose, 1% BSA, and 0.5% polyethylene glycol 6000. It was then dissolved in 1 mL of 0.02 M PBS (containing 0.02% NaN3) and stored at 4°C.
Principle of the lateral-flow ICA strip
For sample analysis, the prepared GNP-labeled mAb solution is first diluted with resuspension solution (7–43 µL) and then mixed with 150 µL of the sample solution. The mixture is reacted at room temperature for 5 min and then added to the sample pad. The solution migrates towards the absorbent pad and a result is obtained 5 min later (Xu et al., Citation2015).
Based on the antibody–antigen reaction, the coating antigen and free target substance compete for the GNP-labeled mAb. With negative samples, no free target substance binds to the GNP-labeled mAb, and all the GNP-labeled mAb is captured by the coating antigen and the goat anti-mouse IgG antibody on the T line and C line. Therefore, two red lines (C line and T line) appear on the strip. On the contrary, with positive samples, the free target substance binds the GNP-labeled mAb first, so less GNP-labeled mAb is captured by the coating antigen on the T line. Therefore, the color intensity on the T line is weaker than when there is no target substance or even disappears. The color intensity of the T line is inversely proportional to the concentration of the target substance in the sample. The C line should always emerge, and if it does not, the procedure was performed incorrectly or the strip was poorly assembled.
For the semiquantitative assay, the visual limit of detection (vLOD) is defined as the lowest concentration of target substance that produces a definitely weaker T-line color intensity than is produced by a negative sample. The cut-off value is defined as the threshold concentration of the target substance that causes the disappearance of the T line (Song et al., Citation2014). For the quantitative assay, the color intensity of the T line is read with a strip scan reader and the ratio of the optical density of the T line in the positive sample to that in the negative sample (the T/T0 value) is obtained. The calculated limit of detection (cLOD) is defined as the concentration that inhibits 10% of the signal (IC10) obtained from a standard curve (T/T0 value is the ordinate and the concentration of the target substance is the abscissa) (Kong, Liu, Song, Suryoprabowo, et al., Citation2016).
Sample analysis
Raw milk samples were prepared for analysis with the ic-ELISA and the lateral-flow ICA strip. For the ic-ELISA, 4 mL of raw milk sample was mixed vigorously with 4 mL of acetonitrile–PBS (50:50, v/v) for 5 min. The mixture was centrifuged at 8000 × g for 10 min and the supernatant was diluted with four volumes of sample dilution buffer (0.01 M PBS, pH 6.0). For the lateral-flow ICA strip, the raw milk was first centrifuged at 5000 × g for 15 min at 4°C. The lipid layer was removed, and the skim milk sample was used for the analysis.
Results and discussion
Characterization of antigens
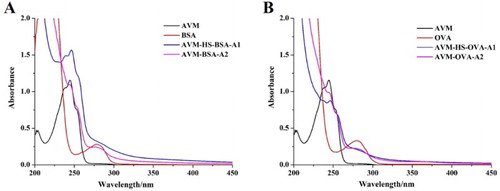
The two different antigens were characterized with UV–Vis spectroscopy. The characteristic peak of the carrier protein was at 278 nm and the characteristic peak of AVM was at 246 nm. If AVM was successfully conjugated to the carrier protein, the two characteristic peaks were observed simultaneously. As shown in , at similar concentrations, all the antigens had a characteristic peak at 278 nm and a wider peak near 246 nm, which confirmed that the antigen was successfully conjugated to the carrier proteins. AVM–BSA was used as the immunogen and AVM–OVA was used as the coating antigen.
Figure 2. The UV–Vis spectra of different antigens. (A) UV–Vis spectra of AVM–BSA immunogens and (B) UV–Vis spectra of AVM–OVA coating antigens.
Preparation of mAb
Different combinations of immunogen and coating antigen were evaluated (), and AVM–HS–BSA–A1 (immunogen) together with AVM–OVA–A2 (coating antigen) was selected as the optimum combination, with the highest titers and a significant inhibitory effect. The selected hybridoma cell line was obtained after cell fusion, and the selected mAb, 1H2, was purified from the prepared ascites. The subtype of mAb 1H2 was IgG2b ((A). The Ka value of mAb 1H2 was determined to be 1.41 × 10⁹ L/mol with a simple antibody dilution method using an ELISA ((B).
Figure 3. The characterization of obtained mAb 1H2. (A) The antibody subtype analysis of mAb 1H2 and (B) The affinity constant analysis of mAb 1H2.
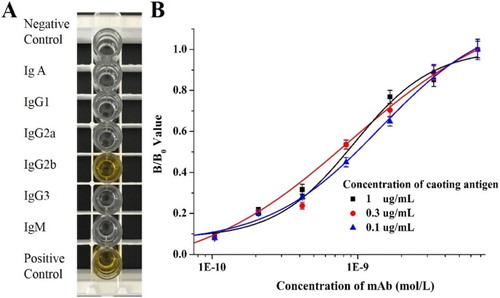
Table 1. The evaluation of different immunogens and coating antigens.
Development and optimization of ic-ELISA
To optimize the ic-ELISA, basic analysis conditions were used, with a coating antigen concentration of 0.1 µg/mL and an antibody concentration of 0.025 µg/mL. Bmax/IC50 (Bmax is the optical density at 450 nm under negative conditions) was selected as the evaluation standard.
The pH and NaCl content can affect the charge on the epitope or paratope group and the available number of sites for the antigen–antibody reaction because they affect the hydrophobic interactions of the antigen and antibody (Reverberi & Reverberi, Citation2007; Tarakanova et al., Citation2012) and also influence the antibody titer and IC50 of the ic-ELISA. Acetonitrile is used to extract AVM and IVM from animal-derived foods and can also influence the sensitivity of an ic-ELISA. The optimization results are shown in and the Bmax/IC50 values are shown in .
Figure 4. The optimization of the ic-ELISA method. (A) The optimization of the ic-ELISA method with different pH values; (B) the optimization of the ic-ELISA method with different ionic strengths (NaCl content); (C) the optimization of the ic-ELISA method with different acetonitrile contents and (D) the standard curve established under the optimum condition (AVM and IVM).
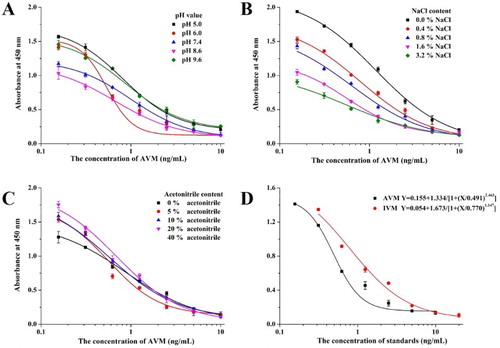
Table 2. The optimization of the ic-ELISA method.
From these results, a higher Bmax/IC50 value was obtained with an acidic dilution buffer (at pH 6.0), but as the NaCl content increased, the Bmax and IC50 values both decreased. The best Bmax/IC50 value was obtained with 0.8% NaCl. A higher acetonitrile content caused a higher Bmax value and lower IC50 value, which may be attributable to an improvement in the solubility of AVM. However, when the organic solvent content was too high, the antigen–antibody reaction is affected. Therefore, 5% acetonitrile was selected as optimal.
The optimum conditions for the ic-ELISA were pH 6.0, NaCl content of 0.8% (m/v), and 5% acetonitrile content (v/v). Both AVM and IVM were analyzed with the ic-ELISA. The standard curve for AVM was established as y = 0.155 + 1.334/[1 + (x/0.491)2.463], the linear regression correlation coefficient (R2) was 0.997, the IC50 value was 0.491 ng/mL, and the limit of detection (LOD, IC10) was 0.07 ng/mL. The standard curve for IVM was established as y = 0.054 + 1.673/[1 + (x/0.770)1.147], R2 was 0.994, the IC50 value was 0.770 ng/mL, and LOD (IC10) was 0.09 ng/mL.
Specificity of the mAb
AVM, IVM, DOR, EP, and EMM were analyzed with the ic-ELISA and the results are shown in . The mAb 1H2 did not recognize any analyte other than AVM and IVM.
Table 3. The CR value of mAb 1H2 by the ic-ELISA method.
Characterization of the lateral-flow ICA strip
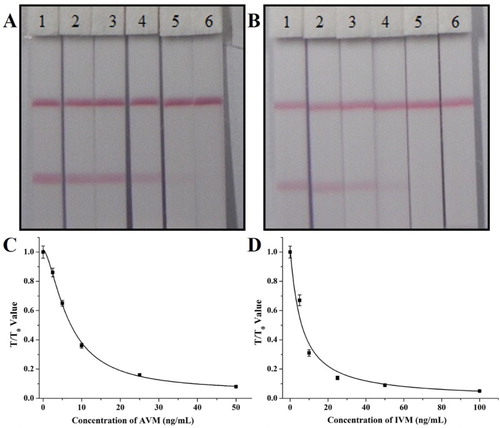
The sensitivity of the lateral-flow ICA strip was confirmed with a series of AVM standards (0, 2.5, 5, 10, 25, and 50 ng/mL) and IVM standards (0, 5, 10, 25, 50, and 100 ng/mL). The results are shown in (A,B), and the vLOD values for AVM and IVM were 10 and 25 ng/mL, respectively. The cut-off values were 25 ng/mL for AVM and 50 ng/mL for IVM. Standard curves were constructed for each target and are shown in (C, D). In the quantitative analysis, the cLOD values were 1.3 ng/mL for AVM and 2.9 ng/mL for IVM.
Figure 5. The sensitive analysis of the lateral-flow ICA strip. (A) The sensitive analysis with AVM: (1) 0 ng/ml; (2) 2.5 ng/ml; (3) 5 ng/ml; (4) 10 ng/ml; (5) 25 ng/ml; (6) 50 ng/ml; (B) The sensitive analysis with IVM: (1) 0 ng/ml; (2) 5 ng/ml; (3) 10 ng/ml; (4) 25 ng/ml; (5) 50 ng/ml; (6) 100 ng/ml; (C) the standard curve for AVM with ICA assay; and (D) the standard curve for IVM with ICA assay.
A comparison of the two analytical method used with the lateral-flow ICA strip showed that a rapid semiquantitative result can be seen with the naked eye. This method is suitable for the on-site screening of mass samples in a rough instrument-free analysis. Using a strip scan reader, the data of the standard curve were supplied to the reader and a quantitative result was obtained immediately after the analysis of the test strip by the scan reader. These results were more exact than those obtained with the naked eye, but this method is not yet more sensitive than ic-ELISA method.
Sample analysis
Free raw milk was spiked with different concentrations of AVM and IVM standards and analyzed with both the ic-ELISA and the lateral-flow ICA strip.
To test the ic-ELISA, the raw milk sample was spiked with 2.5, 5, and 10 ng/g of AVM and with 5, 10, and 20 ng/g of IVM and analyzed six times after the pretreatment steps. To test the lateral-flow ICA strip, the raw milk sample was spiked with 0, 5, 15, and 45 ng/g of AVM and with 0, 15, 45, and 135 ng/g of IVM and analyzed directly with the strip six times. The results are shown in and .
Figure 6. The spiked sample analysis with lateral-flow ICA strip by visual (n = 6).(A) The spiked sample with AVM: (1) 0 ng/ml; (2) 5 ng/ml; (3) 15 ng/ml; (4) 45 ng/ml; (B) The spiked sample with IVM: (1) 0 ng/ml; (2) 15 ng/ml; (3) 45 ng/ml; (4) 135 ng/ml. a Negative samples. b Negative result. The test line is obviously observed. c Weakly positive result. Light test line is observed. d Positive result. No test line is observed.
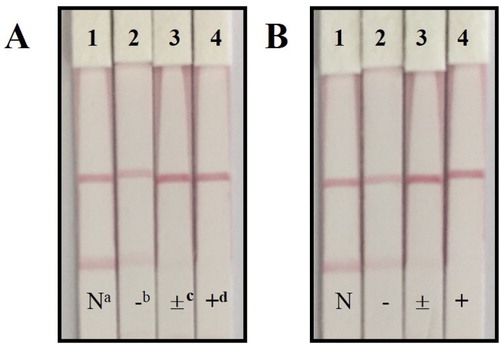
Table 4. The spiked sample analysis with ic-ELISA and lateral-flow ICA strip (n = 6).
The recovery rate of the ic-ELISA ranged from 106% to 109% for AVM and from 94% to 112% for IVM, indicating that this ic-ELISA is sensitive and stable for the detection of AVM and IVM in natural samples. In the lateral-flow ICA strip analysis, the semiquantitative results evaluated with the naked eye were only detectable as negative (<10 ng/g for AVM and <25 ng/g for IVM), weakly positive (10–25 ng/g for AVM and 25–50 ng/g for IVM), or positive (>25 ng/g for AVM and>50 ng/g for IVM). Although this method was faster than the ic-ELISA, it was not sufficiently exact or stable because the impressions of different observers are necessarily subjective. The strip scan reader recognizes the color intensity of the T line on strip, providing objective and stable data. These results were more sensitive than those achieved with the naked eye, so on-site sample screening was more accurate. In the analysis of raw milk samples, the recovery rate with the strip scan reader ranged from 117% to 125% for AVM and from 110% to 119% for IVM. However, no exact result was obtained for samples containing high concentrations of AVM or IVM because the T line disappeared at high concentrations of the target substance.
Conclusion
A sensitive mAb, 1H2, that simultaneously detects AVM and IVM was generated in this study with mouse immunization and cell fusion. A corresponding ic-ELISA and lateral-flow ICA strip were developed for the detection and quantification of these antibiotics in raw milk samples. With the ic-ELISA, the IC50 values were 0.491 ng/mL for AVM and 0.770 ng/mL for IVM, and the LODs were 0.07 and 0.09 ng/mL, respectively. In the raw milk samples, the recovery rates were 106–109% for AVM and 94–112% for IVM. The results for lateral-flow ICA strip could be obtained with both the naked eye and a strip scan reader. With the naked eye, the vLOD values for AVM and IVM were 10 and 25 ng/mL, respectively, with cut-off values of 25 and 50 ng/mL, respectively. More-sensitive results were obtained with the scan reader, with cLOD values of 1.3 ng/mL for AVM and 2.9 ng/mL for IVM, and recovery rates of 117–125% and 110–119%, respectively. The methods developed in this study allow AVM and IVM residues to be detected and monitored in food samples and should contribute to the reduction of antibiotic resistance.
Disclosure statement
No potential conflict of interest was reported by the authors.
Notes on contributors
Zhengjun Xie He is a full professor of food science and technology of Jiangnan University. He got his Ph.D in food science in 2009. His research interests are fast detection technology and food safety evaluation
Dezhao Kong got his bachelor from Nanjing University of Finance & Economics, Nanjing, China in 2012 and then he began to study in Jiangnan University (Wuxi, China) for as a Ph.D student in food science. His research interests are immunoassay applications in food.
Liqiang Liu got his Ph.D in food science in 2014 from Jiangnan University, Wuxi, China and then became a faculty in college of Food science and technology of Jiangnan University. His research interests are immunochromatographic strip design and application.
Shanshan Song, got her Master degree in food science in 2012 from Jiangnan University, Wuxi, China and then became a research assistant in college of Food science and technology of Jiangnan University. Her research interests are monoclonal antibody development.
Hua Kuang got her Ph.D from China Agricultural University in 2009 and then began to work as a faculty in college of Food science and technology of Jiangnan University. She is currently a full professor in food safety. Her research interests are biosensor development.
Additional information
Funding
References
- Bai, S. H., & Ogbourne, S. (2016). Eco-toxicological effects of the avermectin family with a focus on abamectin and ivermectin. Chemosphere, 154, 204–214. doi: 10.1016/j.chemosphere.2016.03.113
- Cao, S. S., Song, S. S., Liu, L. Q., Kong, N., Kuang, H., & Xu, C. L. (2015). Comparison of an enzyme-linked immunosorbent assay with an immunochromatographic assay for detection of lincomycin in milk and honey. Immunological Investigations, 44, 438–450. doi: 10.3109/08820139.2015.1021354
- Feng, M., Kong, D. Z., Wang, W. B., Liu, L. Q., Song, S. S., & Xu, C. L. (2015). Development of an immunochromatographic strip for rapid detection of Pantoea stewartii subsp. stewartii. Sensors, 15, 4291–4301. doi: 10.3390/s150204291
- Geary, T. G. (2005). Ivermectin 20 years on: Maturation of a wonder drug. Trends in Parasitology, 21, 530–532. doi: 10.1016/j.pt.2005.08.014
- Guan, D. D., Guo, L. L., Liu, L. Q., Kong, N., Kuang, H., & Xu, C. L. (2015). Development of an ELISA for nitrazepam based on a monoclonal antibody. Food and Agricultural Immunology, 26, 611–621. doi: 10.1080/09540105.2014.998637
- Howell, S. B., Burke, J. M., Miller, J. E., Terrill, T. H., Valencia, E., Williams, M. J., … Kaplan, R. M. (2008). Prevalence of anthelmintic resistance on sheep and goat farms in the southeastern United States. Javma-Journal of the American Veterinary Medical Association, 233, 1913–1919. doi: 10.2460/javma.233.12.1913
- Huang, T., Zhang, W., Dai, X. H., Li, N., Huang, L., Quan, C., … Yang, Y. (2016). High performance liquid chromatography-quantitative nuclear magnetic resonance (HPLC-qNMR) with a two-signal suppression method for purity assessment of avermectin B1a. Analytical Methods, 8, 4482–4486. doi: 10.1039/C6AY00570E
- Kong, D., Liu, L., Song, S., Kuang, H., & Xu, C. (2016). Analytical Methods. doi:10.1039/C5AY02659H
- Kong, D., Liu, L., Song, S., Suryoprabowo, S., Li, A., Kuang, H., … Xu, C. (2016). A gold nanoparticle-based semi-quantitative and quantitative ultrasensitive paper sensor for the detection of twenty mycotoxins. Nanoscale, 8, 5245–5253. doi: 10.1039/C5NR09171C
- Kuang, H., Xing, C. R., Hao, C. L., Liu, L. Q., Wang, L. B., & Xu, C. L. (2013). Rapid and highly sensitive detection of lead ions in drinking water based on a strip immunosensor. Sensors, 13, 4214–4224. doi: 10.3390/s130404214
- Lasota, J. A., & Dybas, R. A. (1991). Avermectins, a novel class of compounds: Implications for use in arthropod pest control. Annual Review of Entomology, 36, 91–117. doi: 10.1146/annurev.en.36.010191.000515
- Lew, A. M. (1984). The effect of epitope density and antibody affinity on the ELISA as analysed by monoclonal antibodies. Journal of Immunological Methods, 72, 171–176. doi: 10.1016/0022-1759(84)90445-9
- Liu, L. Q., Xing, C. R., Yan, H. J., Kuang, H., & Xu, C. L. (2014). Development of an ELISA and immunochromatographic strip for highly sensitive detection of Microcystin-LR. Sensors, 14, 14672–14685. doi: 10.3390/s140814672
- Liu, L. Q., Yan, H. J., Zhang, X., Kuang, H., & Xu, C. L. (2015). Development of an anti-chlorothalonil monoclonal antibody based on a novel designed hapten. Food and Agricultural Immunology, 26, 410–419. doi: 10.1080/09540105.2014.938319
- Miao, X. X., Yang, Y. Y., Yang, X. Y., Huang, Q. L., & Hong, H. (2014). Determination of abamectin residues in edible oils by high-performance liquid chromatography with fluorescence detection. Journal of AOAC International, 97, 928–932. doi: 10.5740/jaoacint.13-024
- Ozdemir, N., & Kahraman, T. (2016). Rapid confirmatory analysis of avermectin residues in milk by liquid chromatography tandem mass spectrometry. Journal of Food and Drug Analysis, 24, 90–94. doi: 10.1016/j.jfda.2015.07.004
- Peng, J., Wang, Y. W., Liu, L. Q., Kuang, H., Li, A. K., & Xu, C. L. (2016). Multiplex lateral flow immunoassay for five antibiotics detection based on gold nanoparticle aggregations. RSC Adv., 6, 7798–7805. doi: 10.1039/C5RA22583C
- Reverberi, R., & Reverberi, L. (2007). Blood transfusion = Trasfusione del sangue, 5, 227–240.
- Rezaee, M., Mashayekhi, H. A., Saleh, A., Abdollahzadeh, Y., Naeeni, M. H., & Fattahi, N. (2013). Determination of abamectin in citrus fruits using SPE combined with dispersive liquid-liquid microextraction and HPLC-UV detection. Journal of Separation Science, 36, 2629–2634. doi: 10.1002/jssc.201300356
- Sheu, C. S., & Chen, H. C. (2009). Journal of Food Drug Analysis, 17, 198–208.
- Song, S. Q., Liu, N., Zhao, Z. Y., Ediage, E. N., Wu, S. L., Sun, C. P., … Wu, A. B. (2014). Multiplex lateral flow immunoassay for mycotoxin determination. Analytical Chemistry, 86, 4995–5001. doi: 10.1021/ac500540z
- Song, Y. H., Song, S. S., Liu, L. Q., Kuang, H., Guo, L. L., & Xu, C. L. (2016). Simultaneous detection of tylosin and tilmicosin in honey using a novel immunoassay and immunochromatographic strip based on an innovative hapten. Food and Agricultural Immunology, 27, 314–328. doi: 10.1080/09540105.2015.1089843
- Sung, Y. F., Huang, C. T., Fan, C. K., Lin, C. H., & Lin, S. P. (2009). Avermectin intoxication with coma, myoclonus, and polyneuropathy. Clinical Toxicology, 47, 686–688. doi: 10.1080/15563650903070901
- Sun, P., Zhao, Q. F., Yu, F. T., Zhang, H., Wu, Z. H., Wang, Y. Y., … Liu, W. (2013). Spiroketal formation and modification in avermectin biosynthesis involves a dual activity of AveC. Journal of the American Chemical Society, 135, 1540–1548. doi: 10.1021/ja311339u
- Tarakanova, Y. N., Dmitriev, D. A., Massino, Y. S., Smirnova, M. B., Segal, O. L., Fartushnaya, O. V., … Dmitriev, A. D. (2012). Effect of conditions of monoclonal antibody adsorption on antigen-binding activity. Applied Biochemistry and Microbiology, 48, 506–512. doi: 10.1134/S0003683812050122
- Wang, C. M., Liu, Y. H., Guo, Y. R., Liang, C. Z., Li, X. B., & Zhu, G. N. (2009). Development of a McAb-based immunoassay for parathion and influence of the competitor structure. Food Chemistry, 115, 365–370. doi: 10.1016/j.foodchem.2008.11.091
- Xu, S. W., Li, S., Sun, D. B., & Guo, D. H. (2009). Preparation and characterization of monoclonal antibodies against avermectin. Hybridoma, 28, 173–176. doi: 10.1089/hyb.2009.0002
- Xu, N., Xu, L., Ma, W., Liu, L., Kuang, H., & Xu, C. (2015). An ultrasensitive immunochromatographic assay for non-pretreatment monitoring of chloramphenicol in raw milk. Food and Agricultural Immunology, 26, 635–644. doi: 10.1080/09540105.2014.998640
- Yan, H. J., Liu, L. Q., Xu, N. F., Kuang, H., & Xu, C. L. (2015). Development of an immunoassay for carbendazim based on a class-selective monoclonal antibody. Food and Agricultural Immunology, 26, 659–670. doi: 10.1080/09540105.2015.1007446