
ABSTRACT
A sensitive and specific anti-citrinin (anti-CIT) monoclonal antibody 1F2 was obtained following immunization and cell fusion. An indirect competitive enzyme-linked immunosorbent assay was developed with a 50% inhibitory concentration of 0.761 ng/mL and a limit of detection of 0.089 ng/mL. The recovery rates for CIT-spiked cereals (maize, wheat, and rice) ranged from 112% to 123%. A lateral-flow immunochromatographic assay was developed for both semi-quantitative and quantitative detection. With CIT-spiked cereals, the visual limit of detection was 8 ng/g and the cut-off value was 40 ng/g (semi-quantitative analysis with naked-eye detection). Using a strip scan reader, the calculated limit of detection was 1.28–1.8 ng/g for different CIT-spiked cereals. The recovery rates ranged from 110% to 127%. Therefore, both methods were effective for CIT detection and suitable for on-site detection and rapid screening of samples.
Introduction
Citrinin (CIT) is a mycotoxin synthesized by a variety of Penicillium (Li et al., Citation2017) and Aspergillus (He & Cox, Citation2016) species and detected in several foods including wheat flour, rye, oats, barley, maize, and feed grains (Li, Zhou, Yang, & Zhen, Citation2012). CIT is carcinogenic (Kuroda et al., Citation2013), teratogenic (Singh, Sharma, Dwivedi, Patil, & Kumar, Citation2007), and mutagenic (Sabater-Vilar, Maas, & Fink-Gremmels, Citation1999); additionally, studies have shown that it is a nephrotoxin (Xu, Jia, Gu, & Sung, Citation2006). In general, CIT is present in conjunction with ochratoxin A, and these two compounds act synergistically (Rasic, Stefanovic, Milicevic, & Peraica, Citation2015). Due to its risks on human health, it is important to develop a sensitive and rapid CIT detection method in foods and feed.
Several analytical methods have been developed for the determination of CIT including thin-layer chromatography, high-performance liquid chromatography (Lhotska, Satinsky, Havlikova, & Solich, Citation2016), liquid chromatography tandem mass spectrometry (Ji et al., Citation2015), (Kiebooms, Huybrechts, Thiry, Tangni, & Callebaut, Citation2016), gas chromatography-mass spectrometer (Shu & Lin, Citation2002), ultra-high-performance liquid chromatography and fluorescence detection (Huertas-Perez, Arroyo-Manzanares, Garcia-Campana, & Gamiz-Gracia, Citation2015), and high-performance liquid chromatography with UV diode array (Urraca et al., Citation2016). In addition, novel sensors have been developed as quartz crystal microbalance sensor (Fang, Liu, Yang, & Wang, Citation2016) and molecular imprinted electrochemical sensor (Atar, Yola, & Eren, Citation2016). However, these costly methods require trained personnel, sophisticated instruments, and complex sample preparation steps.
Immunoassays are effective in mycotoxin detection (Kong et al., Citation2016), (Li, Wang, & Guo, Citation2012). The enzyme-linked immunosorbent assay (ELISA) is a sensitive and high-throughput method for sample screening and quantification (Guan et al., Citation2015). The lateral-flow immunochromatographic assay (ICA) strip method is a rapid, simple, and instrument-free diagnostic tool for on-site screening with qualitative/semi-quantitative detection (Khaemba et al., Citation2016).
In this study, we prepared a monoclonal antibody (mAb) 1F2 and developed an indirect competitive ELISA (ic-ELISA) and a lateral-flow ICA strip for the detection of CIT in maize, wheat, and rice.
Materials and methods
Chemicals
CIT, aflatoxin B1 (AFB1), aflatoxin M1 (AFM1), deoxynivalenol (DON), zearalenone (ZEA), ovalbumin (OVA), bovine serum albumin (BSA), N-hydroxysuccinimide (NHS), 1-ethyl-3-(3-dimeth-ylaminopropyl) carbodiimide hydrochloride (EDC), and carbodiimide (CDI) were obtained from Sigma (St. Louis, MO, USA). Goat anti-mouse immunoglobulin (IgG) antibody was purchased from Jackson ImmunoResearch Laboratories (West Grove, PA, USA). Other reagents and chemicals were supplied by the National Pharmaceutical Group Chemical Reagent Co., Ltd. (Shanghai, China).
Nitrocellulose (NC) high-flow membrane (Pura-Bind™ RP) was obtained from Whatman-Xinhua Filter Paper Co. (Hangzhou, China). Sample pad (CB-SB08), polyvinylchloride (PVC) backing card, and absorption pad (SX18) were acquired from Goldbio Tech Co. (Shanghai, China).
All buffer solutions were prepared with ultrapure water (Milli-Q purification system, Millipore Co., Bedford, MA, USA). The hand-held strip scan reader was from Huaan Magnech Bio-Tech Co., Ltd (Beijing, China).
Antigen preparation
CIT has several functional groups; therefore, different antigens were prepared as coating antigens and immunogens.
Antigen 1 (A 1): CIT was conjugated with carrier protein (BSA or OVA) by the carbonyldimidazole method (Liu, Yu, He, & Xu, Citation2007). Briefly, CIT was dissolved in dry tetrahydrofuran at 10 mg/mL. CDI (8 mg) was mixed with 100 µL CIT (1 mg) and allowed to react at 37°C for 4 h. Protein (BSA or OVA) was dissolved in 0.1 M sodium carbonate-bicarbonate buffer (CB, pH 9.6) at 10 mg/mL. The CDI/CIT solution was mixed with the appropriate protein solution and allowed to react under constant stirring at room temperature for 12 h. The resulting conjugates were dialyzed against 0.01 M phosphate buffer solution (PBS) for 3 d in the dark.
Antigen 2 (A 2): CIT was conjugated with carrier protein (BSA or OVA) by the N-hydroxysuccinimide ester method (Liu et al., Citation2007). CIT (1 mg of 10 mg/mL CIT solution in dry tetrahydrofuran) was mixed with 2 mg NHS and 3 mg EDC. The solution was stirred constantly at room temperature for 4 h, mixed with the appropriate protein solution (BSA or OVA), and allowed to react at room temperature for 12 h under constant stirring. The resulting conjugates were dialyzed against 0.01 M PBS for 3 d in the dark.
Antigen 3 (A 3): CIT was conjugated to carrier protein (BSA or OVA) by formaldehyde condensation (Duan et al., Citation2009). CIT (1 mg dissolved in 200 µL methanol), formaldehyde (37%, 320 µL), and the appropriate protein solution (BSA or OVA) were mixed and incubated at 37°C for 4 h under constant stirring. The resulting conjugates were dialyzed against 0.01 M PBS for 3 d in the dark.
The different antigens were characterized according to the UV spectrum.
Preparation of mAb against CIT
Female BALB/c mice (8–10 weeks of age) were injected with different antigens (CIT-BSA-A1, CIT-BSA-A2, and CIT-BSA-A3) and tested by ic-ELISA using different coating antigens. The mouse with the highest serum antibody titer and lowest 50% inhibition concentration (IC50) under optimal conditions was selected for cell fusion. Cell fusion and screening procedures were performed as previously reported (Wang et al., Citation2009). The hybridoma cell lines were obtained by screening. After three rounds of sub-clones, the selected hybridoma cells (1 × 10⁷) were injected into the peritoneal cavity of mice for ascites production. MAbs were purified from ascites by the caprylic acid-ammonium sulfate precipitation method (Kuang et al., Citation2013).
Development of ic-ELISA
Ic-ELISA was performed as previously reported (Kong et al., Citation2015). The selected coating antigen was diluted with coating buffer (0.05 M, CB, pH 9.6) and added to 96-well plates (100 µL/well). The plates were incubated at 37°C for 2 h, washed three times, blocked with 200 µL/well blocking buffer (2% gelatin in 0.05 M CB, pH 9.6), and incubated at 37°C for 2 h. Following three washes, 50 µL anti-CIT mAb and 50 µL CIT standard solution were added to each well and incubated at 37°C for 30 min. Subsequently, 100 µL HRP-labelled goat anti-mouse IgG was added to each well and incubated at 37°C for 30 min following three washes. The compound 3,3′,5,5′-tetramethylbenzidine (100 µL) was added after four washes. Following incubation at 37°C for 15 min in the dark, the enzymatic reaction was stopped with 2M sulfuric acid (50 µL/well). Absorbance was measured at 450 nm in a microplate reader.
Optimization of ic-ELISA
The developed ic-ELISA method was optimized as previously reported (Yan, Liu, Xu, Kuang, & Xu, Citation2015). Different parameters were evaluated including pH (5.0, 6.0, 7.4, 8.6, and 9.6), ionic strength (NaCl content: 0.2%, 0.4%, 0.8%, 1.6%, and 3.2%, m/v), and methanol content (0%, 5%, 10%, 20%, and 40%) of the dilution buffer.
Cross-reactivity
MAb specificity was assessed by measuring cross-reactivity (CR) with AFB1, AFM1, DON, and ZEA using ic-ELISA. CR values were calculated by the following equation,
CR (%) = (IC50 of CIT/IC50 of competitor) × 100% (Liu, Yan, Zhang, Kuang, & Xu, Citation2015).
Preparation of the lateral-flow ICA strip
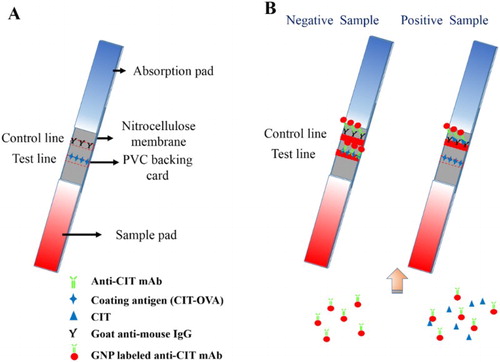
For the preparation of the lateral-flow ICA strip, the sample pad was first immersed in 0.01 M PBS (containing 1% BSA and 0.2% Tween-20) to reduce matrix interference (Liu, Xing, Yan, Kuang, & Xu, Citation2014) and dried at 37°C for 4 h. The NC membrane was attached to the center of the PVC backing card, and the sample pad and absorption pad were attached at each end of the PVC backing card with a 2-mm overlap on the NC membrane ((A)). Goat anti-mouse IgG antibody (0.5 mg/mL) was sprayed onto the NC membrane near the absorption pad at 1 µL/cm using a membrane dispenser (Xinqidian Gene-Technology Co. Ltd., Beijing, China), resulting in the formation of the control line (C line). The coating antigen was sprayed onto the NC membrane near the sample pad at 1 µL/cm, resulting in the formation of the test line (T line). The assembled strip card was dried at 37°C for 30 min and cut into individual test strips.
Figure 1. Principle of the lateral-flow immunochromatographic strip detection. (A) Composition of the lateral-flow immunochromatographic strip. (B) Strip detection with negative sample and positive sample.
For the preparation of gold nanoparticles (GNPs)-labelled mAb, the GNPs were prepared as previously reported (Feng et al., Citation2015). The GNP solution (1 nM, 10 mL) was adjusted with 0.1 M K2CO3 and conjugated with anti-CIT mAb (0.1 mg mAb). Following a 50-min reaction at room temperature, 1 mL of 0.5% BSA (w/v) was slowly added to block and stabilize the GNP-labeled mAbs. Following incubation at room temperature for 2 h, the solution was centrifuged at 7000×g for 30 min. The precipitate was washed three times with 0.02 M PBS (containing 5% sucrose, 1% BSA, and 0.5% PEG 6000, pH 7.4), dissolved in 1 mL of 0.02 M PBS (containing 0.02% NaN3), and stored at 4°C.
Principle of the lateral-flow ICA strip
Based on the antibody-antigen reaction, CIT in the sample competes with the coating antigen on the T line for the GNP-labeled mAb.
GNP-labelled mAb solution (4 µL) was diluted with 46 µL resuspension solution and mixed with 150 µL sample extraction solution. This mixture was allowed to react at room temperature for 5 min and added to the sample pad. After the solution migrated towards the absorbent pad (5 min), the results can be obtained with the naked eye (Guo et al., Citation2015).
In CIT-negative samples, two red lines (C line and T line) appear on the strip because there is no CIT in the sample that can react with GNP-labelled mAbs. Therefore, the GNP-labelled mAbs are captured by the coating antigen and goat anti-mouse IgG antibody present on the T and C lines. In CIT-positive samples, CIT conjugates with GNP-labelled mAb. Therefore, there is less GNP-labelled mAb available for capture by the coating antigens, resulting in a weak color on the T line ((B)). The color intensity of the T line is inversely proportional to the concentration of CIT. The C line should always emerge; otherwise, the procedure was incorrectly performed or the strip was poorly assembled.
The visual limit of detection (vLOD) value was defined as the lowest concentration of CIT that resulted in a weaker T line color intensity than that of the negative sample. The cut-off value was defined as the threshold concentration of CIT that resulted in the disappearance of the T line (Song et al., Citation2014). These semi-quantitative results can be obtained with the naked eye.
For quantitative analysis, the color intensity of the T line was measured using a strip scan reader. The optical density ratio of the T line between the positive sample and the negative sample, that is, the T/T0 value (ordinate) was plotted against the concentration of the CIT (abscissa). The calculated limit of detection (cLOD) was defined as 10% inhibition concentration (IC10) from the standard curve (Kong, Liu, Song, Kuang, & Xu, Citation2016; Kong et al., Citation2016).
Sample analysis
Different CIT-negative cereal samples (maize, wheat, and rice) were finely ground. Sample (5 g) was spiked with CIT at different concentrations, extracted with 20 mL methanol-water (2:8, v/v), shaken vigorously for 15 min, and centrifuged at 8000×g for 10 min. The resulting supernatant was diluted with an equal volume of PBS (NaCl content at 1.6%, m/v) for ic-ELISA and lateral-flow ICA strip analyses.
Results and discussion
Characterization of antigens
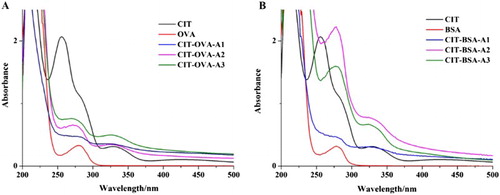
Following dialysis, free CIT molecule was removed and obtained the successful conjugates. The antigens were characterized by UV-Vis spectroscopy (). The characteristic peaks of protein and CIT were at 278 and 250/333 nm, respectively. As shown in , two absorption peaks were obtained at ∼280 and 333 nm. All antigens had two simultaneous absorption peaks at ∼280 and 333 nm, which confirmed that CIT was successfully conjugated with proteins. The wide peak at ∼280 nm may be caused by the combined action of CIT and carrier protein following coupling. The obtained antigens had higher coupling ratios from the formaldehyde condensation and the N-hydroxysuccinimide ester method than from carbonyldimidaze method. CIT-BSA was used as the immunogen, and CIT-OVA was used as the coating antigen.
Figure 2. The UV-Vis spectra of different antigens (CIT-BSA/CIT-OVA).
Development and optimization of ic-ELISA
Three immunogens and coating antigens were evaluated (). CIT-BSA-A3 (immunogen) and CIT-OVA-A3 (coating antigen) were selected because they had the highest titers and inhibitory effects, which may be attributed to the combination of resonance stabilization and hydrogen bonding that reduced the reactivity of all groups (Abramson, Usleber, & Martlbauer, Citation2001). CIT-OVA-A3 was used in the development of the immunoassays.
Table 1. The evaluation of different immunogens and coating antigens.
The selected cell line 1F2 was obtained after cell fusion, and the corresponding mAbs were purified from ascites. Based on sub-type analysis and the simple antibody dilution method (Lew, Citation1984), the subtype of mAb 1F2 was IgG2b, and the affinity constant was 1.65 × 10⁹ L/mol.
For the optimization of ic-ELISA, IC50 and antibody titer were chosen as evaluation standards using a coating antigen concentration of 0.3 µg/mL and an antibody concentration of 0.125 µg/mL.
CIT easily dissolves in methanol but not in water; therefore, methanol concentration may affect extraction efficiency and assay sensitivity. (A) shows that IC50 and antibody titer increased with increasing methanol concentrations. Based on the extraction process and detection sensitivity, we selected a standard dilution buffer with 10% (v/v) methanol.
Figure 3. The optimization of ic-ELISA. (A) The optimization of ic-ELISA method with different methanol content; (B) The optimization of ic-ELISA method with different ionic strength (NaCl content); (C) The optimization of ic-ELISA method with different pH values; and (D) The standard curve established under the optimum condition.
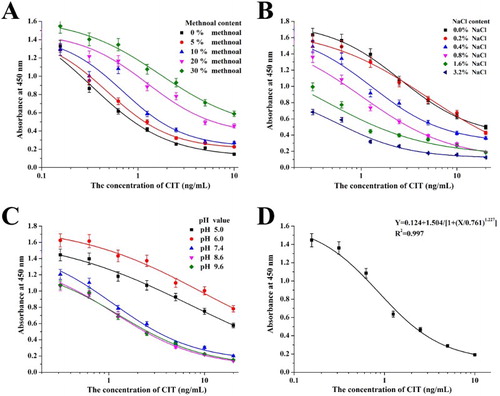
Ionic strength affects the charge of epitopes or paratopes and limits the antigen-antibody reaction. Therefore, NaCl concentration might affect antibody titer and IC50. Furthermore, pH may affect the number of sites available for the antigen-antibody reaction due to hydrophobic interactions. Extreme pH values may induce conformational changes in the antibody and affect the antigen-antibody reaction (Kong, Liu, Song, Kuang, & Xu, Citation2017). (B,C) show that high NaCl concentrations (3.2% and 1.6%) resulted in low antibody titer and that low NaCl concentrations (0% and 0.2%) resulted in high antibody titer and IC50 values. We selected 0.8% NaCl, which resulted in a similar antibody titer as 0.4% NaCl but with low sensitivity result. Low pH values (5.0 and 6.0) resulted in high IC50 values. We obtained similar results at pH 7.4, 8.6 and 9.6; however, pH 7.4 contributed to a higher antibody titer.
Under optimum conditions (10% methanol, 0.8% NaCl, and pH 7.4), we generated a standard curve for ic-ELISA ((D)). The equation of the standard curve was y = 0.124 + 1.504/[1 + (x/0.761)1.227], the linear regression correlation coefficient (R2) was 0.997, the IC50 value was 0.761 ng/mL, and the limit of detection (LOD, IC10) was 0.089 ng/mL.
Specificity of mAb
CIT, AFB1, AFM1, DON, and ZEA were tested by ic-ELISA, and the results are shown in . The developed anti-CIT mAb was specific and had no CR with other toxins.
Table 2. The CR value of mAb against CIT by the ic-ELISA.
Characterization of the lateral-flow ICA strip
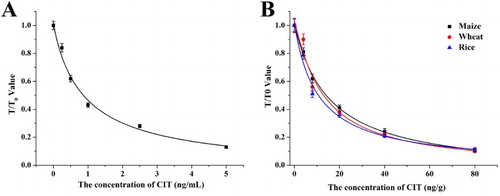
The sensitivity of the lateral-flow ICA strip was confirmed with a series of standards (0, 0.25, 0.5, 1, 2.5, and 5 ng/mL; (A)). The vLOD value for CIT was 0.5 ng/mL, and the cut-off value was 2.5 ng/mL. Strips were analyzed in a strip scan reader ((A)). In the quantitative analysis, the cLOD value for CIT was 0.11 ng/mL.
Figure 4. The analysis of lateral-flow ICA strip by naked eyes. (A) The sensitive analysis with CIT: (1) 5 ng/ml; (2) 2.5 ng/ml; (3) 1 ng/ml; (4) 0.5 ng/ml; (5) 0.25 ng/ml; (6) 0 ng/ml; (B) The CIT-spiked maize sample: (1) 80 ng/g; (2) 40 ng/g; (3) 20 ng/g; (4) 8 ng/g; (5) 4 ng/g; (6) 0 ng/g; (C) The CIT-spiked wheat sample: (1) 80 ng/g; (2) 40 ng/g; (3) 20 ng/g; (4) 8 ng/g; (5) 4 ng/g; (6) 0 ng/g; and (D) The CIT-spiked rice sample: (1) 80 ng/g; (2) 40 ng/g; (3) 20 ng/g; (4) 8 ng/g; (5) 4 ng/g; (6) 0 ng/g.
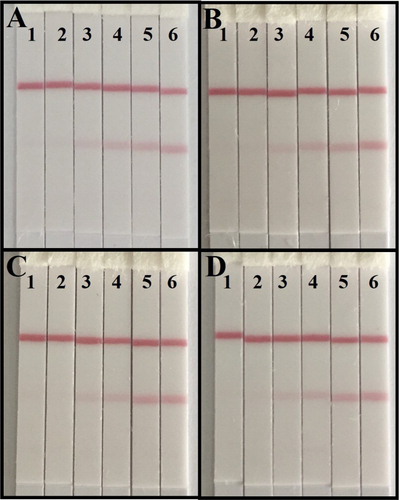
Figure 5. The analysis of lateral-flow ICA strip by strip scan reader. (A) The standard curve of ICA strip by strip scan reader; (B) The calibration curve of ICA strip by strip scan reader with different sample.
Sample analysis
For ic-ELISA, we generated calibration curves of each free sample (maize, wheat, and rice; ). The results revealed that the standard curves were similar to the calibration curves. Therefore, the developed ic-ELISA method was suitable for sample analyses. Each sample was spiked with CIT standards (4, 8, and 16 ng/g) and analyzed six times by ic-ELISA ().
Figure 6. The calibration curve of ic-ELISA with different sample.
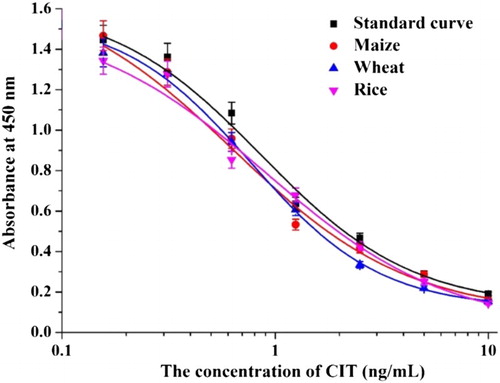
Table 3. The spiked sample analysis with ic-ELISA and ICA strip (n = 6).
For the lateral-flow ICA strip, we spiked the samples with CIT standards (0, 4, 8, 20, 40, and 80 ng/g). The extraction solutions were analyzed with the naked eye and a strip scan reader ((B–D)). The vLOD and cut-off value for the samples were 8 and 40 ng/g, respectively. The cLOD value ranged between 1.28 and 1.86 ng/g ((B)). The sensitive of strip result was influenced by the matrix and to be worse than in standard buffer. Subsequently, samples were spike with CIT standards (4, 20, and 80 ng/g) and analyzed by the lateral-flow ICA strip. Each detection was repeated six times and the results are shown in .
The recovery rates of CIT-spiked samples from ic-ELISA ranged from 112% to 123%. Therefore, ic-ELISA was suitable and stable for CIT detection in cereals. The lateral-flow ICA strip was simpler than ic-ELISA, but with poor sensitivity. For semi-quantitative analysis, results could only be detected as negative (<8 ng/g), weakly positive (8–40 ng/g), and positive (>40 ng/g) with the naked eye. Additionally, very low or very high CIT concentrations could not be identified by the lateral-flow ICA strip. Exacted results could be obtained with the strip scan reader. The recovery rates of CIT-spiked samples obtained from the lateral-flow ICA strips ranged from 110% to 127%. However, as the T line disappeared at high concentrations of the target substance, the exact result could not be obtained.
Therefore, ic-ELISA is a more sensitive high-throughput method than the lateral-flow ICA strip (either measured with the naked eye or a strip scan reader) and is suited for laboratory analyses. The lateral-flow ICA strip is a more convenient and rapid method and is more suitable for on-site analyses and sample screening.
Conclusions
A specific and sensitive mAb 1F2 was developed for the development of immunoassays. The ic-ELISA and lateral-flow ICA strip were developed for CIT detection in different cereals. Under optimum conditions, the IC50 value of ic-ELISA was 0.761 ng/mL, and the LOD value was 0.089 ng/mL, with recovery rates ranging from 112% to 123% in CIT-spiked samples. The lateral-flow ICA strip had vLOD and cut-off values of 8 and 40 ng/g with the naked eye, respectively, and a cLOD value of 0.11 ng/mL with the strip scan reader. For CIT-spiked samples, cLOD of maize, wheat, and rice was 1.28–1.86 ng/g with recovery rates of 110–127%. Both of these methods allowed the detection of CIT in food samples. These rapid and effective tools are suitable for sensitive and on-site mass sample screening and would play a significant role in future analytical applications.
Disclosure statement
No potential conflict of interest was reported by the authors.
Notes on contributors
Dezhao Kong got his bachelor's degree from Nanjing University of Finance & Economics, Nanjing, China, in 2012 and then he began to study in Jiangnan University (Wuxi, China) as a Ph.D. student in food science. His research interests are immunoassay applications in food.
Zhengjun Xie is a full professor of food science and technology of Jiangnan University. He got his Ph.D. in food science in 2014. His research interests are fast detection technology and food safety evaluation.
Liqiang Liu got his Ph.D. in food science in 2014 from Jiangnan University, Wuxi, China, and then became a faculty in College of Food Science and Technology of Jiangnan University. His research interests are immunochromatographic strip design and application.
Shanshan Song got her Master's degree in food science in 2012 from Jiangnan University, Wuxi, China, and then became a research assistant in College of Food Science and Technology of Jiangnan University. Her research interests are monoclonal antibody development.
Hua Kuang got her Ph.D. from China Agricultural University in 2009 and then began to work as a faculty in College of Food Science and Technology of Jiangnan University. She is currently a full professor in food safety. Her research interests are biosensor development.
Additional information
Funding
References
- Abramson, D., Usleber, E., & Martlbauer, E. (2001). Immunochemical method for citrinin. Methods in Molecular Biology (Clifton, N.J.), 157, 195–204.
- Atar, N., Yola, M. L., & Eren, T. (2016). Sensitive determination of citrinin based on molecular imprinted electrochemical sensor. Applied Surface Science, 362, 315–322. doi: 10.1016/j.apsusc.2015.11.222
- Duan, Z. H., Lin, Z. S., Yao, H. R., Gao, Y. H., Zhang, K., Zhao, S. Q., & Zhu, Z. Y. (2009). Preparation of artificial antigen and Egg yolk-derived immunoglobulin (IgY) of Citrinin for enzyme-linked immunosorbent assay. Biomedical and Environmental Sciences, 22, 237–243. doi: 10.1016/S0895-3988(09)60051-9
- Fang, G. Z., Liu, G. Y., Yang, Y. K., & Wang, S. (2016). Quartz crystal microbalance sensor based on molecularly imprinted polymer membrane and three-dimensional Au nanoparticles@mesoporous carbon CMK-3 functional composite for ultrasensitive and specific determination of citrinin. Sensors and Actuators B: Chemical, 230, 272–280. doi: 10.1016/j.snb.2016.02.053
- Feng, M., Kong, D. Z., Wang, W. B., Liu, L. Q., Song, S. S., & Xu, C. L. (2015). Development of an immunochromatographic strip for rapid detection of pantoea stewartii subsp. stewartii. Sensors, 15, 4291–4301. doi: 10.3390/s150204291
- Guan, D. D., Guo, L. L., Liu, L. Q., Kong, N., Kuang, H., & Xu, C. L. (2015). Development of an ELISA for nitrazepam based on a monoclonal antibody. Food and Agricultural Immunology, 26, 611–621. doi: 10.1080/09540105.2014.998637
- Guo, J. N., Liu, L. Q., Xue, F., Xing, C. R., Song, S. S., Kuang, H., & Xu, C. L. (2015). Development of a monoclonal antibody-based immunochromatographic strip for cephalexin. Food and Agricultural Immunology, 26, 282–292. doi: 10.1080/09540105.2014.907242
- He, Y., & Cox, R. J. (2016). The molecular steps of citrinin biosynthesis in fungi. Chemical Science, 7, 2119–2127. doi: 10.1039/C5SC04027B
- Huertas-Perez, J. F., Arroyo-Manzanares, N., Garcia-Campana, A. M., & Gamiz-Gracia, L. (2015). High-throughput determination of citrinin in rice by ultra-high-performance liquid chromatography and fluorescence detection (UHPLC-FL). Food Additives & Contaminants: Part A, 32, 1352–1357. doi: 10.1080/19440049.2015.1055522
- Ji, X. F., Xu, J. F., Wang, X. F., Qi, P. P., Wei, W., Chen, X. Y., … Zhou, Y. (2015). Citrinin determination in red fermented rice products by optimized extraction method coupled to liquid chromatography tandem mass spectrometry (LC-MS/MS). Journal of Food Science, 80, T1438–T1444. doi: 10.1111/1750-3841.12900
- Khaemba, G. W., Tochi, B. N., Mukunzi, D., Joel, I., Guo, L. L., Suryobrobowo, S., … Xu, C. L. (2016). Development of monoclonal antibody and lateral test strip for sensitive detection of clenbuterol and related β 2-agonists in urine samples. Food and Agricultural Immunology, 27, 111–127. doi: 10.1080/09540105.2015.1079598
- Kiebooms, J. A. L., Huybrechts, B., Thiry, C., Tangni, E. K., & Callebaut, A. (2016). A quantitative UHPLC-MS/MS method for citrinin and ochratoxin A detection in food, feed and red yeast rice food supplements. World Mycotoxin Journal, 9, 343–352. doi: 10.3920/WMJ2015.1971
- Kong, N., Guo, L. L., Guan, D. D., Liu, L. Q., Kuang, H., & Xu, C. L. (2015). An ultrasensitive ELISA for medroxyprogesterone residues in fish tissues based on a structure-specific hapten. Food Analytical Methods, 8, 1382–1389. doi: 10.1007/s12161-014-0023-4
- Kong, D. Z., Liu, L. Q., Song, S. S., Kuang, H., & Xu, C. L. (2016). Development of an immunochromatographic strip for the semi-quantitative and quantitative detection of biotin in milk and milk products. Analytical Methods, 8, 1595–1601. doi: 10.1039/C5AY02659H
- Kong, D. Z., Liu, L. Q., Song, S. S., Kuang, H., & Xu, C. L. (2017). Development of sensitive, rapid, and effective immunoassays for the detection of vitamin B12 in fortified food and nutritional supplements. Food Analytical Methods, 10, 10–18. doi: 10.1007/s12161-016-0543-1
- Kong, D. Z., Liu, L., Song, S., Suryoprabowo, S., Li, A., Kuang, H., … Xu, C. (2016). A gold nanoparticle-based semi-quantitative and quantitative ultrasensitive paper sensor for the detection of twenty mycotoxins. Nanoscale, 8, 5245–5253. doi: 10.1039/C5NR09171C
- Kuang, H., Xing, C. R., Hao, C. L., Liu, L. Q., Wang, L. B., & Xu, C. L. (2013). Rapid and highly sensitive detection of lead ions in drinking water based on a strip immunosensor. Sensors, 13, 4214–4224. doi: 10.3390/s130404214
- Kuroda, K., Ishii, Y., Takasu, S., Kijima, A., Matsushita, K., Watanabe, M., … Umemura, T. (2013). Cell cycle progression, but not genotoxic activity, mainly contributes to citrinin-induced renal carcinogenesis. Toxicology, 311, 216–224. doi: 10.1016/j.tox.2013.07.003
- Lew, A. M. (1984). The effect of epitope density and antibody affinity on the ELISA as analysed by monoclonal antibodies. Journal of Immunological Methods, 72, 171–176. doi: 10.1016/0022-1759(84)90445-9
- Lhotska, I., Satinsky, D., Havlikova, L., & Solich, P. (2016). A fully automated and fast method using direct sample injection combined with fused-core column on-line SPE–HPLC for determination of ochratoxin A and citrinin in lager beers. Analytical and Bioanalytical Chemistry, 408, 3319–3329. doi: 10.1007/s00216-016-9402-6
- Li, T., Jiang, G., Qu, H., Wang, Y., Xiong, Y., Jian, Q., & Jiang, Y. (2017). Comparative transcriptome analysis of penicillium citrinum cultured with different carbon sources identifies genes involved in citrinin biosynthesis. Toxins, 9, Article id pii: E69.
- Liu, L. Q., Xing, C. R., Yan, H. J., Kuang, H., & Xu, C. L. (2014). Development of an ELISA and immunochromatographic strip for highly sensitive detection of microcystin-LR. Sensors, 14, 14672–14685. doi: 10.3390/s140814672
- Liu, L. Q., Yan, H. J., Zhang, X., Kuang, H., & Xu, C. L. (2015). Development of an anti-chlorothalonil monoclonal antibody based on a novel designed hapten. Food and Agricultural Immunology, 26, 410–419. doi: 10.1080/09540105.2014.938319
- Liu, R., Yu, Z., He, Q., & Xu, Y. (2007). Preparation and identification of a monoclonal antibody against citrinin. Journal of Hygiene Research, 36, 190–193.
- Li, Y. N., Wang, Y. Y., & Guo, Y. H. (2012). Preparation of synthetic antigen and monoclonal antibody for indirect competitive ELISA of citrinin. Food and Agricultural Immunology, 23, 145–156. doi: 10.1080/09540105.2011.606562
- Li, Y., Zhou, Y. C., Yang, M. H., & Zhen, O. Y. (2012). Natural occurrence of citrinin in widely consumed traditional Chinese food red yeast rice, medicinal plants and their related products. Food Chemistry, 132, 1040–1045. doi: 10.1016/j.foodchem.2011.11.051
- Rasic, D., Stefanovic, S., Milicevic, D., & Peraica, M. (2015). Ochratoxin A stimulates citrinin accumulation in rat kidney and liver. Toxicology Letters, 238, S264–S264. doi: 10.1016/j.toxlet.2015.08.762
- Sabater-Vilar, M., Maas, R. F. M., & Fink-Gremmels, J. (1999). Mutagenicity of commercial Monascus fermentation products and the role of citrinin contamination. Mutation Research/Genetic Toxicology and Environmental Mutagenesis, 444, 7–16. doi: 10.1016/S1383-5718(99)00095-9
- Shu, P. Y., & Lin, C. H. (2002). Simple and sensitive determination of citrinin in Monascus by GC-selected Ion monitoring mass spectrometry. Analytical Sciences, 18, 283–287. doi: 10.2116/analsci.18.283
- Singh, N. D., Sharma, A. K., Dwivedi, P., Patil, R. D., & Kumar, M. (2007). Citrinin and Endosulfan induced teratogenic effects in Wistar rats. Journal of Applied Toxicology, 27, 143–151. doi: 10.1002/jat.1185
- Song, S. Q., Liu, N., Zhao, Z. Y., Ediage, E. N., Wu, S. L., Sun, C. P., … Wu, A. B. (2014). Multiplex lateral flow immunoassay for mycotoxin determination. Analytical Chemistry, 86, 4995–5001. doi: 10.1021/ac500540z
- Urraca, J., Huertas-Perez, J. F., Cazorla, G. A., Gracia-Mora, J., Garcia-Campana, A. M., & Moreno-Bondi, M. C. (2016). Development of magnetic molecularly imprinted polymers for selective extraction: Determination of citrinin in rice samples by liquid chromatography with UV diode array detection. Analytical and Bioanalytical Chemistry, 408, 3033–3042. doi: 10.1007/s00216-016-9348-8
- Wang, C. M., Liu, Y. H., Guo, Y. R., Liang, C. Z., Li, X. B., & Zhu, G. N. (2009). Development of a McAb-based immunoassay for parathion and influence of the competitor structure. Food Chemistry, 115, 365–370. doi: 10.1016/j.foodchem.2008.11.091
- Xu, B. J., Jia, X. Q., Gu, L. J., & Sung, C. K. (2006). Review on the qualitative and quantitative analysis of the mycotoxin citrinin. Food Control, 17, 271–285. doi: 10.1016/j.foodcont.2004.10.012
- Yan, H. J., Liu, L. Q., Xu, N. F., Kuang, H., & Xu, C. L. (2015). Development of an immunoassay for carbendazim based on a class-selective monoclonal antibody. Food and Agricultural Immunology, 26, 659–670. doi: 10.1080/09540105.2015.1007446