
ABSTRACT
An immunochromatographic strip was developed for detection of acetamiprid (AC) and cross-reactivity with thiacloprid (TC) in cucumber and apple samples. This detection system was developed based on a sensitive and specific monoclonal antibody produced in our laboratory. Under optimized conditions, the cut-off limits of the test strip for AC were found to be 1 and 0.25 ng/mL for TC in phosphate-buffered saline. Meanwhile, with simple preparation for detection cucumber and apple samples, the cut-off limits for AC were found to be 5 and 2.5 ng/mL for TC in cucumber samples. The immunochromatographic assay also revealed AC cut-off values of 30 and 15 ng/mL in apple samples. Each test can be evaluated within 5 min. The data indicate that the method is sensitive, rapid, specific, and has the advantages of simplicity; therefore, this immunochromatographic assay is a useful screening method for detection of AC and TC residues in cucumber and apple samples.
Introduction
Pesticide residues are an important factor in food safety and environmental pollution. Neonicotinoid insecticides have been used globally for the treatment of agricultural pests as a replacement for organophosphates and represent the fastest growing class of insecticides introduced to the market since the launch of pyrethroids. The most common neonicotinoid insecticides include imidacloprid, acetamiprid (AC), nitenoyram, clothianidin, and dinotefuran (Gbylik-Sikorska, Sniegocki, & Posyniak, Citation2015; Giroud, Vauchez, Vulliet, Wiest, & Bulete, Citation2013; Jeschke, Nauen, Schindler, & Elbert, Citation2011; Nauen & Denholm, Citation2005).
As one of the most efficient pesticides, AC (N-[(6-chloro-3-pyridyl)methyl]-N’-cyano-N-methyl-acetamidine) () is widely used to control various insect pests, of the orders Hemiptera, Thysanoptera, and Lepidoptera on vegetables, fruits, and tea (“The Pesticide Manual,” Citation1997). Since its toxicity is known to be relatively low and chronic in mammals, it has been considered as a replacement insecticide for organophosphorus and other conventional insecticides. Due to its frequent and extensive usage, AC in crops such as, vegetables and fruits, as well as in water, will cause a potential risk to human health. For this reason, the concentration of AC residue in agricultural products should be monitored (Fan, Zhao, Shi, Liu, & Li, Citation2013; Shi, Zhao, Liu, Fan, & Cao, Citation2013).
Figure 1. Chemical structure of acetamiprid.
AC residues in agricultural products have mainly been analyzed using high-performance liquid chromatography (Jovanov et al., Citation2015; Watanabe & Miyake, Citation2013), gas chromatography (Mateu-Sanchez, Moreno, Arrebola, & Vidal, Citation2003; Tokieda, Ozawa, Kobayashi, & Gomyo, Citation1998), and liquid chromatography-tandem mass spectrometry (Abdel-Ghany, Hussein, El Azab, El-Khatib, & Linscheid, Citation2016; Hao, Noestheden, Zhao, & Morse, Citation2016; Jovanov et al., Citation2013; Yamamuro, Ohta, Aoyama, & Watanabe, Citation2014). However, these methods are time-consuming and expensive due to long clean-up procedures and sophisticated analytical instruments required.
Practical methods with high sensitivity and selectivity for simple and rapid detection are crucial for human health. Currently, enzyme-linked immunosorbent assays (ELISAs) (Uchigashima, Watanabe, Ito, Iwasa, & Miyake, Citation2012; Watanabe, Baba, & Miyake, Citation2011; Watanabe, Miyake, Baba, Eun, & Endo, Citation2006) are widely used for detecting pesticide residues and endocrine disrupting chemicals (Newsome, Citation1986; Watanabe, Shan, Stoutamire, Gee, & Hammock, Citation2001). This method have several advantages, (1) high analyte selectivity (specificity), (2) high throughput of samples, (3) reduced need for sample-treatment, and (4) increased cost-effectiveness for large number of samples (Sun, Liu, Song, Kuang, & Xu, Citation2016; Xu et al., Citation2016). However, lateral-flow immunochromatographic assays are increasingly popular for detecting residues because they are simple, rapid, specific, and sensitive. Compare with ELISAs, lateral-flow immunochromatographic assays have the advantage that all the reagents are included in the strip and the results can be obtained within 5–10 min (Khaemba et al., Citation2016; Kong, Liu, Song, Kuang, & Xu, Citation2016; Liu et al., Citation2014).
Immunochromatographic lateral-flow testing has applicability because it is rapid, simple, and effective, and to the best of our knowledge, no immunochromatographic lateral-flow test device for detection of AC residues has been previously reported. The aim of this study was to develop an immunochromatographic lateral-flow test strip for detection of AC in cucumbers and apples
Material and methods
Chemicals and reagents
AC was purchased from J&K Scientific (Shanghai, China). Enzyme immunoassay-grade horseradish peroxidase (HRP)-labeled goat anti-mouse immunoglobulin was obtained from Sigma (St. Louis, MO, USA). QuickAntibody-Mouse 5W was obtained from Biodragon-Immunotech Co., Ltd. (Beijing, China). Gelatin was obtained from Beijing Biodee Biotechnology Co., Ltd. (Beijing, China). Tetramethylbenzidine and HRP were purchased from Aladdin Chemistry Co., Ltd. (Shanghai, China). All reagents used for cell fusion were from Sunshine Biotechnology Co., Ltd. (Nanjing, China). Bovine serum albumin (BSA), ovalbumin (OVA) and keyhole-limpet hemocyanin (KLH) were obtained from Solarbio Science & Technology, Co, Ltd. (Beijing, China). All other reagent and chemicals were obtained from the National Pharmaceutical Group Chemical Reagent Co, Ltd. (Shanghai, China).
Nitrocellulose (NC) high-flow plus membranes (Pura-bind RP) were obtained from Whatman-Xinhua Filter Paper Co., Ltd. (Hangzhou, China). Glass fiber membrane (CB-SB08) used for the sample pad, polyvinylchloride (PVC) backing material and absorbance pad (SX18) were supplied by Goldbio Tech Co., Ltd. (Shanghai, China). A BioDot TSR 3000 Membrane Strip Reader (Gene Company Limited, Shanghai Branch, Shanghai (China)) was used to test the color intensities of colloidal gold on the test zone. The conjugated coating antigens (AC-BSA) and specific monoclonal antibodies (anti-AC monoclonal antibody (mAb), No. 1B3) were generated in our laboratory.
All buffer solutions were prepared using ultrapure water (Milli-Q purification system, Millipore Co., Bedford, MA, USA). The strip cutting instrument was CM 4000 (Gene, Shanghai, China). The Airjet Quanti 3000TM and Biojet Quanti 3000TM (XinqidianGene-technology Co., Ltd., Beijing, China) were used as dispensers.
Preparation and characterization of monoclonal anti-acetamiprid antibody
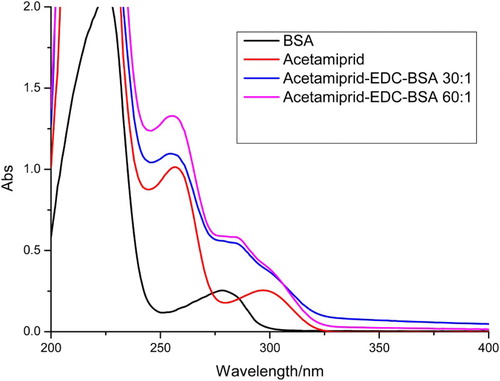
AC was conjugated to BSA, OVA, or KLH using the ester method (Suryoprabowo, Liu, Peng, Kuang, & Xu, Citation2015). Briefly, a mixture of AC, carboxyl-reactive carbodiimide cross linker (1-ethyl-3-[3-dimethylaminopropyl]carbodiimide hydrochloride) (EDC), and N-hydroxysuccinimide (NHS) were added to N,N-dimethyl formamide and incubated for 24 h (solution 1). KLH or BSA was mixed with 0.01 M phosphate-buffered saline solution (PBS) (solution 2). Solution 1 was slowly added to solution 2 with stirring and the mixture was then stirred continuously for 8 h at room temperature. The conjugates were dialyzed against distilled water for 3 days and subsequently with 0.01 M PBS for a further 3 days. Ultraviolet absorption was used to check the conjugation of protein and AC.
Female BALB/c mice (6–8 weeks old) were used to produce of mAb. The mice were immunized subcutaneously with an AC-KLH conjugate, prepared from a mixture of AC-KLH and quick antibody-Mouse 5W. Each mouse’s leg was immunized every 3 weeks with 100 µg for the first immunization and 50 µg each subsequent injection (2–3 times). The antibodies (blood samples) from immunized mice were measured by ELISA and the mouse with the highest titer was sacrificed and its splenocytes were fused with Sp 2/0 murine myeloma cells; the resulting hybridomas were then screened using an indirect ELISA. The selected hybridoma cells were expanded and injected into BALB/c mice to produce the mAb (Deng et al., Citation2012; Suryoprabowo, Liu, Peng, Kuang, & Xu, Citation2014). The ascites was harvested and purified by the caprylic acid-ammonium sulfate precipitation method (Kuang et al., Citation2013). The purified antibody solution was stored at −20°C until further use.
Development of the immunochromatographic test device
Preparation of colloidal gold particles
All the solvents were prepared with ultrapure water then filtered through a transfer membrane (0.22 µm). Chlorauric acid (25 mL of a 0.1 g/L) solution was heated to boiling under constant stirring, and then 1% w/v sodium citrate tribasic dihydrate solution (1.0 mL) was added. The mixture was stirred for 30 min. When the color of the solution turned wine-red, it was cooled to room temperature, and stored at 4°C. Transmission electron microscopy analysis showed that the gold nanoparticles had a nearly uniform particle size of 15 nm.
Preparation of colloidal gold-labeled mAb
The half-maximal inhibitory concentration (IC50) of the anti-AC mAb (no. 1B3) was 0.4 ng/mL and its cross-reactivity with thiacloprid (TC) (IC50 = 0.1 ng/mL) was used. The pH of 10 mL colloidal gold solution was adjusted to 7.0 with 0.1 M K2CO3. Briefly, the mAb (0.40 mL) was added to the solution dropwise, and 35 min later, 1 mL of 10% (w/v) BSA was added, and the mixture was stirred for 2 h. The product was centrifuged for 45 min at 8000 rpm to remove the gold aggregates. The solution was separated into two layers, and the lower layer (red gold-labeled mAb) was collected and washed with 0.02 M phosphate buffer containing 5% sucrose, 1% BSA, and 0.5% polyethylene glycol (PEG) 6000 (pH 7.4). The conjugation products were reconstituted to 1 mL in gold-labeling resuspension buffer (0.02 M PBS, 5% sucrose, 2% sorbitol, 1% mannitol, 0.1% PEG, 0.1% tween, and 0.04% NaN3) and stored at 4°C until use.
Preparation of NC capture membranes
The coating antigen (AC-BSA) () and goat anti-mouse IgG antibody were used as the capture reagent in the control line on the test strip. The antigen and goat anti-mouse IgG coatings were sprayed onto the NC membrane at 1 µL/cm using a dispenser to produce the test and control lines on the strip. The capture and control reagent was sprayed onto the glass fiber membrane to prepare the conjugate pad, which was dried at 37°C for 2 h. The NC membrane coated with capture reagents was then pasted onto the center of the plastic backing plate (PVC and the conjugate pad, sample pad, and absorbent pad were laminated and pasted onto the back plate. Finally, the plate was cut into 2.8 mm wide strips with a strip cutter.
Figure 2. The UV spectra characterization for AC-BSA, AC, and BSA.
Test procedure and principle
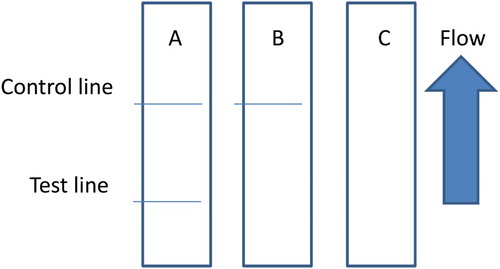
Before the test, 50 µL of gold-labeled mAb is mixed with 150 µL of sample solution, allowed to react for about 5 min, than added to sample pad. The solution migrates to the absorbent pad. The test results are obtained within 5 min. If AC is present in the sample, it competes with the AC-BSA conjugates embedded in the test line for the finite amount of anti-AC mAb. When a sufficient amount of AC is present, the free AC binds all the labeled mAb, preventing the mAb binding to the AC-BSA in the test line. Therefore, the more AC that is present, the weaker the color of the test line will appear. If there is no AC, the limited amount of colloidal gold-labeled mAb is trapped by the immobilized AC-BSA conjugate, and a clearly visible red test line appears.
The flow must reach the control line, which contains goat anti-mouse IgG antibody, and also produces an indicator reaction. Therefore, the control line must always appear in a successful test, whereas the test line will only appear when the sample is negative ((A)). The appearance of the control line alone is a positive result ((B)), whereas if neither the control line nor the test line appears ((C)), the test procedure is incorrect or the strip is invalid, indicating that the test should be repeated with a new strip.
Figure 3. Illustration of typical strip test results. If the sample is negative (A), a positive result could be indicated only if the control line appears (B), and if the control and test line does not appears (invalid) (C).
Determination of performance
Sensitivity of the test strip
The sensitivity of the test strip was determined by testing AC samples. The AC standard was diluted to concentration of 0, 0.25, 0.5, 1, and 2.5 ng/mL in 0.01 M PBS (pH 7.4) and the detection limit was determined. The sample solution (100 µL) was mixed with 50 µL gold-labeled mAb, allowed to react for 5 min and then added to the sample pad. After 5 min, the test strip reader recorded the color intensities of the different strips. The lowest detection limit (LDL) that could be detected with the naked eye was defined at the amount of AC that produced a color reaction on the strip that clearly visibly differed in intensity from the result of 0 ng/mL AC. Six replicate samples for each concentration were analyzed on the same day.
Detection of AC in cucumber and apple samples
The detection of AC in cucumber and apple samples was assessed using cucumber and apple samples that bought in the local market. The samples (40 g) were crushed, and only the liquid from the cucumber and apple was tested. For apple samples, a simple pretreatment was used, which involved diluting the apple juice three-fold in extraction buffer (0.01 M PBS pH 7.4). The samples to be analyzed were spiked with the AC standard solution (10 µg/mL, prepared with 0.01 M PBS, pH 7.4). The AC concentrations in cucumber were 0.1, 0.25, 0.5, 1, 2.5, and 5 ng/mL and in apple samples were 0.5, 1, 2.5, 5, and 10 ng/mL. For TC, the concentrations in cucumber were 0.1, 0.25, 0.5, 1, and 2.5 ng/mL and apple samples were 0.25, 0.5, 1, 2.5, and 5 ng/mL. An un-spiked (blank) sample was used as the control. Six replicates of each concentration were analyzed with the test strips.
Results and discussion
Optimization of the strip test
The sensitivity of an immunochromatographic strip is mainly affected by the coating antigens and gold nanoparticle mAbs. The coating antigens were synthesized in our laboratory. Coating antigen consisted of OVA and BSA linked to AC at different ratios (OVA: AC-NHS, m/m); 1:30 and 1:60; (BSA: AC-NHS, m/m); 1:30 and 1:60. Their ultraviolet absorption spectra were determined ( and ).
Figure 4. The UV absorption spectra of hapten-OVA conjugate.
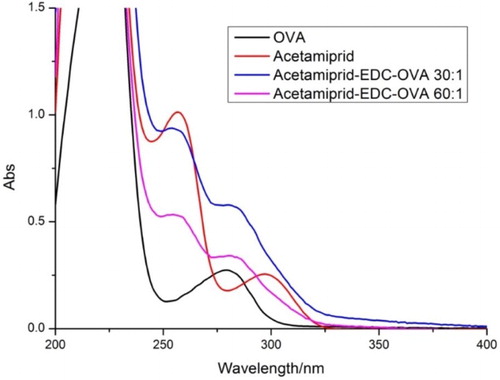
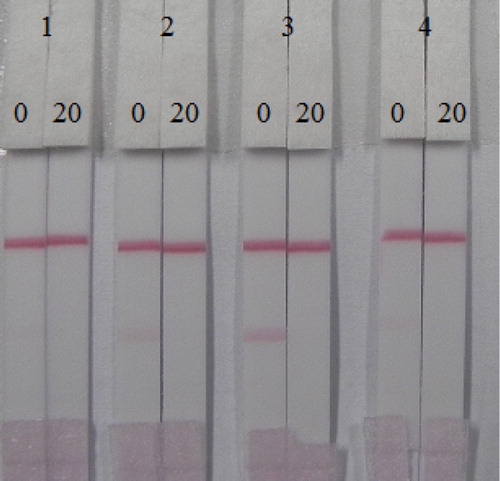
Different ratios of coating antigen were sprayed onto the T line at 0.5 mg/mL. The strips were evaluated with 0.01 M PBS pH 7.4 containing 0 or 20 ng/mL of AC. Based on the results shown in , we found that coating antigen conjugated to OVA resulted in no color development on the T line, but coating antigen conjugated to BSA produced a strong color intensity at the T line in the negative samples. Both the coating antigen conjugated to OVA and that conjugated to BSA in the positive samples (20 ng/mL), resulted in no color development at the T line. Therefore, a coating antigen that consisted of BSA: CA (1:60) was selected for further immunochromatographic strip assays as a result of the stronger color intensity of the T line with the negative sample and the absence of color on the T line with the positive sample.
Figure 5. Optimization of the immunochromatographic strip by using different coating antigen. (1) AC: OVA (1:60); (2) AC:BSA (1:60); (3) AC:BSA (1:30); and (4) AC: OVA (1:30). 0 = 0 ng/mL and 20 = 20 ng/mL.
Evaluation of the strip test
The assay sensitivity was investigated with a series of diluted AC standards. The LDL with the naked eye was set at the amount of AC producing a clearly visible in intensity of the test strip in comparison with that when no AC was added in the sample as a negative control. As shown in , the signal color on the test lines changed from strong to weak and disappeared completely at 1 ng/mL. Under the optimized detection conditions, a scanning reader was used to measure the intensity of the signal on the test zone and the corresponding optical responses curves are shown in .
Figure 6. Colloidal gold immunochromatography assay for AC. AC concentration (from left to right): 1 = 0 ng/mL, 2 = 0.1 ng/mL, 3 = 0.25 ng/mL, 4 = 0.5 ng/mL, and 5 = 1 ng/mL. C, control line. T, test line.
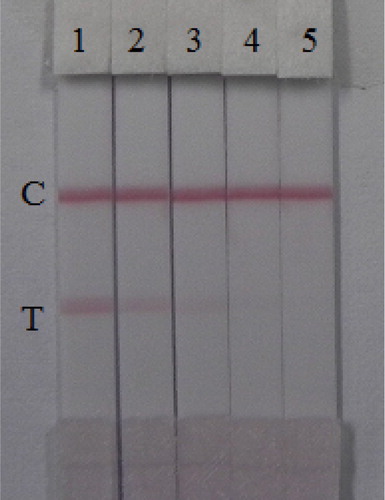
Figure 7. The result calibration curves of effect AC concentration (0, 0.1, 0.25, 0.5, and 1 ng/mL) with the color intensity. Each sample was analyzed for six replicates and error bars represent the standard deviations.
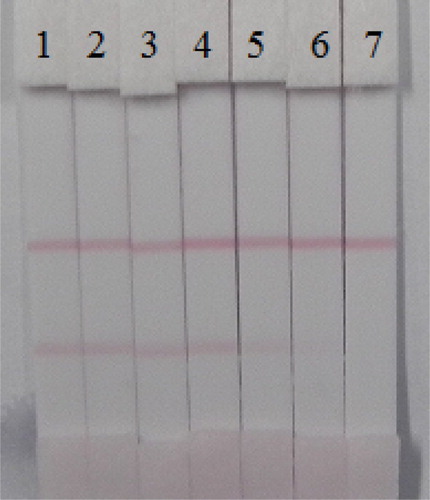
The cross-reactivity of the assay was determined by running TC at concentrations of 0, 0.005, 0.01, 0.025, 0.05, 0.1, and 0.25 ng/mL. As shown in , a strong color was observed at 0, 0.005, 0.01, and 0.025 ng/mL and no color at 0.25 ng/mL. The increases in the intensity of the red color between and were similar on the control lines of the different strips, indicating the validity of the assay.
Figure 8. The cross-reaction of the AC test strip with TC (concentrations: 1 = 0 ng/mL, 2 = 0.005 ng/mL, 3 = 0.01 ng/mL, 4= 0.025 ng/mL, 5 = 0.05 ng/mL, 6 = 0.1 ng/mL, and 7 = 0.25 ng/mL). T, test line. C, control line.
Detection of AC and TC in cucumber and apple samples
In order to evaluate the feasibility of the developed method for routine analysis, the method was used to determine AC and TC concentrations in cucumber and apple samples. Since no AC or TC residues were detected in those samples, they were spiked with different concentrations of AC and TC.
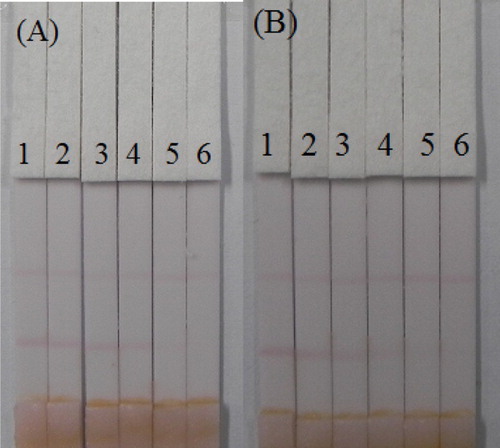
The liquid from 40 g of crushed cucumber or apple was spiked with the AC and TC standard (10 µg/mL, prepared with 0.01 M PBS pH 7.4) at final concentrations of AC in cucumber of 0.1, 0.25, 0.5, 1, 2.5, and 5 ng/mL; meanwhile for TC, the concentrations used were 0.1, 0.25, 0.5, 1, and 2.5 ng/mL. The spiked series were prepared and analyzed with the optimized test strips. The results are summarized in . The color intensity decreased as the AC and TC concentration increased. The signal color changed from strong to weak, and disappeared completely for AC at 5 ng/mL and for TC at 2.5 ng/mL. Apple is a complex food matrix, which offers disadvantages for the strip test. Therefore, apple was diluted three-fold with 0.01 M PBS pH 7.4 and then was spiked with different amount of AC (0, 0.5, 1, 2.5, 5, and 10 ng/mL) ((A)) and TC (0, 0.25, 0.5, 1, 2.5, and 5 ng/mL) ((B)). The test line disappeared with 10 ng/mL of AC and 5 ng/mL of TC in the three-fold diluted apple juice. Therefore, the cut-off values were 30 ng/mL of AC and 15 ng/mL of TC in apple.
Figure 9. Results of AC and TC detection with colloidal gold immunochromatographic strip assay spiked in cucumber. (A) Acetamiprid. (B) Thiacloprid. 1 = 0 ng/mL, 2 = 0.1 ng/mL, 3 = 0.25 ng/mL, 4 = 0.5 ng/mL, 5 = 1 ng/mL 6 = 2.5 ng/mL, and 7 = 5 ng/mL.
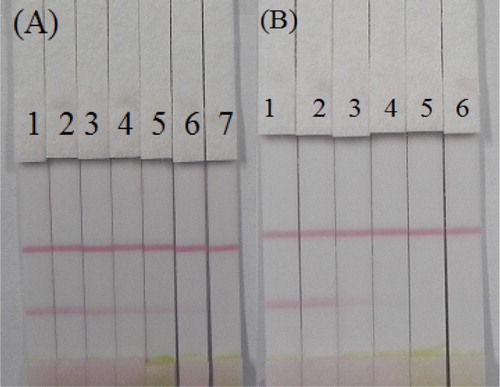
Figure 10. Determination of AC and TC with immunochromatographic strip test spiked in apple. (A) Acetamiprid (1 = 0 ng/mL, 2 = 0.5 ng/mL, 3 = 1 ng/mL, 4 = 2.5 ng/mL, 5 = 5 ng/mL, and 6 = 10 ng/mL). (B) Thiaclorid (1 = 0 ng/mL, 2 = 0.25 ng/mL, 3 = 0.5 ng/mL, 4 = 1 ng/mL, 5 = 2.5 ng/mL, and 6 = 5 ng/mL).
Conclusions
A sensitive colloidal gold-based lateral-flow immunochromatographic assay was developed for the rapid detection of AC in cucumber and apple. Ours results demonstrated that the cut-off limits of the semi-quantitative test strip for AC can be as low as 1 ng/mL in 0.01 M PBS pH 7.4, 5 ng/mL in cucumber, and 30 ng/mL in apple samples. Meanwhile, there is cross-reactivity with TC which has cut-off limits of 0.25 ng/mL in 0.01 M PBS pH 7.4, 2.5 ng/mL in cucumber, and 15 ng/mL in apple. In summary, the immunochromatographic strip test assay represents a sensitive, simple, and rapid method for detecting AC in 0.01 M PBS, cucumber, and apple samples.
Disclosure statement
No potential conflict of interest was reported by the authors.
Notes on contributors
Liqiang Liu got his ph.D in Food science in 2014 from Jiangnan University, Wuxi, China and then became a faculty in college of Food science and technology of Jiangnan University. His research interests are immunochromatographic strip design and application.
Steven Suryoprabowo was born in Indonesia and got his bachelor in Pelita Harapan University (Indonesia) then he got his master degree in food science (2014) from Jiangnan University, Wuxi, China. His research interests are monoclonal antibodies development and immunochromatographic strip test and applications.
Qiankun Zheng graduated from Nanjing Agricultural University in 1996. Currently, he works as a senior engineer in Delicious food company, China. He is good at food quality control and assurance.
Shanshan Song got her Master degree in Food science in 2012 from Jiangnan University, Wuxi, China and then became a research assistant in college of Food science and technology of Jiangnan University. Her research interests are monoclonal antibody development.
Hua Kuang got her ph.D from China Agricultural University in 2009 and then began to work as a faculty in college of Food science and technology of Jiangnan University. She is currently a full professor in food safety. Her research interests are biosensor development.
Additional information
Funding
References
- Abdel-Ghany, M. F., Hussein, L. A., El Azab, N. F., El-Khatib, A. H., & Linscheid, M. W. (2016). Simultaneous determination of eight neonicotinoid insecticide residues and two primary metabolites in cucumbers and soil by liquid chromatography-tandem mass spectrometry coupled with QuEChERS. Journal of Chromatography B, 1031, 15–28. doi: 10.1016/j.jchromb.2016.06.020
- Deng, X., Liu, L., Ma, W., Xu, C., Wang, L., & Kuang, H. (2012). Development and validation of a sandwich ELISA for quantification of peanut agglutinin (PNA) in foods. Food and Agricultural Immunology, 23(3), 265–272. doi: 10.1080/09540105.2011.617358
- Fan, L., Zhao, G., Shi, H., Liu, M., & Li, Z. (2013). A highly selective electrochemical impedance spectroscopy-based aptasensor for sensitive detection of acetamiprid. Biosensors and Bioelectronics, 43, 12–18. doi: 10.1016/j.bios.2012.11.033
- Gbylik-Sikorska, M., Sniegocki, T., & Posyniak, A. (2015). Determination of neonicotinoid insecticides and their metabolites in honey bee and honey by liquid chromatography tandem mass spectrometry. Journal of Chromatography B, 990, 132–140. doi: 10.1016/j.jchromb.2015.03.016
- Giroud, B., Vauchez, A., Vulliet, E., Wiest, L., & Bulete, A. (2013). Trace level determination of pyrethroid and neonicotinoid insecticides in beebread using acetonitrile-based extraction followed by analysis with ultra-high-performance liquid chromatography-tandem mass spectrometry. Journal of Chromatography A, 1316, 53–61. doi: 10.1016/j.chroma.2013.09.088
- Hao, C., Noestheden, M. R., Zhao, X., & Morse, D. (2016). Liquid chromatography-tandem mass spectrometry analysis of neonicotinoid pesticides and 6-chloronicotinic acid in environmental water with direct aqueous injection. Analytica Chimica Acta, 925, 43–50. doi: 10.1016/j.aca.2016.04.024
- Jeschke, P., Nauen, R., Schindler, M., & Elbert, A. (2011). Overview of the status and global strategy for neonicotinoids. Journal of Agricultural and Food Chemistry, 59(7), 2897–2908. doi: 10.1021/jf101303g
- Jovanov, P., Guzsvany, V., Franko, M., Lazic, S., Sakac, M., Saric, B., & Banjac, V. (2013). Multi-residue method for determination of selected neonicotinoid insecticides in honey using optimized dispersive liquid-liquid microextraction combined with liquid chromatography-tandem mass spectrometry. Talanta, 111, 125–133. doi: 10.1016/j.talanta.2013.02.059
- Jovanov, P., Guzsvany, V., Lazic, S., Franko, M., Sakac, M., Saric, L., & Kos, J. (2015). Development of HPLC-DAD method for determination of neonicotinoids in honey. Journal of Food Composition and Analysis, 40, 106–113. doi: 10.1016/j.jfca.2014.12.021
- Khaemba, G. W., Tochi, B. N., Mukunzi, D., Joel, I., Guo, L. L., Suryobrobowo, S., … Xu, C. L. (2016). Development of monoclonal antibody and lateral test strip for sensitive detection of clenbuterol and related beta(2)-agonists in urine samples. Food and Agricultural Immunology, 27(1), 111–127. doi: 10.1080/09540105.2015.1079598
- Kong, D. Z., Liu, L. Q., Song, S. S., Kuang, H., & Xu, C. L. (2016). Development of an immunochromatographic strip for the semi-quantitative and quantitative detection of biotin in milk and milk products. Analytical Methods, 8(7), 1595–1601. doi: 10.1039/C5AY02659H
- Kuang, H., Xing, C., Hao, C., Liu, L., Wang, L., & Xu, C. (2013). Rapid and highly sensitive detection of lead ions in drinking water based on a strip immunosensor. Sensors, 13(4), 4214–4224. doi: 10.3390/s130404214
- Liu, L. Q., Luo, L. J., Suryoprabowo, S., Peng, J., Kuang, H., & Xu, C. L. (2014). Development of an immunochromatographic strip test for rapid detection of ciprofloxacin in milk samples. Sensors, 14(9), 16785–16798. doi: 10.3390/s140917621
- Mateu-Sanchez, M., Moreno, M., Arrebola, F. J., & Vidal, J. L. M. (2003). Analysis of acetamiprid in vegetables using gas chromatography-tandem mass spectrometry. Analytical Sciences, 19(5), 701–704. doi: 10.2116/analsci.19.701
- Nauen, R., & Denholm, I. (2005). Resistance of insect pests to neonicotinoid insecticides: Current status and future prospects. Archives of Insect Biochemistry and Physiology, 58(4), 200–215. doi: 10.1002/arch.20043
- Newsome, W. H. (1986). Potential and advantages of immunochemical methods for analysis of foods. Journal - Association of Official Analytical Chemists, 69(6), 919–923.
- Shi, H., Zhao, G., Liu, M., Fan, L., & Cao, T. (2013). Aptamer-based colorimetric sensing of acetamiprid in soil samples: Sensitivity, selectivity and mechanism. Journal of Hazardous Materials, 260, 754–761. doi: 10.1016/j.jhazmat.2013.06.031
- Sun, C., Liu, L., Song, S., Kuang, H., & Xu, C. (2016). Development of a highly sensitive ELISA and immunochromatographic strip to detect pentachlorophenol. Food and Agricultural Immunology, 27(5), 689–699. doi: 10.1080/09540105.2016.1148668
- Suryoprabowo, S., Liu, L. Q., Peng, J., Kuang, H., & Xu, C. L. (2014). Development of a broad specific monoclonal antibody for fluoroquinolone analysis. Food Analytical Methods, 7(10), 2163–2168. doi: 10.1007/s12161-014-9863-1
- Suryoprabowo, S., Liu, L. Q., Peng, J., Kuang, H., & Xu, C. L. (2015). Antibody for the development of specific immunoassays to detect nadifloxacin in chicken muscles. Food and Agricultural Immunology, 26(3), 317–324. doi: 10.1080/09540105.2014.914469
- The Pesticide Manual. (1997). Agro Food Industry Hi-Tech, 8(5), 55–55.
- Tokieda, M., Ozawa, M., Kobayashi, S., & Gomyo, T. (1998). Method for determination of total residues of the insecticide acetamiprid and its metabolites in crops by gas chromatography (vol. 22, pp. 77, 1997). Journal of Pesticide Science, 23(1), 94–94.
- Uchigashima, M., Watanabe, E., Ito, S., Iwasa, S., & Miyake, S. (2012). Development of immunoassay based on monoclonal antibody reacted with the neonicotinoid insecticides clothianidin and dinotefuran. Sensors, 12(11), 15858–15872. doi: 10.3390/s121115858
- Watanabe, E., Baba, K., & Miyake, S. (2011). Analytical evaluation of enzyme-linked immunosorbent assay for neonicotinoid dinotefuran for potential application to quick and simple screening method in rice samples. Talanta, 84(4), 1107–1111. doi: 10.1016/j.talanta.2011.03.019
- Watanabe, E., Miyake, S., Baba, K., Eun, H., & Endo, S. (2006). Immunoassay for acetamiprid detection: Application to residue analysis and comparison with liquid chromatography. Analytical and Bioanalytical Chemistry, 386(5), 1441–1448. doi: 10.1007/s00216-006-0683-z
- Watanabe, E., & Miyake, S. (2013). Quantitative determination of neonicotinoid insecticide thiamethoxam in agricultural samples: A comparative verification between high-performance liquid chromatography and monoclonal antibody-based immunoassay. Food Analytical Methods, 6(2), 658–666. doi: 10.1007/s12161-012-9461-z
- Watanabe, T., Shan, G., Stoutamire, D. W., Gee, S. J., & Hammock, B. D. (2001). Development of a class-specific immunoassay for the type I pyrethroid insecticides. Analytica Chimica Acta, 444(1), 119–129. doi: 10.1016/S0003-2670(01)01163-1
- Xu, L., Peng, S., Liu, L., Song, S., Kuang, H., & Xu, C. (2016). Development of sensitive and fast immunoassays for amantadine detection. Food and Agricultural Immunology, 27(5), 678–688. doi: 10.1080/09540105.2016.1148667
- Yamamuro, T., Ohta, H., Aoyama, M., & Watanabe, D. (2014). Simultaneous determination of neonicotinoid insecticides in human serum and urine using diatomaceous earth-assisted extraction and liquid chromatography-tandem mass spectrometry. Journal of Chromatography B, 969, 85–94. doi: 10.1016/j.jchromb.2014.06.008