
ABSTRACT
Casein is a type of allergen that may elicit an allergic response in some people. This study developed a competitive lateral flow assay by using fluorescent microspheres (FMs) as label to rapidly and quantitatively detect casein in milk. The limit of detection (LOD) of casein in defatted milk was 100 ng/mL with a good linear range from 100 to 10,000 ng/mL. The average recoveries for intra- and inter-assay ranged from 89.03% to 93.47% and 87.69% to 92.73%, respectively, with corresponding coefficient of variance (CV) of 5.2–7.8% and 6.2–8.5%. The LOD and the CV of FMs lateral flow assay (FMs-LFA) were lower than those of the colloidal gold lateral flow assay used to quantitatively detect casein. Based on the results of enzyme linked immunosorbent assay, our conclusion is that FMs-LFA can be potentially used in the food industry.
Introduction
Milk is an ideal nutritional substance because it is rich in proteins. Nevertheless, milk allergen is regarded as one of the eight common food allergens (Monaci, Tregoat, van Hengel, & Anklam, Citation2006; Peng et al., Citation2013; Peng, Song, Liu, Kuang, & Xu, Citation2015). Studies have shown that allergies experienced in childhood account for approximately 2–3% during the first year, although allergies to milk normally disappear with age. However, 5–8% of children experience persistent allergies (Wal, Citation2002). Evidence indicates that these patients experience a range of symptoms, including cutaneous, respiratory, and gastrointestinal reactions as well as, in some extreme cases, anaphylaxis, or death (Luo & Bu, Citation2012). According to the Directive 2007/89/EC of the European Community (Monaci, Nørgaard, & van Hengel, Citation2010), food products containing milk allergens should be labeled compulsorily to prevent harm to people’s health.
Proteins derived from cow’s milk are potential allergens. Among these proteins, casein and lactoglobulin are the main allergens (Baumgartner, Citation2010; Wal, Citation2001). The consumption of foods containing milk, whether added deliberately or as a result of accidental contamination during manufacture, poses a threat to allergic individuals (Newsome & Scholl, Citation2012; Patrick, Hans, & Angelika, Citation2009). To prevent allergy-inducing ingredients from contaminating food products, researchers should develop a rapid method for detecting casein in food products. The methods currently used to detect the presence of milk allergens in food products mainly include enzyme linked immunosorbent assay (ELISA) (Deng et al., Citation2012; Peng et al., Citation2014a; Xuli et al., Citation2013), immunofluorescence (Young & Nelstrop, Citation1970), rocket immune-electrophoresis (Moen et al., Citation2005), time-resolved fluoroimmunoassay (Sletten, Løvberg, Moen, Skarpeid, & Egaas, Citation2005), immunosensor (Cao et al., Citation2011; Hiep et al., Citation2007), high-performance liquid chromatography (Montalbano, Segreto, Di Gerlando, Mastrangelo, & Sardina, Citation2016; Scano, Murgia, Pirisi, & Caboni, Citation2014), liquid chromatography/tandem mass spectrometry (Altendorfer et al., Citation2015; Heick, Fischer, & Pöpping, Citation2011), and polymerase chain reaction (Schulmeister et al., Citation2009). However, these methods require expensive equipment, professional operators, and long processing time. Lateral flow immunoassay (LFA) is a screening method used for on-site testing owing to its advantages of convenience (Pávai, Mihály, & Paszternák, Citation2015; Wu, Liu, et al., Citation2016), sensitivity, and speed. Colloidal gold (CG) nanoparticles are the most commonly used labeling materials to detect various analytes (Lai, Fung, Yang, Renrong, & Xiong, Citation2009; Wu, Guo, Dong, & Song, Citation2016). However, colloidal gold lateral flow immunoassay (CG-LFA) demonstrates low sensitivity.
Fluorescent microspheres (FMs) have been extensively investigated because of their excellent monodispersity, extremely high stability, and high-intensity fluorescence (Deng et al., Citation2014; Wang et al., Citation2006). In the present work, carboxyl-modified FMs were covalently conjugated with antibodies to form antibody-FMs complexes. A competitive format was selected to screen casein (Wen, Borejsza-Wysocki, Decory, & Durst, Citation2005). To our knowledge, this study is the first to report a novel method based on FMs that can sensitively detect the milk allergen casein. Fluorescent microspheres lateral flow immunoassay (FMs-LFA) was also compared with traditional CG-LFA and ELISA.
Materials and methods
Materials
FMs (diameter = 175 nm, excitation wavelength = 470 nm, emission wavelength = 525 nm, COOH concentration = 443 µeq/g) were purchased from Merck (Darmstadt, Germany). CG solution (CG nanoparticles diameter = 33 nm) was prepared in our laboratory (Peng et al., Citation2014b). Nitrocellulose membrane, absorbent pad, sample pad, and conjugate pad were purchased from Millipore (Bendford, MA, USA). N-(3-Dimethylaminopropyl)-N-ethylcarbodiimide hydrochloride (EDC), β-lactoglobulin, bovine serum albumin (BSA), ovalbumin (OVA), casein from bovine milk, and defatted milk were obtained from Sigma (St. Louis, MO, USA). Lysozyme from bovine milk was purchased from Beijing Solarbio Biological Technology Co., Ltd. Donkey anti-rabbit IgG was provided by Wuxi Zodolabs Biological Technology Co., Ltd. Rabbit-anti-casein poly-antibody (pAb) was purchased from Abcam (Cambridge, MA, USA). The ultra-heat-treated skimmed milk (Arla), ultra-heat-treated milk (Arla), and pure goat milk (Shepherd) were bought from Rainbow supermarket in Nanchang. A RIDASCREEN casein kit was purchased from R-Biopharm Company (Dieburg, Germany). The limit of detection (LOD) of the ELISA kit was 240 ng/mL. All the solvents and other chemicals were of analytical reagent grade.
Instruments
FMs-LFA reader was from Shanghai Huguo Science Instrument Co., Ltd. SkanFlexi BioAssay Reader Systems for reading CG-LFA strips was from Skannex Biotech Co., Ltd (Oslo, Norway). A BioDot XYZ platform combined with a motion controller, BioJet Quanti3000k dispenser, and AirJet Quanti3000k dispenser for solution dispensing were supplied by BioDot (Irvine, CA, USA). Vacuum drying oven was purchased from Shanghai Fuma Test Equipment Co., Ltd. (Shanghai, China). An automatic guillotine cutter was purchased from Hangzhou Fenghang Technology Co., Ltd. (Hangzhou, China).
Preparation of FMs-pAb probe
The FMs-pAb probe was prepared according to previously described methods with slight modifications (Zhang, Citation2013). Briefly, 0.15 mg of FMs was suspended in 3 mL of 0.02 M phosphate buffer (PB) at pH 5.0. A freshly prepared aqueous solution of EDC (5 mM) dissolved in PB (2.7 μL volume) was slowly added into the FMs solution prior to adding 90 μL of 0.5 mg/mL anti-casein pAb. The resulting mixture was incubated at room temperature for 2 h and gently stirred. Next, 300 μL of 10% BSA was added to block the uncombined active sites for 30 min. The reaction mixture was then centrifuged at 9000 rpm for 20 min. The supernatant was subsequently discarded, and the resultant pellets were resuspended in 300 μL of PBS (pH 7.0) containing 1% BSA, 5% sucrose, 3% trehalose, 0.4% Tween 20, and 0.1% NaN3. The resulting mixture was stored at 4 °C in the dark.
Preparation of CG-pAb probe
CG-pAb probe was prepared in our laboratory according to previously described methods (Peng et al., Citation2014), where 1 mL of 1% hydrogen tetrachloroaurate trihydrate (w/v) and 100 mL of distilled water were mixed in a flask, and then heated to boiling point. Afterwards, 1 mL of freshly made 1% solution of sodium citrate was added into the flask under constant stirring. The mixture was boiled until it turned red and no further color change occurred. Anti-casein pAb (200 µL, 25 µg/mL) was added to 2 mL of CG solution (pH 7.2) and then slowly stirred at room temperature. After 2 h, 200 µL of 1% (w/v) PEG-20,000 solution was added, and the mixture was agitated for 30 min. Subsequently, 200 µL of 10% (w/v) BSA solution was added, the mixture was stirred for another 30 min, and then centrifuged at 8000 rpm for 30 min. After centrifugation, the supernatant was discarded. Resuspension solution (PBS containing 5% sucrose, 2% trehalose, 1% PEG 20,000, 1% BSA, and 0.25% Tween-20, 200 µL) was subsequently added to dissolve the resultant pellets, and the resulting mixture was stored at 4°C until further use.
Preparation of test strip
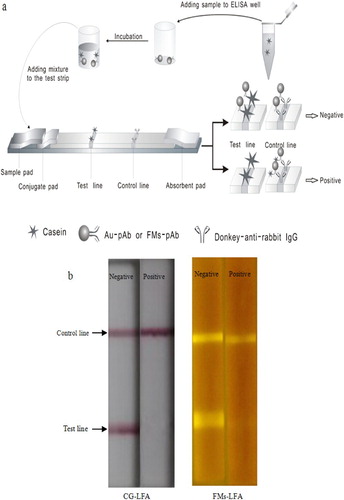
Casein (0.8 mg/mL) and donkey anti-rabbit IgG (0.5 mg/mL) were spotted onto a nitrocellulose membrane as test and control lines, respectively, and then the membrane was dried in vacuum for 2 h at 30°C. The sample pad was treated with 50 mM borate buffer (pH 7.4) containing 1% BSA, 0.5% Tween 20, and 0.05% sodium azide. The sample pad was then dried at 60°C for 2 h. The nitrocellulose membrane, absorbent pad, conjugate pad, and pretreated sample pad were assembled as a test strip ((a)).
Figure 1. (a) Competitive format structure of lateral flow assay. (b) The actual picture images of negative and positive test results of CG-LFA and FMs-LFA.
Construction of FMs-LFA and CG-LFA calibration curves
A series of standard dilution of casein was prepared at different concentrations: 0, 101, 102, 103, 104, and 105 ng/mL. Sample aliquots (100 μL) were pipetted into the ELISA well, and FM-pAb probe (4 µL) or CG-pAb probe (7 µL) was subsequently added. The test was conducted for 3 min to allow the antibody-antigen complexes to form. The complexes were then transferred into the sample well of the test strip. After 20 min, signals on the test line (ST) and the control line (SC) of the FMs-LFA strip were detected using FMs-LFA reader, and the ST and SC of the CG-LFA strip were detected using SkanFlexi BioAssay reader. All the experiments were performed in triplicate.
Evaluation of the accuracy of FMs-LFA and CG-LFA
The accuracy of FMs-LFA and CG-LFA was carried out by detecting different concentrations of casein. The milk was diluted 1 × 10⁶ times and then spiked with casein at different concentrations (1000, 5000, and 10,000 ng/mL) to calculated the recovery and coefficient of variance (CV) (Hiep et al., Citation2007). Three experiments were repeated.
Specificity of FMs-LFA
The specificity of the method was determined by detecting three concentrations (4.0, 7.0, and 9.0 μg/mL) of β-lactoglobulin, lysozyme, BSA, and OVA. PBS buffer (0.01 M) was used as negative control.
Detection of casein using the ELISA kit
Detection using the ELISA kit was performed strictly according to the manufacturer’s instructions. Briefly, 100 μL of each standard solution or prepared sample was dispensed into separated wells. All the experiments were performed in triplicate. After 10 min of incubation at room temperature, the plate was washed twice with 250 μL/well washing buffer. Then, 100 μL/well of the diluted enzyme conjugate was added and incubated for 10 min at room temperature. After two rounds of washing with 250 μL/well washing buffer, 100 μL/well of the Chromogenic substrate solution was added, and the mixture was allowed to react for 10 min at room temperature in the dark. The reaction was stopped by adding 100 μL/well of stop solution. The optical density values were determined at 450 nm within 10 min after the stop solution was added.
Detection of real samples
A total of 100 μL each of the ultra-heat-treated skimmed milk, ultra-heat-treated milk, and pure goat milk were diluted 1 × 10⁴ times to detect casein concentration. To evaluate the application of the test strip, different concentrations of casein (0, 200, 500, 2000, and 6000 ng/mL) were added to three diluted real samples and then detected using the test strip. The method of recovery was referenced previous study (Hiep et al., Citation2007).
Results and discussion
Principle of FMs-LFA and CG-LFA
The samples and FMs-pAb were incubated in microplate wells for 3 min and then pipetted into the sample well of the test strip. When the casein was included in the sample, it would bind with the FMs-pAb probe to form FMs-pAb-casein complexes and were finally captured by the donkey anti-rabbit IgG on the control line. Unbound FMs-pAb was captured by the coated antigen on the test line. The larger amount of casein contained in food samples, the lower of the signal was detected on the test line because of the competition between the free casein in the sample and the antigen immobilized on the test line.
The principle of CG-LFA is similar to that of FMs-LFA.
Linear range and sensitivity of FMs-LFA and CG-LFA
The ST/SC ratio of the negative control and positive samples were designated as B0 and B, respectively. The calibration curve of the FMs-LFA was constructed by plotting B/B0 against the logarithm of casein concentrations (). The LOD of the FMs-LFA strip was 100 ng/mL, which was calculated according to the mean value of the negative samples minus three standard deviations (SDs). The calibration curve exhibited a good linear range from 100 to 10,000 ng/mL, with a correlation coefficient (R2 = 0.9992).
Figure 2. Standard curve of CG-LFA and FMs-LFA constructed by plotting B/B0 ratio against the concentration of casein. Error bars represent standard deviations from the means (n = 3).*p < .05 for the B/B0 ratio of CG-LFA versus that of FMs-LFA. #p < .05 for the B/B0 ratio of FMs-LFA versus that of CG-LFA.
The calibration curve of the CG-LFA strip was also constructed by plotting B/B0 against the logarithm of casein concentrations. shows that the LOD of the CG-LFA strip was 818 ng/mL based on the mean value of the negative samples minus three SDs. In addition, the linear range was 900–9000 ng/mL, with a correlation coefficient (R2 = 0.9748).
Evaluation of the accuracy of FMs-LFA and CG-LFA
To evaluate the stability and precision of the FMs-LFA strip, we calculated the recovery and CV by spiking different concentrations of casein (1000, 5000, and 10,000 ng/mL) in milk which previously diluted 1 × 10⁶ times. shows the results of recovery and CV studies using FMs-LFA. The average recoveries for intra- and inter-assay ranged from 89.03% to 93.47% and 87.69% to 92.73% respectively, with corresponding CVs of 5.2% to 7.8% and 6.2% to 8.5%.
Table 1. Three spiked concentrations (1000, 5000, and 10,000 ng/mL) of casein were analyzed for intra- and inter-assay recovery studies of the FMs-LFA and the CG-LFA.
shows the results of the recovery and CV studies using CG-LFA. The average recoveries for intra- and inter-assay ranged from 79.24% to 105.3% and 85.72% to 105.6%, respectively, with corresponding CVs of 7.1–10.4% and 10.4–12.6%.
Specificity of FMs-LFA
In this study, the concentrations of casein, lysozyme, β-lactoglobulin, BSA, and OVA were 4.0, 7.0, and 9.0 μg/mL, respectively. PBS buffer (0.01 M) was used as negative control. shows that the ST/SC of lysozyme, β-lactoglobulin, BSA, and OVA was nearly similar to that of PBS buffer, which was obviously higher than that of the casein sample. These results indicated that the test strip does not cross-react with lysozyme, β-lactoglobulin, BSA, and OVA.
Figure 3. Specificity study of FMs-LFA. Concentrations of casein, lysozyme, β-lactoglobulin, BSA, and OVA were 4.0 μg/mL (A), 7.0 μg/mL (B), and 9.0 μg/mL (C), respectively. and the 0.01 M of PBS buffer was used as the negative control. Error bars represent standard deviations from the means (n = 3).*p < .05 for the ST/SC ratio of casein versus that of the four other proteins and PBS.
Reliability of the developed assay compared with the ELISA kit
The principle of the ELISA kit is based on sandwich ELISA. compares the two methods. No evident differences were observed between the two methods in terms of detection of some milk samples. However, the traditional ELISA requires approximately 3–4 h whereas LFA only requires 20 min. In addition, the LOD of ELISA is 240 ng/mL which is higher than that of LFA (100 ng/mL).
Table 2. Comparison of detection results between FMs-LFA and ELISA kit.
Detection of real samples
The ultra-heat-treated milk, ultra-heat-treated skimmed milk, and pure goat milk were diluted 1 × 10⁴ times to detect casein concentration. shows that the casein concentrations in the three milk samples were 715.2, 558.3, and 329.3 ng/mL, respectively. Different concentrations of casein (0, 200, 500, 2000, and 6000 ng/mL) were added to diluted samples to evaluate the application of the test strip. The recoveries of the three samples ranged from 88.9% to 106.6%. These results indicated that the test strip can be used to detect milk casein.
Table 3. Detection result of casein in three kinds of milk samples.
Conclusions
This study developed a rapid and sensitive LFA to detect casein by using FM-pAb probe as the detector reagent. On the basis of the casein dose–response curve, we found that the LOD of the novel assay was 100 ng/mL. The CV of the intra- and inter-assay were 5.2–7.8% and 6.2–8.5% respectively. The LOD of CG-LFA was 818 ng/mL, and the CV of the intra- and inter-assay was 7.1–10.4% and 10.4–12.6% respectively. The LOD and CV of FMs-LFA were lower than those of CG-LFA for casein detection. This study showed that the test strip can be used to detect the casein of milk from both cow and goat. No evident differences were observed between FMs-LFA and ELISA in terms of sample detection. What’s more, the advantages of the FMs-LFA over the ELISA include rapidity, low cost-effectiveness, and convenience for using by nonprofessional personnel.
Notes on contributors
Song Cheng got his bachelor degree from Lanzhou University of Technology, Lanzhou, China in 2015 and then he began to study in Nanchang University (Nanchang, China) for as a master student in food science. His research interests are immunoassay applications in food.
Yajie Yang got her master degree in food science in 2016 from Nanchang University, Nanchang, China. Her research interests are immunoassay applications in food.
Xiaoqin Ni got her master degree in Food science in 2014 from Nanchang University, Nanchang, China. Her research interests are immunochromatographic strip design and application.
Juan Peng got her PhD in food science in 2017 from Jiangnan University, Wuxi, China and then became a faculty in college of Food science and technology of Nanchang University (Nanchang, China). Her research interests are immunoassay applications in food.
Weihua Lai is a full professor of food science and technology of Nanchang University. He got his PhD in food science in 2003. His research interests are fast detection technology and food safety evaluation.
Additional information
Funding
References
- Altendorfer, I., König, S., Braukmann, A., Saenger, T., Bleck, E., Vordenbäumen, S., … Jose, J. (2015). Quantification of αS1-casein in breast milk using a targeted mass spectrometry-based approach. Journal of Pharmaceutical and Biomedical Analysis, 103, 52–58. doi: 10.1016/j.jpba.2014.10.034
- Baumgartner, S. (2010). Milk allergen detection. In Molecular biological and immunological techniques and applications for food chemists (pp. 349–357). Hoboken, NJ: John Wiley & Sons.
- Cao, Q., Zhao, H., Yang, Y., He, Y., Ding, N., Wang, J., … Wang, G. (2011). Electrochemical immunosensor for casein based on gold nanoparticles and poly (l-Arginine)/multi-walled carbon nanotubes composite film functionalized interface. Biosensors and Bioelectronics, 26(8), 3469–3474. doi: 10.1016/j.bios.2011.01.027
- Deng, X., Liu, L., Ma, W., Xu, C., Wang, L., & Kuang, H. (2012). Development and validation of a sandwich ELISA for quantification of peanut agglutinin (PNA) in foods. Food and Agricultural Immunology, 23(3), 265–272. doi: 10.1080/09540105.2011.617358
- Deng, S. L., Shan, S., Xu, C. L., Liu, D. F., Xiong, Y. H., Wei, H., & Lai, W. H. (2014). Sample preincubation strategy for sensitive and quantitative detection of clenbuterol in swine urine using a fluorescent microsphere–based immunochromatographic assay. Journal of Food Protection, 77(11), 1998–2003. doi: 10.4315/0362-028X.JFP-14-086
- Heick, J., Fischer, M., & Pöpping, B. (2011). First screening method for the simultaneous detection of seven allergens by liquid chromatography mass spectrometry. Journal of Chromatography A, 1218(7), 938–943. doi: 10.1016/j.chroma.2010.12.067
- Hiep, H. M., Endo, T., Kerman, K., Chikae, M., Kim, D. K., Yamamura, S., … Tamiya, E. (2007). A localized surface plasmon resonance based immunosensor for the detection of casein in milk. Science and Technology of Advanced Materials, 8(4), 331–338. doi: 10.1016/j.stam.2006.12.010
- Lai, W., Fung, D. Y., Yang, X., Renrong, L., & Xiong, Y. (2009). Development of a colloidal gold strip for rapid detection of ochratoxin A with mimotope peptide. Food Control, 20(9), 791–795. doi: 10.1016/j.foodcont.2008.10.007
- Luo, Y. K., & Bu, G. H. (2012). Cow’s milk allergens and technologies to control allergenicity. In Multidisciplinary approaches to allergies (pp. 409–421). Berlin: Springer.
- Moen, L. H., Sletten, G. B., Miller, I., Plassen, C., Gutleb, A. C., & Egaas, E. (2005). Rocket immunoelectrophoresis and ELISA as complementary methods for the detection of casein in foods? Food and Agricultural Immunology, 16(2), 83–90. doi: 10.1080/09540100400029928
- Monaci, L., Nørgaard, J. V., & van Hengel, A. J. (2010). Feasibility of a capillary LC/ESI-Q-TOF MS method for the detection of milk allergens in an incurred model food matrix. Analytical Methods, 2(7), 967–972. doi: 10.1039/c0ay00151a
- Monaci, L., Tregoat, V., van Hengel, A. J., & Anklam, E. (2006). Milk allergens, their characteristics and their detection in food: A review. European Food Research and Technology, 223(2), 149–179. doi: 10.1007/s00217-005-0178-8
- Montalbano, M., Segreto, R., Di Gerlando, R., Mastrangelo, S., & Sardina, M. T. (2016). Quantitative determination of casein genetic variants in goat milk: Application in Girgentana dairy goat breed. Food Chemistry, 192, 760–764. doi: 10.1016/j.foodchem.2015.07.075
- Newsome, G. A., & Scholl, P. F. (2012). Quantification of allergenic bovine milk αS1-Casein in baked goods using an intact 15n-labeled protein internal standard. Journal of Agricultural and Food Chemistry, 61(24), 5659–5668. doi: 10.1021/jf3015238
- Patrick, W., Hans, S., & Angelika, P. (2009). Determination of the bovine food allergen casein in white wines by quantitative indirect ELISA, SDS− PAGE, Western Blot and immunostaining. Journal of Agricultural and Food Chemistry, 57(18), 8399–8405. doi: 10.1021/jf9013982
- Pávai, M., Mihály, J., & Paszternák, A. (2015). pH and CO2 sensing by curcumin-coloured cellophane test strip. Food Analytical Methods, 8(9), 2243–2249. doi: 10.1007/s12161-015-0102-1
- Peng, J., Meng, X., Deng, X., Zhu, J., Kuang, H., & Xu, C. (2014a). Development of a monoclonal antibody-based sandwich ELISA for the detection of ovalbumin in foods. Food and Agricultural Immunology, 25(1), 1–8. doi: 10.1080/09540105.2012.716398
- Peng, J., Song, S., Liu, L., Kuang, H., & Xu, C. (2015). Development of sandwich ELISA and immunochromatographic strip for the detection of peanut allergen Ara h 2. Food Analytical Methods, 8(10), 2605–2611. doi: 10.1007/s12161-015-0163-1
- Peng, J., Song, S., Xu, L., Ma, W., Liu, L., Kuang, H., & Xu, C. (2013). Development of a monoclonal antibody-based sandwich ELISA for peanut allergen Ara h 1 in food. International Journal of Environmental Research and Public Health, 10(7), 2897–2905. doi: 10.3390/ijerph10072897
- Peng, T., Zhang, F. S., Yang, W. C., Li, D. X., Chen, Y., Xiong, Y. H., & Lai, W. H. (2014b). Lateral-flow assay for rapid quantitative detection of clorprenaline residue in swine urine. Journal of Food Protection, 77(10), 1824–1829. doi: 10.4315/0362-028X.JFP-14-103
- Scano, P., Murgia, A., Pirisi, F. M., & Caboni, P. (2014). A gas chromatography-mass spectrometry-based metabolomic approach for the characterization of goat milk compared with cow milk. Journal of Dairy Science, 97(10), 6057–6066. doi: 10.3168/jds.2014-8247
- Schulmeister, U., Hochwallner, H., Swoboda, I., Focke-Tejkl, M., Geller, B., Nystrand, M., … Niggemann, B. (2009). Cloning, expression, and mapping of allergenic determinants of αS1-casein, a major cow’s milk allergen. The Journal of Immunology, 182(11), 7019–7029. doi: 10.4049/jimmunol.0712366
- Sletten, G. B., Løvberg, K. E., Moen, L. H., Skarpeid, H. J., & Egaas, E. (2005). A comparison of time-resolved fluoroimmunoassay and ELISA in the detection of casein in foodstuffs. Food and Agricultural Immunology, 16(3), 235–243. doi: 10.1080/09540100500206020
- Wal, J. M. (2001). Structure and function of milk allergens. Allergy, 56(s67), 35–38. doi: 10.1111/j.1398-9995.2001.00911.x
- Wal, J. M. (2002). Cow's milk proteins/allergens. Annals of Allergy, Asthma & Immunology, 89(6), 3–10. doi: 10.1016/S1081-1206(10)62115-1
- Wang, L., Wang, K., Santra, S., Zhao, X., Hilliard, L. R., Smith, J. E., & Tan, W. (2006). Watching silica nanoparticles glow in the biological world. Analytical Chemistry, 78(3), 646–654. doi: 10.1021/ac0693619
- Wen, H. W., Borejsza-Wysocki, W., Decory, T. R., & Durst, R. A. (2005). Development of a competitive liposome-based lateral flow assay for the rapid detection of the allergenic peanut protein ara h1. Analytical and Bioanalytical Chemistry, 382(5), 1217–1226. doi: 10.1007/s00216-005-3292-3
- Wu, Y., Guo, S., Dong, Q., & Song, Y. (2016). Development of an immunochromatographic test strip for rapid simultaneous detection of enrofloxacin and ofloxacin in tissue of chicken muscle and pork. Food Analytical Methods, 9(10), 2807–2813. doi: 10.1007/s12161-016-0474-x
- Wu, C., Liu, D., Peng, T., Shan, S., Zhang, G., Xiong, Y., & Lai, W. (2016). Development of a one-step immunochromatographic assay with two cutoff values of aflatoxin M1. Food Control, 63, 11–14. doi: 10.1016/j.foodcont.2015.11.010
- Xuli, W., Weiyi, H., Ji, K., Wenpu, W., Dongsheng, H., Hui, W., … Zhigang, L. (2013). A simple and fast detection method for bovine milk residues in foods: A 2-site monoclonal antibody immunochromatography assay. Journal of Food Science, 78(3), M452–M457. doi: 10.1111/1750-3841.12051
- Young, S., & Nelstrop, A. E. (1970). The detection by immunofluorescence of casein in rat mammary glands. British Journal of Experimental Pathology, 51(1), 28–33.
- Zhang, S. (2013). Enzyme-linked fab’ fragment based competitive immunoassay for ovalbumin in hot-processed food. Journal of Immunoassay & Immunochemistry, 34(4), 393–403. doi: 10.1080/15321819.2012.755629