
ABSTRACT
An immunochromatographic strip was developed for the determination of alternariol (AOH) using both semi-quantitative and quantitative methods based on a sensitive monoclonal antibody we produced. With AOH-spiked samples, the visual limit of detection for cereal and juice were 160 ng/g and 25 ng/mL, and the cut-off values were 640 ng/g and 100 ng/mL, respectively. For quantitative analysis based on a strip scan reader, the calculated limit of detection was 15.5–19.4 ng/g for cereal and 2.8–3.5 ng/mL for fruit juice. The recovery rates ranged from 116% to 125%, and 113% to 123%, respectively. Therefore, this method was effective for AOH detection and suitable for on-site detection and rapid screening of samples.
Introduction
Alternaria species are widely distributed in nature and Alternaria alternata is the most common species responsible for food contamination (Logrieco, Moretti, & Solfrizzo, Citation2009). Alternariol (AOH) is one of the major Alternaria mycotoxins, and is mainly produced by A. alternata and some other species of the Alternaria genus (Logrieco et al., Citation2009; Ostry, Citation2008). AOH belongs to the dibenzopyrone class of compounds together with alternariol methyl ether (AME), altenuisol, and altenuene. AOH is mutagenic and carcinogenic, as is AME (EFSA Panel on Contaminants in the Food Chain (CONTAM), Citation2011; Fleck, Burkhardt, Pfeiffer, & Metzler, Citation2012; Solhaug, Eriksen, & Holme, Citation2016). As these toxic substances are a threat to human health, AOH has been reported in many foods including fruits, vegetables, cereals, and drinks (Broggi et al., Citation2013; Lau et al., Citation2003; Oviedo, Barros, Chulze, & Ramirez, Citation2012; Scott, Zhao, Feng, & Lau, Citation2012).
Analytical methods developed for the determination of AOH include thin-layer chromatography, liquid chromatography, and gas chromatography (Pavon et al., Citation2012; Rodriguez-Carrasco, Manes, Berrada, & Juan, Citation2016; Ruan, Diao, Zhang, Zhang, & Liu, Citation2016; Scott, Citation2001). However, these costly methods require trained personnel, sophisticated instruments, and extensive sample cleanup. Immunoassays are effective in mycotoxin detection (Kong et al., Citation2016; Li, Wang, & Guo, Citation2012). Enzyme-linked immunosorbent assay (ELISA) is a sensitive and high-throughput method for mycotoxin analysis (Kong, Xie, et al., Citation2017). Ackermann and Burkin developed an enzyme immunoassay for AOH determination based on monoclonal and polyclonal antibodies (Ackermann et al., Citation2011; Burkin & Kononenko, Citation2011). Compared with the ELISA method, the immunochromatographic assay is a rapid, simple, and instrument-free diagnostic tool for on-site screening with qualitative/semi-quantitative detection ability and will become the new trend for sample analysis (Kong, Liu, Song, Kuang, & Xu, Citation2016a).
In this study, we prepared a monoclonal antibody (mAb) and used it to develop an immunochromatographic assay for the detection of AOH in cereal and fruit juice samples.
Materials and methods
Chemicals
Alternariol (AOH), AME, tenuazonic acid (TEA), aflatoxin B1 (AFB1), aflatoxin M1 (AFM1), deoxynivalenol (DON), zearalenone (ZEN), and ochratoxin A (OTA) were obtained from J&K Scientific Ltd. (Shanghai, China). Bovine serum albumin (BSA) and carbonyldimidazole (CDI) were obtained from Sigma (St. Louis, MO, USA). Goat anti-mouse immunoglobulin (IgG) antibody was purchased from Jackson ImmunoResearch Laboratories (West Grove, PA, USA). Other reagents and chemicals were acquired from the National Pharmaceutical Group Chemical Reagent Co., Ltd. (Shanghai, China).
Nitrocellulose (NC) high-flow-plus membrane (Pura-bind RP) was obtained from Whatman-Xinhua Filter Paper Co. (Hangzhou, China). Sample pad (CB-SB08), polyvinylchloride (PVC) backing card, and absorption pad (SX18) were supplied by Goldbio Tech Co. (Shanghai, China). Coating antigens and mAb (No. 4H7) were generated in our laboratory.
All buffer solutions were prepared with ultrapure water (Milli-Q purification system, Merck-Millipore Co., Darmstadt, Germany). AirJet Quanti 3000™ and BioJet Quanti 3000™ were used as dispensers (Xinqidian Gene-technology Co. Ltd., Beijing, China), and the strip cutting instrument was CM 4000 (Gene, Shanghai, China). The strip scan reader was provided by Huaan Magnech Bio-Tech Co., Ltd. (Beijing, China).
Preparation of coating antigen and anti-AOH mAb
AOH was conjugated with BSA to prepare a suitable coating antigen for the immunochromatographic strip. AOH was first dissolved in dry dimethyl sulfoxide at 5 mg/mL and BSA was dissolved in 0.1 M sodium carbonate-bicarbonate buffer (CB, pH 9.6) at 8 mg/mL. The antigens were synthesized by two ways. For antigen 1 (A 1), AOH was conjugated by the CDI method (Liu, Yu, He, & Xu, Citation2007). One milligram AOH was added to 8 mg CDI and reacted at 37°C for 4 h. The reacted solution was then added into an appropriate BSA solution at a reaction ratio of 60:1 (A 1-1) and 40:1 (A 1-2), and reacted at room temperature for 12 h with stirring. For antigen 2 (A 2), AOH was conjugated with BSA by formaldehyde condensation (Ackermann et al., Citation2011; Duan et al., Citation2009). One milligram of AOH, 300 µL methanol, 700 µL formaldehyde (37%) and an appropriate amount of BSA (with reaction ratios of 60:1 for A 2-1 and 40:1 for A 2-2) were mixed together immediately and incubated at 37°C for 6 h under stirring. Both of the conjugates were dialyzed against 0.01 M phosphate-buffered saline (PBS) for 3 d in the dark.
The anti-AOH mAb was prepared in our laboratory and purified via the caprylic acid-ammonium sulfate precipitation method (Kuang et al., Citation2013). The mAb was characterized by indirect competitive ELISA (ic-ELISA), which is similar to conventional protocols (Kong et al., Citation2015). The limit of detection (LOD), 50% inhibition concentration (IC50) value, and cross-reactivity (CR) were determined for further development of the immunochromatographic strip (Liu, Yan, Zhang, Kuang, & Xu, Citation2015).
Preparation of the immunochromatographic strip
The gold nanoparticle (GNP)-labelled mAb was prepared in our lab. GNPs were synthesized as previously described (Feng et al., Citation2015) and the GNPs were conjugated with the mAb using the static electricity adsorption method (Kong, Liu, Song, Kuang, & Xu, Citation2017). Ten milliliters of GNP solution (1 nM) were adjusted with 40 µL K2CO3 (0.1 M), and then conjugated with 100 µg mAb. The reaction proceeded for 1 h at room temperature and then 1 mL 0.5% BSA (w/v) was added dropwise to block and stabilize the GNP-labeled mAb. After 2 h incubation at room temperature, the solution was centrifuged at 7000 × g for 30 min. The precipitate was washed three times with 0.02 M PBS (containing 5% sucrose, 1% BSA, and 0.5% PEG 6000, pH 7.4) and then dissolved in 1 mL of 0.02 M PBS (containing 0.02% NaN3), and stored at 4°C.
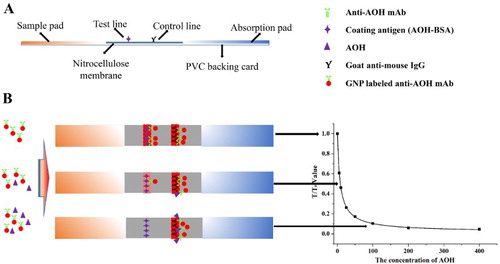
The immunochromatographic strip consisted of four parts. The PVC backing card formed the base of the strip and the NC membrane was attached in the middle of this PVC backing card. The sample pad and absorption pad were attached at each end of the PVC backing card and both overlapped the NC membrane by 2 mm ((A)). Before the fabrication of the strip, the sample pad was first immersed in 0.01 M PBS (containing 1% BSA and 0.2% Tween-20) and dried at 37°C for 4 h to minimize nonspecific binding and matrix interference (Liu, Xing, Yan, Kuang, & Xu, Citation2014). Goat anti-mouse IgG antibody (0.5 mg/mL) was sprayed onto the NC membrane adjacent to the absorption pad at 1 µL/cm with a membrane dispenser (Xinqidian Gene-Technology Co. Ltd., Beijing, China) to form the control line (C line). The coating antigen was sprayed onto the NC membrane adjacent to the sample pad at 1 µL/cm for the formation of the test line (T line). The membrane was then dried at 37°C for 30 min and cut into individual test strips with a width of 3 mm for further tests.
Figure 1. Principle of the immunochromatographic strip detection: (A) composition of the lateral-flow immunochromatographic strip, and (B) strip detection with samples.
Principle and characterization of the immunochromatographic strip
The immunochromatographic strip was analyzed based on the antibody–antigen reaction. For sample determination, the sample extraction solution was first mixed with GNP-labelled mAb and reacted for 5 min. The mixture was then added to the sample pad, and migrated towards the absorbent pad. Five minutes later, the results could be read with the naked eye (Guo et al., Citation2015).
The color intensity of the T line is inversely proportional to the concentration of AOH in the sample extraction solution. This is because the free AOH in the sample can first conjugate with the GNP-labelled mAb, leaving less free GNP-labelled mAb to be captured by the coating antigens on the T line. As both the free and conjugated mAb can be captured by the goat anti-mouse IgG antibody, the C line should always appear; if not, this indicates that the procedure was incorrectly performed or the strip was poorly assembled.
The sensitivity of the immunochromatographic strip was confirmed by a series of AOH samples of different concentrations. For semi-quantitative analysis, the results were obtained with the naked eye. With different AOH concentrations, the visual limit of detection (vLOD) value was defined as the lowest concentration that resulted in a weaker T line color intensity than the negative sample. The cut-off value was defined as the threshold concentration that resulted in the disappearance of the T line (Kong, Liu, Song, Kuang, & Xu, Citation2016b). For quantitative analysis, the color intensity of the T line with different AOH concentrations was measured using a strip scan reader. The T/T0 value was defined as the ratio of the optical density of the T line between the positive sample and the negative sample. The standard curve was confirmed with T/T0 value as ordinate and the AOH concentration as abscissa. The calculated limit of detection (cLOD) was defined as the 10% inhibition concentration (IC10) from this curve (Kong et al., Citation2016; Kong et al., Citation2016a) ((B)).
Sample analysis
Two kinds of AOH-negative cereal samples (corn and wheat) were finely ground and spiked with different AOH concentrations added to 5 g of sample. Each sample was then extracted with 12 mL acetonitrile/water (8:2, v/v), shaken vigorously for 5 min, and centrifuged at 6000 × g for 10 min. The supernatant was diluted with PBS at a ratio of 1:3 for further analyses. Two kinds of AOH-negative fruit juice (apple juice and orange juice) were spiked with different AOH concentrations and analyzed directly using the strip.
Results and discussion
Characterization of coating antigen and mAb
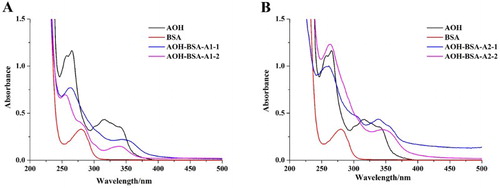
Prepared AOH-BSA coating antigens were characterized by UV–VIS spectroscopy (). BSA exhibits a characteristic peak at 278 nm and AOH has characteristic peaks at 257 and 265 nm and a wide peak at ∼316 nm. For the coating antigens, characteristic peaks could be recognized at 263, 280, and 300 nm and a wide peak at ∼345 nm. As free AOH was removed from the coating antigens by dialysis, these results confirmed that AOH was successfully conjugated with BSA.
Figure 2. The UV–VIS spectra of coating antigens (AOH-BSA): (A) coating antigens conjugated by carbonyldimidazole method, and (B) coating antigens conjugated by formaldehyde condensation.
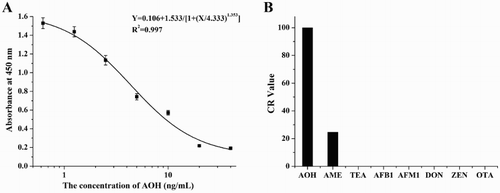
The standard curve for anti-AOH mAb was established by ic-ELISA as y = 0.106 + 1.533/[1 + (x/4.333)1.353], and the linear regression correlation coefficient (R2) was 0.997 ((A)). The corresponding IC50 value was 4.333 ng/mL and the LOD value was 0.675 ng/mL. In addition, this mAb had no CR with many other toxins such as TEA, AFB1, AFM1, DON, ZEN, and OTA but 24.6% CR with AME ((B)).
Figure 3. The Characterization of anti-AOH mAb: (A) The standard curve for anti-AOH mAb, and (B) the cross-reactivity for anti-AOH mAb.
Optimization of the immunochromatographic strip
For immunochromatographic strip analysis, the reaction ratio and concentration of the coating antigen, and the GNP-labeled mAb dose would affect the detection sensitivity.
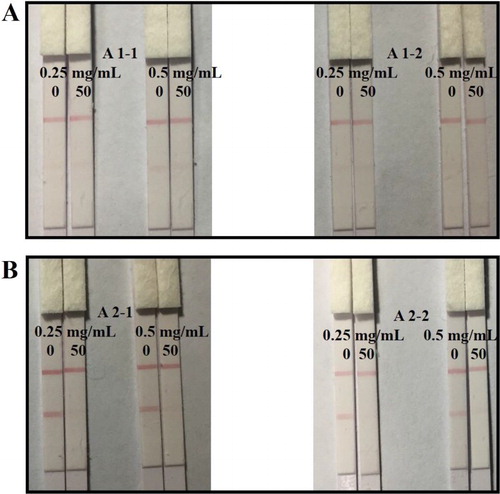
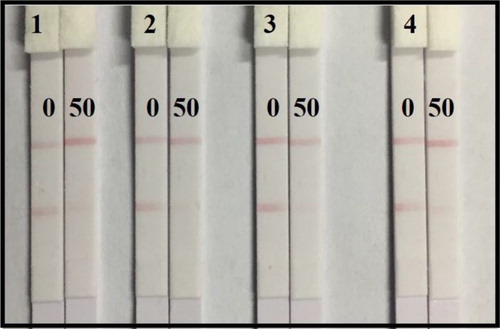
Four coating antigens prepared by different synthetic methods with different reaction ratios were optimized with two coating antigen concentrations (0.25 and 0.5 mg/mL). The strips were evaluated with 0.01 M PBS containing 0 or 50 ng/mL AOH. As shown in , the results demonstrate that the coating antigen synthesized by formaldehyde condensation ((B), A 2) had a significantly higher appetency than that synthesized by the carbonyldimidazole method (A 1) with deeper color intensity at the T line with a negative sample (0 ng/mL). In addition, the coating antigen synthesized with a higher reaction ratio (A 2-1, 60:1) could take deeper color intensity at the T line than that using a lower reaction ratio (A 2-2, 40:1) at the same coating antigen concentration with a negative sample. For a positive sample (50 ng/mL), an obvious lighter color intensity at the T line could be observed with coating antigen A 2. In order to make an obvious comparison, coating antigen A 2-1 was chosen. Even though the higher coating antigen concentration lead to a deeper color density, a better inhibitory effect with the positive sample (50 ng/mL) could be observed at a concentration as low as 0.25 mg/mL with weaker color intensity of the T line. This result showed that a more sensitive detection could be achieved at a concentration of 0.25 mg/mL with coating antigen A 2-1.
Figure 4. Optimization of the immunochromatographic strip with coating antigen under different reaction ratio and concentration: (A) coating antigen A 1 with different concentration of 0.25 and 0.5 mg/mL, (B) coating antigen A 2 with different concentration of 0.25 and 0.5 mg/mL. Negative sample: the left with 0 ng/mL AOH in PBS; Positive sample: the right with 50 ng/mL AOH in PBS.
The concentration of GNP-labeled mAb would affect the color intensity of both the T and C line and even affected the analytic sensitivity of the strip. The prepared GNP-labeled mAb was diluted by resuspending under concentrations of 8%, 12%, 16%, and 20% for optimization. Fifty microliters of each of these detection solutions was mixed with AOH-negative and positive samples (0 and 50 ng/mL). For negative samples, the color intensity of both the T and C line become deeper with increases in the GNP-labeled mAb concentration. However, the determination sensitivity was worse at higher concentrations of GNP-labeled mAb. At concentrations of 16% and 20%, the T line showed a deeper red line than at concentrations of 8% and 12% with a positive sample. The color intensity of the T line was weaker at 8% than at 12%. Therefore, 12% GNP-labeled mAb was selected because of its better sensitivity and production of a marked comparison on the T line between negative and positive samples ().
Figure 5. Optimization of the immunochromatographic strip with GNP-labeled mAb concentration: (1) With GNP-labeled mAb concentration of 8%, (2) with GNP-labeled mAb concentration of 12%, (3) with GNP-labeled mAb concentration of 16%, and (4) with GNP-labeled mAb concentration of 20%. Negative sample: the left with 0 ng/mL AOH in PBS; Positive sample: the right with 50 ng/mL AOH in PBS.
Consequently, coating antigen A 2-1 with a reaction ratio of 60:1 was selected for strip preparation and the best concentration of coating antigen on the T line was 0.25 mg/mL. For sample analysis, the GNP-labeled mAb concentration was 12%.
Sample analysis
For cereal samples (corn and wheat), AOH was spiked at concentrations of 0, 40, 80, 160, 320, 640, 1280, and 2560 ng/g, and AME was spiked at 5000 ng/g. For juice samples (apple and orange juice), AOH was spiked at concentrations of 0, 5, 10, 25, 50, 100, 200, and 400 ng/mL, and AME was spiked at 5000 ng/g. The samples were then prepared for strip analysis by the naked eye using a strip scan reader. For naked eye analysis, the vLOD and cut-off value for cereal samples were 160 and 640 ng/g, and for juice samples were 25 and 100 ng/mL, respectively. No inhibitory effect could be observed with AME in the samples (). The standard curve was established using a strip scan reader and the cLOD values for cereal samples (corn and wheat) were 15.5 and 19.4 ng/g, and for juice samples (apple juice and orange juice) were 2.8 and 3.5 ng/mL, respectively (). Subsequently, 100, 400, and 800 ng/g AOH and 15, 50, and 150 ng/mL of AOH were spiked into cereal and juice samples and analyzed using strips. Each detection was repeated six times and the results are shown in . The recovery rates of AOH-spiked samples ranged from 116% to 125% for cereal and 113% to 123% for fruit juice.
Figure 6. The sample analysis of immunochromatographic strip: (A) the AOH-spiked corn sample: (1) 0 ng/g; (2) 40 ng/g; (3) 80 ng/g; (4) 160 ng/g; (5) 320 ng/g; (6) 640 ng/g; (7) 1280 ng/g; (8) 2560 ng/g; (9) AME 5000 ng/g, (B) the AOH-spiked wheat sample: (1) 0 ng/g; (2) 40 ng/g; (3) 80 ng/g; (4) 160 ng/g; (5) 320 ng/g; (6) 640 ng/g; (7) 1280 ng/g; (8) 2560 ng/g; (9) AME 5000 ng/g, (C) the AOH-spiked apple juice sample: (1) 0 ng/g; (2) 5 ng/g; (3) 10 ng/g; (4) 25 ng/g; (5) 50 ng/g; (6) 100 ng/g; (7) 200 ng/g; (8) 400 ng/g; (9) AME 5000 ng/g, and (D) the AOH-spiked apple juice sample: (1) 0 ng/g; (2) 5 ng/g; (3) 10 ng/g; (4) 25 ng/g; (5) 50 ng/g; (6) 100 ng/g; (7) 200 ng/g; (8) 400 ng/g; (9) AME 5000 ng/g.
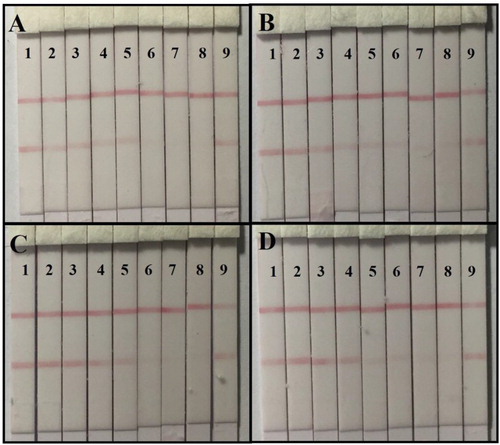
Figure 7. The standard curve of sample analysis by strip scan reader: (A) cereal samples, and (B) fruit juice samples.
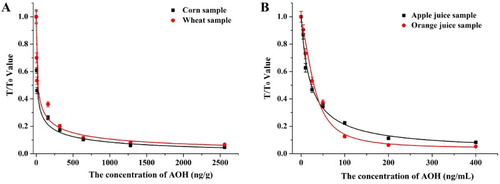
Table 1. The spiked sample analysis with immunochromatographic strip (n = 6).
With fruit juice samples, the color intensity of the T line was deeper than in cereal samples at the same AOH concentration. This result may be caused by the organic solvent (acetonitrile) used in the cereal sample extraction process, which affected the inhibitory effect and affinity of the antibody–antigen reaction (Kong, Xie, et al., Citation2017). Compared with the traditional ELISA, an immunochromatographic strip cannot produce such a sensitive result. For semi-quantitative analysis, results could only be detected as negative (<160 ng/g for cereal and < 25 ng/mL of juice), weakly positive (160–640 ng/g for cereal and 25–100 ng/mL for juice), and positive (>640 ng/g for cereal and >100 ng/mL for juice) with the naked eye. However, this method was a quick and easy method that could easily be used by most people. In order to avoid the inaccurate observation of individual differences and to provide exact results, a strip scan reader can be used for sample analysis. Therefore, the immunochromatographic strip is a convenient and rapid method for on-site analysis and sample screening.
Conclusion
We developed an immunochromatographic strip that can be used for both semi-quantitative and quantitative analysis of cereal and fruit juice samples. After optimization of the immunochromatographic strip, the vLOD value and the cut-off value for cereal samples were 160 and 640 ng/g, and for fruit juice samples they were 25 and 100 ng/mL, respectively. Meanwhile, the cLOD values were sensitive for cereal samples (corn, 15.5 ng/g; wheat, 19.4 ng/g) and juice samples (apple juice, 2.8 ng/mL; orange juice, 3.5 ng/mL). Therefore, this newly developed immunoassay method provides a convenient method that is suitable for on-site analysis and mass sample screening and could play a significant role in future analytical applications.
Disclosure statement
No potential conflict of interest was reported by the authors.
Notes on contributors
Dezhao Kong got his bachelor from Nanjing University Of Finance & Economics, Nanjing, China in 2012 and then he began to study in Jiangnan University(Wuxi, China) for as a ph.D student in food science. His research interests are immunoassay applications in food.
Zhengjun Xie is a full professor of Food science and technology of Jiangnan University. He got his ph.D in food science in 2014. His research interests are fast detection technology and food safety evaluation.
Liqiang Liu got his ph.D in Food science in 2014 from Jiangnan University, Wuxi, China and then became a faculty in college of Food science and technology of Jiangnan University. His research interests are immunochromatographic strip design and application.
Shanshan Song got her Master degree in Food science in 2012 from Jiangnan University, Wuxi, China and then became a research assistant in college of Food science and technology of Jiangnan University. Her research interests are monoclonal antibody development.
Qiankun Zheng graduated from Nanjing Agricultural University in 1996. Currently, he works as a senior engineer in Delicious food company, China. He is good at food quality control and assurance.
Hua Kuang got her ph.D from China Agricultural University in 2009 and then began to work as a faculty in college of Food science and technology of Jiangnan University. She is currently a full professor in food safety. Her research interests are biosensor development.
Additional information
Funding
References
- Ackermann, Y., Curtui, V., Dietrich, R., Gross, M., Latif, H., Maertlbauer, E., & Usleber, E. (2011). Widespread occurrence of low levels of alternariol in apple and tomato products, as determined by comparative immunochemical assessment using monoclonal and polyclonal antibodies. Journal of Agricultural and Food Chemistry, 59(12), 6360–6368. doi: 10.1021/jf201516f
- Broggi, L., Reynoso, C., Resnik, S., Martinez, F., Drunday, V., & Bernal, A. R. (2013). Occurrence of alternariol and alternariol monomethyl ether in beverages from the entre Rios province market, Argentina. Mycotoxin Research, 29(1), 17–22. doi: 10.1007/s12550-012-0147-6
- Burkin, A. A., & Kononenko, G. P. (2011). Enzyme immunoassay of alternariol for the assessment of risk of agricultural products contamination. Applied Biochemistry and Microbiology, 47(1), 72–76. doi: 10.1134/S0003683811010030
- Duan, Z. H., Lin, Z. S., Yao, H. R., Gao, Y. H., Zhang, K., Zhao, S. Q., & Zhu, Z. Y. (2009). Preparation of artificial antigen and egg yolk-derived immunoglobulin (IgY) of citrinin for enzyme-linked immunosorbent assay. Biomedical and Environmental Sciences, 22(3), 237–243. doi: 10.1016/S0895-3988(09)60051-9
- EFSA Panel on Contaminants in the Food Chain (CONTAM) (2011). Scientific opinion on the risks for animal and public health related to the presence of alternaria toxins in feed and food. EFSA Journal, 9(10), 2407–n/a. doi: 10.2903/j.efsa.2011.2407
- Feng, M., Kong, D. Z., Wang, W. B., Liu, L. Q., Song, S. S., & Xu, C. L. (2015). Development of an immunochromatographic strip for rapid detection of Pantoea stewartii subsp. stewartii. Sensors, 15(2), 4291–4301. doi: 10.3390/s150204291
- Fleck, S. C., Burkhardt, B., Pfeiffer, E., & Metzler, M. (2012). Alternaria toxins: Altertoxin II is a much stronger mutagen and DNA strand breaking mycotoxin than alternariol and its methyl ether in cultured mammalian cells. Toxicology Letters, 214(1), 27–32. doi: 10.1016/j.toxlet.2012.08.003
- Guo, J. N., Liu, L. Q., Xue, F., Xing, C. R., Song, S. S., Kuang, H., & Xu, C. L. (2015). Development of a monoclonal antibody-based immunochromatographic strip for cephalexin. Food and Agricultural Immunology, 26(2), 282–292. doi: 10.1080/09540105.2014.907242
- Kong, N., Guo, L. L., Guan, D. D., Liu, L. Q., Kuang, H., & Xu, C. L. (2015). An ultrasensitive ELISA for medroxyprogesterone residues in fish tissues based on a structure-specific hapten. Food Analytical Methods, 8(6), 1382–1389. doi: 10.1007/s12161-014-0023-4
- Kong, D. Z., Liu, L. Q., Song, S. S., Kuang, H., & Xu, C. L. (2016a). Development of an immunochromatographic strip for the semi-quantitative and quantitative detection of biotin in milk and milk products. Analytical Methods, 8(7), 1595–1601. doi: 10.1039/C5AY02659H
- Kong, D. Z., Liu, L. Q., Song, S. S., Kuang, H., & Xu, C. L. (2016b). Development of ic-ELISA and lateral-flow immunochromatographic assay strip for the detection of folic acid in energy drinks and milk samples. Food and Agricultural Immunology, 27(6), 841–854. doi: 10.1080/09540105.2016.1183600
- Kong, D. Z., Liu, L. Q., Song, S. S., Kuang, H., & Xu, C. L. (2017). Development of sensitive, rapid, and effective immunoassays for the detection of vitamin B-12 in fortified food and nutritional supplements. Food Analytical Methods, 10(1), 10–18. doi: 10.1007/s12161-016-0543-1
- Kong, D., Liu, L., Song, S., Suryoprabowo, S., Li, A., Kuang, H., … Xu, C. (2016). A gold nanoparticle-based semi-quantitative and quantitative ultrasensitive paper sensor for the detection of twenty mycotoxins. Nanoscale, 8(9), 5245–5253. doi: 10.1039/C5NR09171C
- Kong, D. Z., Xie, Z. J., Liu, L. Q., Song, S. S., Kuang, H., Cui, G., & Xu, C. L. (2017). Development of indirect competitive ELISA and lateral-flow immunochromatographic assay strip for the detection of sterigmatocystin in cereal products. Food and Agricultural Immunology, 28(2), 260–273. doi: 10.1080/09540105.2016.1263985
- Kuang, H., Xing, C. R., Hao, C. L., Liu, L. Q., Wang, L. B., & Xu, C. L. (2013). Rapid and highly sensitive detection of lead ions in drinking water based on a strip immunosensor. Sensors, 13(4), 4214–4224. doi: 10.3390/s130404214
- Lau, B. P. Y., Scott, P. M., Lewis, D. A., Kanhere, S. R., Cleroux, C., & Roscoe, V. A. (2003). Liquid chromatography-mass spectrometry and liquid chromatography-tandem mass spectrometry of the altemaria mycotoxins alternariol and alternariol monomethyl, ether in fruit juices and beverages. Journal of Chromatography A, 998(1–2), 119–131. doi: 10.1016/S0021-9673(03)00606-X
- Liu, L. Q., Xing, C. R., Yan, H. J., Kuang, H., & Xu, C. L. (2014). Development of an ELISA and immunochromatographic strip for highly sensitive detection of microcystin-LR. Sensors, 14(8), 14672–14685. doi: 10.3390/s140814672
- Liu, L. Q., Yan, H. J., Zhang, X., Kuang, H., & Xu, C. L. (2015). Development of an anti-chlorothalonil monoclonal antibody based on a novel designed hapten. Food and Agricultural Immunology, 26(3), 410–419. doi: 10.1080/09540105.2014.938319
- Liu, R., Yu, Z., He, Q., & Xu, Y. (2007). Preparation and identification of a monoclonal antibody against citrinin. Journal of Hygiene Research, 36(2), 190–193.
- Li, Y. N., Wang, Y. Y., & Guo, Y. H. (2012). Preparation of synthetic antigen and monoclonal antibody for indirect competitive ELISA of citrinin. Food and Agricultural Immunology, 23(2), 145–156. doi: 10.1080/09540105.2011.606562
- Logrieco, A., Moretti, A., & Solfrizzo, M. (2009). Alternaria toxins and plant diseases: An overview of origin, occurrence and risks. World Mycotoxin Journal, 2(2), 129–140. doi: 10.3920/WMJ2009.1145
- Ostry, V. (2008). Alternaria mycotoxins: An overview of chemical characterization, producers, toxicity, analysis and occurrence in foodstuffs. World Mycotoxin Journal, 1(2), 175–188. doi: 10.3920/WMJ2008.x013
- Oviedo, M. S., Barros, G. G., Chulze, S. N., & Ramirez, M. L. (2012). Natural occurrence of alternariol and alternariol monomethyl ether in soya beans. Mycotoxin Research, 28(3), 169–174. doi: 10.1007/s12550-012-0132-0
- Pavon, M. A., Luna, A., de la Cruz, S., Gonzalez, I., Martin, R., & Garcia, T. (2012). PCR-based assay for the detection of alternaria species and correlation with HPLC determination of altenuene, alternariol and alternariol monomethyl ether production in tomato products. Food Control, 25(1), 45–52. doi: 10.1016/j.foodcont.2011.10.009
- Rodriguez-Carrasco, Y., Manes, J., Berrada, H., & Juan, C. (2016). Development and validation of a LC-ESI-MS/MS method for the determination of alternaria toxins alternariol, alternariol methyl-ether and tentoxin in tomato and tomato-based products. Toxins, 8(11), doi:10.3390/toxins8110328
- Ruan, C. Q., Diao, X., Zhang, H., Zhang, L. Y., & Liu, C. L. (2016). Development of a dispersive liquid-liquid microextraction technique for the analysis of citrinin, alternariol and alternariol monomethyl ether in fruit juices. Analytical Methods, 8(44), 7944–7950. doi: 10.1039/C6AY02456D
- Scott, P. M. (2001). Analysis of agricultural commodities and foods for alternaria mycotoxins. Journal of Aoac International, 84(6), 1809–1817.
- Scott, P. M., Zhao, W., Feng, S., & Lau, B. P. Y. (2012). Alternaria toxins alternariol and alternariol monomethyl ether in grain foods in Canada. Mycotoxin Research, 28(4), 261–266. doi: 10.1007/s12550-012-0141-z
- Solhaug, A., Eriksen, G. S., & Holme, J. A. (2016). Mechanisms of action and toxicity of the mycotoxin alternariol: A review. Basic & Clinical Pharmacology & Toxicology, 119(6), 533–539. doi: 10.1111/bcpt.12635