
ABSTRACT
A lateral-flow immunochromatographic assay (ICA) strip was developed for determination of tenuazonic acid (TeA) using both semi-quantitative and quantitative methods. The ICA strip was based on produced anti-TeA monoclonal antibody, and could be used for TeA analysis in cereal and fruit juice, with visual limits of detection of 1600 ng/g and 400 ng/mL, and cut-off values of 6400 ng/g and 3200 ng/mL, respectively. The calculated limits of detection values were 126.4 ng/g and 65.3 ng/mL for wheat and apple juice samples, respectively. The recovery rates ranged from 90% to 129%. In summary, the developed strip was effective for TeA detection and would be suitable for on-site detection and rapid screening of samples.
Introduction
Tenuazonic acid (TeA) is a mycotoxin which is produced by Alternaria spp., Pyricularia oryzae and Phoma sorghina (Barkai-Golan & Paster, Citation2008). TeA is the most toxic Alternaria mycotoxin (Ostry, Citation2008) and has carcinogenic, cytotoxic and phytotoxic properties and is acutely toxic in mammals (Asam et al., Citation2013; Lee, Patriarca, & Magan, Citation2015; Zhou & Qiang, Citation2008). Long-time exposure can cause chronic poisoning and lead to circulatory failure and even death. TeA has been found to exist widely in cereals, vegetables, fruit, seeds and processed products, such as beverages and spices (Asam & Rychlik, Citation2013; Hoevelmann, Hickert, Cramer, & Humpf, Citation2016; Lopez et al., Citation2016; Oliveira et al., Citation2017). In order to ensure elimination of this food safety hazard, it is necessary to develop a rapid and accurate method for detection of TeA in foods.
Common analytical methods for TeA detection include polymerase chain reaction and various chromatographic methods, including thin-layer chromatography (Fabrega, Agut, & Calvo, Citation2002), liquid chromatography (Fan, Cao, Liu, & Wang, Citation2016), gas chromatography (Scott, Weber, & Kanhere, Citation1997) and high-performance liquid chromatography-mass spectrometry (Hickert, Krug, Cramer, & Humpf, Citation2015). However, as TeA has highly acidic and metal complexing properties, a pre-column derivatization or stable isotope dilution assay should be undertaken to avoid interference (Hoevelmann et al., Citation2016; Siegel, Rasenko, Koch, & Nehis, Citation2009).
Immunoassay-based methods also play an important role in the mycotoxin determination in food and feed samples (Kong, Xie, Liu, Song & Kuang, Citation2017). For TeA analysis, polyclonal antibodies in rabbits have been prepared and a competitive direct enzyme immunoassay has been established for TeA, with a 50% inhibition concentration of 320 ± 130 ng/mL (Gross, Curtui, Ackermann, Latif, & Usleber, Citation2011). The enzyme immunoassay method is a high throughput and sensitive method; however, the lateral-flow immunochromatographic assay (ICA) strip described in the current work is a rapid, simple and instrument-free diagnostic tool. The ICA method described here is suitable for on-site screening and can analyze target substances using both quantitative and semi-quantitative methods (Kong, Liu, Song, Kuang, & Xu, Citation2016a).
In this study, we prepared and characterized a monoclonal antibody (mAb) and used it to develop a lateral-flow ICA strip for the detection of TeA in cereal and fruit juice.
Materials and methods
Chemicals
TeA, alternariol (AOH) and alternariol methyl ether (AME) were obtained from J&K Scientific Ltd (Shanghai, China). Bovine serum albumin (BSA), carbonyldimidazole (CDI), dicyclohexylcarbodiimide (DCC) and N-hydroxysuccinimide (NHS) were obtained from Sigma (St. Louis, MO, USA). Goat anti-mouse immunoglobulin (IgG) antibody was purchased from Jackson ImmunoResearch Laboratories (West Grove, PA, USA). Other reagents and chemicals were acquired from the National Pharmaceutical Group Chemical Reagent Co., Ltd. (Shanghai, China).
Nitrocellulose (NC) high-flow-plus membrane (Pura-bind RP) was obtained from Whatman-Xinhua Filter Paper Co. (Hangzhou, China). Sample pads (CB-SB08), polyvinylchloride (PVC) backing cards and absorption pads (SX18) were supplied by Goldbio Tech Co. (Shanghai, China). Coating antigens and mAb (No. 7F2) were generated in our laboratory.
All buffer solutions were prepared with ultrapure water (Milli-Q purification system, Millipore Co., Bedford, MA, USA). AirJet Quanti 3000TM and BioJet Quanti 3000TM were used as dispensers (XinqidianGene-technology Co. Ltd., Beijing, China), and the strip cutting instrument was CM 4000 (Gene, Shanghai, China). The strip scan reader was provided by Meizheng Bio-Tech Co., Ltd. (Beijing, China).
Preparation of coating antigen and anti-TeA mAb
Preparation of coating antigen
Different antigens were prepared for immunochromatographic strip analysis.
BSA was dissolved in 0.1 M sodium carbonate–bicarbonate buffer (CB, pH 9.6) at a concentration of 6 mg/mL. For the first antigen (A1), TeA-BSA antigen was synthesized using the NHS ester method (Gross et al., Citation2011). One milligram of TeA was dissolved in 0.5 mL pyridine, together with 5 mg succinic anhydride and 5 mg dimethylaminopyridine. This solution was left to react at 80°C for 4 h under constant stirring and then dried under nitrogen. The residue was dissolved in 0.01 M HCl and extracted by ethyl acetate three times. The ethyl acetate was collected and dried under nitrogen and then dissolved in 0.4 mL dimethyl formamide with 2 mg DCC and 1 mg NHS. The solution was left at room temperature for 6 h under continuous stirring and was then added to a 6 mg BSA solution in a dropwise manner, and allowed to react at room temperature for 2 h under continuous stirring. The resulting conjugates were dialyzed against 0.01 M phosphate buffer solution (PBS) for 3 days in the dark. For the second antigen (A2), TeA-BSA was conjugated by the CDI method (Liu, Yu, He, & Xu, Citation2007). One milligram of TeA was dissolved in 0.5 mL dry dimethylsulfoxide, together with 10 mg CDI and the solution reacted at 40°C for 8 h under continuous stirring. The solution was then added to a 4 mg BSA solution and left to react at room temperature overnight under constant stirring. The resulting conjugates were dialyzed against 0.01 M PBS for 3 days in the dark. Finally, the third antigen (A3) was synthesized by formaldehyde condensation (Ackermann et al., Citation2011). TeA (1 mg dissolved in 200 µL methanol), formaldehyde (37%, 300 µL) and 4 mg BSA were mixed and incubated at 37°C overnight under stirring conditions. The resulting conjugates were dialyzed against 0.01 M PBS for 3 days in the dark. The three antigens were characterized using UV spectroscopy and SDS-PAGE.
Preparation of anti-TeA mAb
The anti-TeA mAb was prepared in the laboratory by mice immunization, cell fusion and purification via the caprylic acid-ammonium sulfate precipitation method (Kong, Xie, Liu, Song, Kuang, et al. Citation2017). The mAb was characterized using the conventional indirect competitive ELISA (ic-ELISA) method (Kong, Xie, Liu, Song, Kuang, Cui et al. Citation2017) and characteristics of the mAb, such as limit of detection (LOD), 50% inhibition concentration (IC50) and cross-reactivity (CR) values were determined for further analyses (Liu, Yan, Zhang, Kuang, & Xu, Citation2015).
Preparation and principle of lateral-flow ICA strip
The lateral-flow strip is based on an antibody–antigen reaction. The competition and inhibition reaction occurred between the TeA contained in samples and coating antigen sprayed on the test line of the strip for the gold nanoparticles (GNP)-labeled mAb.
Preparation of colloidal GNPs
Chlorauric acid (200 mL of a 0.1 g/L) was heated to boiling under constant stirring (100×g), and then mixed with 8.0 mL of 1% trisodium citrate (w/v) solution at 300°C. The mixture was stirred for 10 min until the color of the solution turned wine-red. Then, the solution was cooled to room temperature under constant stirring, and stored at 4°C. All solvents were prepared with deionized water. Transmission electron microscopy analysis showed that the GNPs had a uniform particle size of 20 nm (Feng et al., Citation2015).
Preparation of GNP-labeled mAb
The prepared GNPs were conjugated with mAb using the static electricity adsorption method (Kong, Liu, Song, Kuang, & Xu, Citation2017). Ten milliliters of the GNP solution (1 nM) was adjusted with 0.1 M K2CO3 (40 µL), anti-TeA mAb (0.3 mg) was then added in a dropwise manner and the solution was left to react at room temperature. One hour later, 1 mL 10% BSA (w/v) solution was added in a dropwise manner for blocking and stabilization of the GNP-labeled mAb. After a 2-h incubation at room temperature, the product was centrifuged at 7000×g for 30 min. Then, the precipitate was washed three times with 0.02 M PBS buffer containing 5% sucrose, 1% BSA and 0.5% polyethyl glycol (PEG) 6000 (pH 7.4), and then dissolved in 1 mL gold-labeling resuspension buffer (0.02 M PBS containing 5% sucrose, 2% sorbitol and 0.04% NaN3) and stored at 4°C.
Preparation of the lateral-flow ICA strip
The NC membrane was firstly attached onto the middle of the PVC backing card. Then, the goat anti-mouse IgG antibody (0.5 mg/mL) was sprayed onto the NC membrane at 1 µL/cm and the control line (C line) was formed. The coating antigen was sprayed onto the NC membrane at 1 µL/cm and the test line (T line) was formed. Then, this pad was dried at 37°C for 30 min. The absorption pad was attached at the end of the PVC backing card toward the C line. The sample pad was firstly immersed in 0.01 M PBS (containing 1% BSA and 0.2% Tween-20) and dried at 37°C for 4 h to minimize nonspecific binding and matrix interference. Then, the sample pad was attached at the end of the PVC backing card toward the T line. Finally, the prepared card was cut into individual test strips (width 3 mm) for further analyses.
Principle of lateral-flow ICA strip
For sample analysis, 50 µL of GNP-labeled mAb was mixed with 150 µL of sample solution and left to react for 5 min. Then, the mixture was added to the sample pad and left to migrate to the absorbent pad. After 5 min, results were obtained (Guo et al., Citation2015). If TeA was contained in the sample, it was firstly conjugated with GNP-labeled mAb and inhibited the mAb reaction with antigen on the T line. Therefore, the color intensity of the T line was inversely proportional to the concentration of TeA. By contrast, a clear red T line was observed with TeA-negative samples.
As both free and conjugated mAb can be captured by goat anti-mouse IgG antibody on the C line, the control line should always emerge with each analysis; otherwise, the procedure was incorrectly performed or the strip was poorly assembled.
Characterization of the lateral-flow ICA strip
Sensitivity of the lateral-flow ICA strip
The sensitivity of the lateral-flow ICA strip was confirmed by a series of different concentrations of TeA standards. TeA was diluted 0, 100, 200, 400, 800, 1600 and 3200 ng/mL in 0.01 M PBS and then detected using the lateral-flow ICA strip. For analysis with the naked eye, the visual limit of detection (vLOD) value was defined as the lowest concentration that resulted in a weaker T line color intensity than a negative sample. The cut-off value was defined as the threshold concentration that resulted in the disappearance of the T line (Kong, Liu, Song, Kuang & Xu Citation2016b). In order to obtain quantitative results, the strips were analyzed using a strip scan reader. The color intensity ratio of the T line with positive sample to negative sample was defined as T/T0 (ordinate). The concentration of TeA was used as abscissa and the standard curve was confirmed. The calculated limit of detection (cLOD) was defined as 10% inhibition concentration (IC10) from the standard curve (Kong, Diu et al. Citation2016).
Sample analysis
TeA-free wheat was finely ground and spiked with different TeA standards (5 g). The 5 g sample was added to 10 mL acetonitrile/water (8:2, v/v), shaken vigorously for 5 min, and then centrifuged at 6000×g for 10 min. The supernatant (1 mL) was diluted with 3 mL 0.01 M PBS for further analyses. The TeA-free apple juice was spiked with different TeA standards and then diluted with ultrapure water at a ratio of 1:1 for further analyses.
Results and discussion
Characterization of coating antigen and mAb
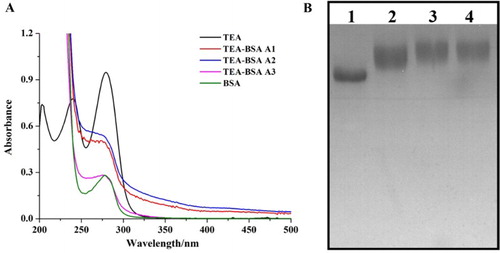
The three antigens were characterized using UV spectroscopy and SDS-PAGE and the results are shown in . The characteristic peaks for TeA were at 203, 240 and 279 nm and at 278 nm for BSA. All the antigens had significant characteristic peaks at 280 nm, with wide absorbance between 240 and 280 nm. For SDS-PAGE analysis, the antigens took significant offset with BSA. Both of these methods confirmed that TeA had successfully conjugated with BSA.
Figure 1. The characterization of coating antigens (TeA-BSA). (A) The UV-Vis spectra of coating antigens; (B) The SDS-PAGE image of coating antigens: (1) BSA; (2) TeA-BSA A1; (3) TeA-BSA A2; (4) TeA-BSA A3.
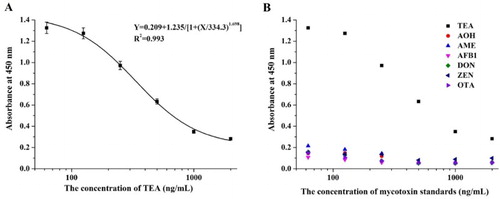
For the mAb 7F2 obtained after mice immunization and cell fusion, the standard curve based on ic-ELISA was y = 0.209 + 1.235/[1 + (x/334.3)1.698] and the linear regression correlation coefficient (R2) was 0.993 ((A)). The corresponding IC50 value was 334.3 ng/mL and the LOD value was 78.89 ng/mL. In addition, the obtained mAb had no cross-reactivity with other Alternaria toxins, such as AOH and AME, or with other mycotoxins, such as aflatoxin B1 (AFB1), deoxynivalenol (DON), zearalenone (ZEN) and ochratoxin A (OTA) ((B)).
Figure 2. The characterization of anti-TeA mAb: (A) The standard curve for anti-TeA mAb; (B) The cross-reactivity for anti-TeA mAb.
Optimization of the lateral-flow ICA strip
Optimization of coating antigens
Coating antigens were prepared by different methods and could affect the affinity and inhibitory effects of the mAb. The three antigens were tested with 0.01 M PBS containing 500 ng/mL TeA (positive) and 0 ng/mL TeA (negative), respectively. For antigen A3, there was no red line visible on the T line for either positive or negative samples, meaning that the antigen produced by the formaldehyde condensation method had poor affinity with mAb ((A)). For antigens A1 and A2, an obvious red line was observed on the T line with the negative sample. However, only with A2, the inhibitory effect could be observed with the positive sample. Therefore, antigen A2 produced by the CDI method was selected for the lateral-flow ICA strip.
Figure 3. Optimization of lateral-flow ICA strip: (A) optimization of coating antigen with different synthesized methods; (B) Optimization of coating antigen A2 with different concentration on T line; (C) Optimization of suspension buffer with different surfactant reagents: (1) Basic, (2) PVP, (3) PEG, (4) PVA, (5) BSA, (6) casein, (7) sucrose, (8) trehalose, (9) sorbitol, (10) mannitol, (11) Tween-20, (12) Brij-35, (13) Triton X-100 and (14) On-870.
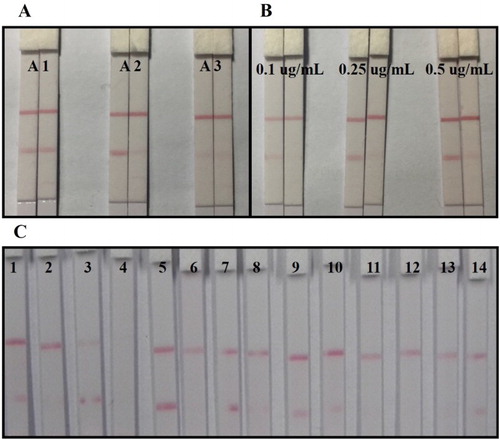
The selected antigen (A2) was sprayed onto the strip at different concentrations (0.1, 0.25 and 0.5 μg/mL) for further analysis. Both positive (500 ng/mL) and negative (0 ng/mL) samples were tested. In the case of the negative sample, the color intensity of the T line got deeper as the antigen concentration increased. However, with the positive sample too, high antigen concentration reduced the inhibitory effect of mAb. Finally, the strip with an antigen concentration of 0.25 μg/mL on the T line was selected ((B)).
Optimization of suspension buffer
For sample analysis, the GNP-labeled mAb should be dissolved in suspension buffer first. The surfactants contained in the suspension buffer could make the hydrophobic NC membrane become hydrophilic and could have consistent flow characteristics during the testing process. Therefore, the choice of surfactant reagents in the suspension buffer greatly affected the development of the lateral-flow ICA strip. The basic suspension buffer (0.02 M PBS which contained 5% sucrose, 2% sorbitol, 1% mannitol, 0.1% PEG, 0.1% tween and 0.04% NaN3) was added to different surfactant reagents, such as 5% polyvinylpyrrolidone (PVP), polyethylene glycol (PEG), polyvinyl alcohol (PVA), BSA, casein, sucrose, trehalose, sorbitol, mannitol, Tween-20, Brij-35 (tricosaethylene glycol mono-n-dodecyl ether), Triton X-100 and Rhodasurf® On-870 (an ethoxylated oleyl alcohol). The results showed that 5% BSA in the basic suspension buffer offered the best and most stable color reactions, and was selected for subsequent experiments ((C)).
Sensitivity analysis of lateral-flow ICA strip
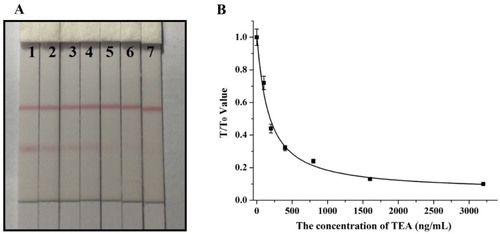
Different concentrations of TeA standards were tested using the developed lateral-flow ICA strip. (A) shows that the vLOD for TeA tested with the naked eye was 200 ng/mL, and the cut-off value was 1600 ng/mL. The quantitative results are given in (B) and the cLOD value was 43.2 ng/mL.
Figure 4. Sensitivity analysis of lateral-flow ICA strip. (A) Sensitivity analysis by naked eyes; (1) 0 ng/mL; (2) 100 ng/mL; (3) 200 ng/mL; (4) 400 ng/mL; (5) 800 ng/mL; (6) 1600 ng/mL; (7) 3200 ng/mL; (B) Sensitivity analysis by strip scan reader.
Sample analysis
Free wheat sample was spiked with TeA at concentrations of 0, 800, 1600, 3200, 6400, 12,800 and 25,600 ng/g, and the free apple juice sample was spiked with TeA at concentrations of 0, 200, 400, 800, 1600, 3200 and 6400 ng/mL. And these samples were tested using the lateral-flow ICA strip and each test was repeated six times. The results are shown in . The vLOD and cut-off values were 1600 ng/g and 6400 ng/g for wheat, and 400 ng/mL and 3200 ng/mL for apple juice, respectively. Meanwhile, the cLOD values for wheat and apple juice were 126.4 ng/g and 65.3 ng/mL, respectively.
Figure 5. The sample test by lateral-flow ICA strip. (A) Wheat sample: (1) 0 ng/g; (2) 800 ng/g; (3) 1600 ng/g; (4) 3200 ng/g; (5) 6400 ng/g; (6) 12,800 ng/g; (7) 25,600 ng/g; (B) Apple juice sample: (1) 0 ng/mL; (2) 200 ng/mL; (3) 400 ng/mL; (4) 800 ng/mL; (5) 1600 ng/mL; (6) 3200 ng/mL; (7) 6400 ng/mL.
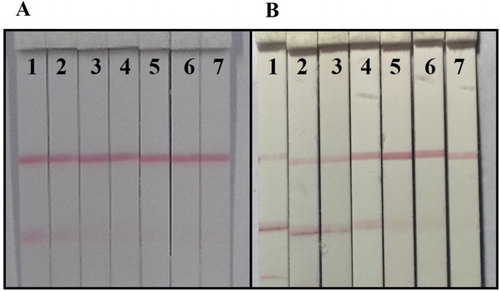
The spiked sample test results were different from the standard analysis and this may have been caused by some matrix interference. In the case of wheat samples, the extraction process was undertaken with acetonitrile/water (8:2, v/v), and the final acetonitrile concentration was 20%, which would have affected the inhibitory effect and the affinity of the antibody–antigen reaction and led to a weak color intensity on the T line compared to the PBS solution. For apple juice, the pH value of sample was weakly acidic and this would result in the GNP-labeled mAb becoming a little aggregated. In (B), weak color intensity was observed between the T line and the sample pad, and there was a deeper color intensity on the T line compared to the same TeA concentration in PBS.
In order to determine the accuracy of the lateral-flow ICA strip analysis, wheat samples containing 1200 and 3600 ng/g of TeA and apple juice samples containing 300 and 1200 ng/mL of TeA were tested. Each sample detection was repeated six times and the results are shown in . Recovery rates for the different samples ranged from 90% to 129%.
Table 1. The spiked sample analysis with lateral-flow ICA strip (n = 6).
Conclusion
In this work, a simple and rapid lateral-flow ICA strip was developed, and can be used for both semi-quantitative and quantitative analysis of TeA in different types of food samples. The vLOD and the cut-off values for wheat samples were 1600 ng/g and 6400 ng/g, and the same for apple juice samples were 400 ng/mL and 3200 ng/mL, respectively. The cLOD values for quantitative analysis of wheat and apple juice samples were 126.4 ng/g and 65.3 ng/mL, respectively, and the recovery rates ranged from 90% to 129%. In summary, the newly developed immunoassay method was convenient and is suitable for on-site analysis and mass sample screening. In the future, this method could play a significant role in food safety analysis.
Disclosure statement
No potential conflict of interest was reported by the authors.
Notes on contributors
Dezhao Kong got his bachelor from Nanjing University of Finance & Economics, Nanjing, China in 2012 and then he began to study in Jiangnan University (Wuxi, China) for as a Ph.D. student in food science. His research interests are immunoassay applications in food.
Liqiang Liu got his Ph.D. in Food science in 2014 from Jiangnan University, Wuxi, China and then became a faculty in college of Food science and technology of Jiangnan University. His research interests are immunochromatographic strip design and application.
Shanshan Song got her Master degree in Food science in 2012 from Jiangnan University, Wuxi, China and then became a research assistant in college of Food science and technology of Jiangnan University. Her research interests are monoclonal antibody development.
Qiankun Zheng graduated from Nanjing Agricultural University in 1996. Currently, he works as a senior engineer in delicious food company, China. He is good at food quality control and assurance.
Xiaoling Wu got her Ph.D. in Food science in 2013 from Jiangnan University, Wuxi, China and then became a faculty in college of Food science and technology of Jiangnan University. Her research is focused on the synthesis and controllable assembly of nanoparticles, especially noble metal nanoparticles.
Hua Kuang got her Ph.D. from China Agricultural University in 2009 and then began to work as a faculty in college of Food science and technology of Jiangnan University. She is currently a full professor in food safety. Her research interests are biosensor development.
Additional information
Funding
References
- Ackermann, Y., Curtui, V., Dietrich, R., Gross, M., Latif, H., Maertlbauer, E., & Usleber, E. (2011). Widespread occurrence of low levels of alternariol in apple and tomato products, as determined by comparative immunochemical assessment using monoclonal and polyclonal antibodies. Journal of Agricultural and Food Chemistry, 59(12), 6360–6368. doi: 10.1021/jf201516f
- Asam, S., Lichtenegger, M., Muzik, K., Liu, Y., Frank, O., Hofmann, T., & Rychlik, M. (2013). Development of analytical methods for the determination of tenuazonic acid analogues in food commodities. Journal of Chromatography A, 1289, 27–36. doi: 10.1016/j.chroma.2013.03.015
- Asam, S., & Rychlik, M. (2013). Potential health hazards due to the occurrence of the mycotoxin tenuazonic acid in infant food. European Food Research and Technology, 236(3), 491–497. doi: 10.1007/s00217-012-1901-x
- Barkai-Golan, R., & Paster, N. (2008). Mouldy fruits and vegetables as a source of mycotoxins: Part 1. World Mycotoxin Journal, 1(2), 147–159. doi: 10.3920/WMJ2008.x018
- Fabrega, A., Agut, M., & Calvo, M. A. (2002). Optimization of the method of detection of metabolites produced by the Alternaria genus: Alternariol, alternariol monomethyl ether, altenuene, altertoxin I and tentoxin. Journal of Food Science, 67(2), 802–806. doi: 10.1111/j.1365-2621.2002.tb10680.x
- Fan, C., Cao, X. L., Liu, M., & Wang, W. (2016). Determination of Alternaria mycotoxins in wine and juice using ionic liquid modified countercurrent chromatography as a pretreatment method followed by high-performance liquid chromatography. Journal of Chromatography A, 1436, 133–140. doi: 10.1016/j.chroma.2016.01.069
- Feng, M., Kong, D. Z., Wang, W. B., Liu, L. Q., Song, S. S., & Xu, C. L. (2015). Development of an immunochromatographic strip for rapid detection of Pantoea stewartii subsp. Stewartii. Sensors, 15(2), 4291–4301. doi: 10.3390/s150204291
- Gross, M., Curtui, V., Ackermann, Y., Latif, H., & Usleber, E. (2011). Enzyme immunoassay for tenuazonic acid in apple and tomato products. Journal of Agricultural and Food Chemistry, 59(23), 12317–12322. doi: 10.1021/jf203540y
- Guo, J. N., Liu, L. Q., Xue, F., Xing, C. R., Song, S. S., Kuang, H., & Xu, C. L. (2015). Development of a monoclonal antibody-based immunochromatographic strip for cephalexin. Food and Agricultural Immunology, 26(2), 282–292. doi: 10.1080/09540105.2014.907242
- Hickert, S., Krug, I., Cramer, B., & Humpf, H. U. (2015). Detection and quantitative analysis of the non-cytotoxic allo-tenuazonic acid in tomato products by stable isotope dilution HPLC-MS/MS. Journal of Agricultural and Food Chemistry, 63(50), 10879–10884. doi: 10.1021/acs.jafc.5b04812
- Hoevelmann, Y., Hickert, S., Cramer, B., & Humpf, H.-U. (2016). Determination of exposure to the alternaria mycotoxin tenuazonic acid and its isomer allo-tenuazonic acid in a German population by stable isotope dilution HPLC-MS3. Journal of Agricultural and Food Chemistry, 64(34), 6641–6647. doi: 10.1021/acs.jafc.6b02735
- Kong, D. Z., Liu, L. Q., Song, S. S., Kuang, H., & Xu, C. L. (2016a). Development of an immunochromatographic strip for the semi-quantitative and quantitative detection of biotin in milk and milk products. Analytical Methods, 8(7), 1595–1601. doi: 10.1039/C5AY02659H
- Kong, D. Z., Liu, L. Q., Song, S. S., Kuang, H., & Xu, C. L. (2016b). Development of ic-ELISA and lateral-flow immunochromatographic assay strip for the detection of folic acid in energy drinks and milk samples. Food and Agricultural Immunology, 27(6), 841–854. doi: 10.1080/09540105.2016.1183600
- Kong, D. Z., Liu, L. Q., Song, S. S., Kuang, H., & Xu, C. L. (2017). Development of sensitive, rapid, and effective immunoassays for the detection of vitamin B-12 in fortified food and nutritional supplements. Food Analytical Methods, 10(1), 10–18. doi: 10.1007/s12161-016-0543-1
- Kong, D., Liu, L., Song, S., Suryoprabowo, S., Li, A., Kuang, H., … Xu, C. (2016). A gold nanoparticle-based semi-quantitative and quantitative ultrasensitive paper sensor for the detection of twenty mycotoxins. Nanoscale, 8(9), 5245–5253. doi: 10.1039/C5NR09171C
- Kong, D., Xie, Z., Liu, L., Song, S., & Kuang, H. (2017). Development of ic-ELISA and lateral-flow immunochromatographic assay strip for the detection of citrinin in cereals. Food and Agricultural Immunology,157,1–13 doi: 10.1080/09540105.2017.1312293
- Kong, D. Z., Xie, Z. J., Liu, L. Q., Song, S. S., Kuang, H., Cui, G., & Xu, C. L. (2017). Development of indirect competitive ELISA and lateral-flow immunochromatographic assay strip for the detection of sterigmatocystin in cereal products. Food and Agricultural Immunology, 28(2), 260–273. doi: 10.1080/09540105.2016.1263985
- Kong, D., Xie, Z., Liu, L., Song, S., Kuang, H., & Xu, C. (2017). Development of ic-ELISA and lateral-flow immunochromatographic assay strip for the detection of vancomycin in raw milk and animal feed. Food and Agricultural Immunology,28,414–426. doi: 10.1080/09540105.2017.1293014
- Lee, H. B., Patriarca, A., & Magan, N. (2015). Alternaria in food: Ecophysiology, mycotoxin production and toxicology. Mycobiology, 43(2), 93–106. doi: 10.5941/MYCO.2015.43.2.93
- Liu, L. Q., Yan, H. J., Zhang, X., Kuang, H., & Xu, C. L. (2015). Development of an anti-chlorothalonil monoclonal antibody based on a novel designed hapten. Food and Agricultural Immunology, 26(3), 410–419. doi: 10.1080/09540105.2014.938319
- Liu, R., Yu, Z., He, Q., & Xu, Y. (2007). Preparation and identification of a monoclonal antibody against citrinin. Journal of Hygiene Research, 36(2), 190–193.
- Lopez, P., Venema, D., Mol, H., Spanjer, M., de Stoppelaar, J., Pfeiffer, E., & de Nijs, M. (2016). Alternaria toxins and conjugates in selected foods in the Netherlands. Food Control, 69, 153–159. doi: 10.1016/j.foodcont.2016.04.001
- Oliveira, R. C., Goncalves, S. S., Oliveira, M. S., Dilkin, P., Mallmann, C. A., Freitas, R. S., … Correa, B. (2017). Natural occurrence of tenuazonic acid and Phoma sorghina in Brazilian sorghum grains at different maturity stages. Food Chemistry, 230, 491–496. doi: 10.1016/j.foodchem.2017.03.079
- Ostry, V. (2008). Alternaria mycotoxins: An overview of chemical characterization, producers, toxicity, analysis and occurrence in foodstuffs. World Mycotoxin Journal, 1(2), 175–188. doi: 10.3920/WMJ2008.x013
- Scott, P. M., Weber, D., & Kanhere, S. R. (1997). Gas chromatography mass spectrometry of Alternaria mycotoxins. Journal of Chromatography A, 765(2), 255–263. doi: 10.1016/S0021-9673(96)00917-X
- Siegel, D., Rasenko, T., Koch, M., & Nehis, I. (2009). Determination of the Alternaria mycotoxin tenuazonic acid in cereals by high-performance liquid chromatography-electrospray ionization ion-trap multistage mass spectrometry after derivatization with 2,4-dinitrophenylhydrazine. Journal of Chromatography A, 1216(21), 4582–4588. doi: 10.1016/j.chroma.2009.03.063
- Zhou, B., & Qiang, S. (2008). Environmental, genetic and cellular toxicity of tenuazonic acid isolated from Alternaria alternata. African Journal of Biotechnology, 7(8), 1151–1156.