
 ?Mathematical formulae have been encoded as MathML and are displayed in this HTML version using MathJax in order to improve their display. Uncheck the box to turn MathJax off. This feature requires Javascript. Click on a formula to zoom.
ABSTRACT
In this study, a sensitive monoclonal antibody (mAb) 3D5 against sparfloxacin (SPFX) was generated. Based on the mAb 3D5, an indirect competitive enzyme-linked immunosorbent assay (ic-ELISA) method was developed for the detection of SPFX in honey. The half maximal inhibitory concentration and limit of detection for the ic-ELISA method were 0.12 and 0.02 ng/mL, respectively. The experiments showed a negligible cross-reaction with other drugs. The average recovery rates for spiked SPFX honey extracts ranged from 90% to 101%, indicating an accepted accuracy. Furthermore, a lateral-flow immunochromatographic assay strip method with a cut-off value of 2 ng/mL was developed. Therefore, both of the developed methods are suitable for future use as rapid screening methods to detect and control the content of SPFX residues in honey samples.
Introduction
The use of sparfloxacin (SPFX), a third-generation fluoroquinolone antibiotic, is widespread in animals for preventing disease and promoting growth due to its broad-spectrum antibacterial properties (Peng et al., Citation2016). A deficiency in SPFX leads to phototoxicity, renal-hepatic system damage, and genotoxicity (Beberok et al., Citation2015; Giacometti, Cirioni, Barchiesi, & Scalise, Citation2000). Furthermore, long-term exposure to SPFX can result in the emergence of drug-resistant pathogens which increases the risk of death from common infections (Martín-Galiano & de la Campa, Citation2003; Minnick, Wilson, Smitherman, & Samuels, Citation2003; Tlili et al., Citation2016; Weigel, Anderson, & Tenover, Citation2002). Due to these concerns, many countries have set maximum residue limits (MRLs) for several quinolones to protect consumers (Tochi, Khaemba, et al., Citation2016; Zhi et al., Citation2010). China and the USA do not permit use of SPFX in honey or honey products. Therefore, it is essential that a sensitive, rapid, and accurate SPFX detection method is required to assess the safety of foods.
Many analytical methods have been used to detect fluoroquinolones, including high-performance liquid chromatography (HPLC), liquid chromatography–tandem mass spectrometry, fluorescence analyses, spectrophotometric analyses, and capillary electrophoresis (Alcaráz, Siano, Culzoni, Muñoz de la Peña, & Goicoechea, Citation2014; Gul, Sultana, Saeed Arayne, Shamim, & Akhtar, Citation2012; He & Blaney, Citation2015; Li et al., Citation2009; Pinacho, Sánchez-Baeza, Pividori, & Marco, Citation2014), which are all complex, time-consuming, and expensive. Compared with these methods, an immunoassay is a sensitive, low-cost, and rapid technique that has already been reported to detect fluoroquinolones (Chen & Jiang, Citation2013; Jiang et al., Citation2011; Liu et al., Citation2014; Peng, Liu, Kuang, Cui, & Xu, Citation2017; Tian, Zhang, Sun, Qian, & Ji, Citation2013; Tochi, Khaemba, et al., Citation2016; Tochi, Peng, et al., Citation2016; Wang, Zhang, Ni, Zhang, & Shen, Citation2014; Zhang et al., Citation2011). Although the enzyme-linked immunosorbent assay (ELISA) with a half maximal inhibitory concentration (IC50) of 31 ng/mL was established (Deng et al., Citation2013), it does not meet the requirements for field applications. Furthermore, no studies have yet investigated immunochromatographic assays (ICAs) for the detection of SPFX.
Therefore, the main aim of this study was to develop an indirect competitive (ic)-ELISA method and lateral-flow ICA strip for detection of SPFX in honey samples.
Materials and methods
Reagents and materials
Sparfloxacin, enrofloxacin, fleroxacin, flumequine, ciprofloxacin, ractopamine, gentamicin, terbutaline, clenbuterol, and sabutamol were provided by the National Institute of Control of Pharmaceutical and Biological Products (Beijing, China). Bovine serum albumin (BSA) and ovalbumin (OVA) were purchased from Shanghai Shangbao Biological Science and Technology Co., Ltd (Shanghai, China). N,N′-Dicyclohexylcarbodiimide (DCC) and Freund’s complete and incomplete adjuvants (cFA and iFA, respectively) were obtained from Sigma-Aldrich (St. Louis, MO, USA). N-Hydroxysuccinimide (NHS) was purchased from J&K Chemical Co., Ltd (Shanghai, China). Horseradish peroxidase (HRP)-conjugated goat anti-mouse IgG antibody (goat anti-mouse IgG–HRP) was purchased from the Military Medical Institute (Beijing, China). N,N-Dimethylformamide (DMF) and Tween 20 were purchased from Donghong Chemical Company (Guangzhou, China). 3,3′,5,5′-Tetramethylbenzidine (TMB) was obtained from Amresco (Solon, OH). All other reagents used were of chemical grade and obtained from Sinopharm Chemical Reagent Co. Ltd (Shanghai, China).
Instrumentation
The ELISA was performed in polystyrene 96-well microtiter plates (Bio Basic Inc., Markham, Canada). The Microplate Reader 450/550 was from Bio-Rad (Richmond, CA, USA). UV data were collected with a U-4100 spectrophotometer from Hitachi Co. Milli-Q water was obtained from Milli-Q® Integral Water Purification System (Millipore, Bedford, USA).
Buffers and solutions
Ultrapure deionized water was used for the preparation of all the buffers and reagents used in the immunoassays. (1) 0.01 mol/L Phosphate-buffered saline (PBS, pH 7.4) contained NaCl (4 g), KH2PO4 (0.135 g), Na2HPO4·12H2O (1.8 g), and KCl (0.1 g) as the dilution to the SPFX standard substance. (2) 0.05 mol/L carbonate buffer (CBS, pH 9.6) contained Na2CO3 (0.795 g) and NaHCO3 (1.47 g) as the coating buffer. (3) Washing buffer contained 5% porcine serum as the blocking buffer. (4) PBS with 0.05% (v/v) Tween 20 and 0.1% (w/v) gelatin was the antibody dilution buffer; (5) 2 mol/L H2SO4 was the stop solution.
Preparation of immunogen and coating antigen
The immunogen was synthesized by conjugating SPFX to BSA with the active ester method with some modifications (). SPFX (3.6 mg) was dissolved in a mixture of NHS (2.5 mg) and DCC (5 mg) in 2 mL DMF. Then the mixture was incubated at room temperature for 12 h without light. Finally, the reaction mixture was drop-wise added into 5 mL PBS containing 8 mg BSA under stirring condition and stirred at 4°C for 8 h.
Figure 1. Synthesis of immunogen and coating antigen (Protein: BSA or OVA).
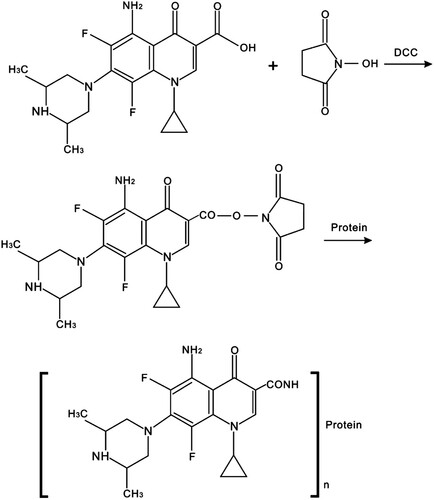
The hapten–BSA conjugate solutions were dialyzed stirring against PBS at 4°C for 72 h, during which the PBS was renewed three times per day to remove any uncoupled free hapten. The conjugates were freeze-dried and stored at −20°C until future use. The coating antigen SPFX–OVA was generated in a similar way. The conjugates were characterized by their UV absorbance spectra and with the antiserum of mice immunized with the SPFX–BSA conjugate.
Immunization, cell fusion, and monoclonal antibody (mAb) generation
Three female BALB/c mice (6–10 weeks old) were subcutaneously immunized with the immunogen BSA–SPFX at multiple sites on their backs. To monitor the quality of the antiserum produced by the immunized mice, the serum titers were measured with the ELISA procedures as previously described (Wang et al., Citation2014). The mice with high serum antibody titer and low IC50 were selected for cell fusion. Briefly, the mouse spleen cells were aseptically harvested and fused with myeloma cells in a 10:1 ratio, using polyethylene glycol 1500 as the fusing agent. In order to obtain stable cell lines, the fused cells were screened and subcloned using the ic-ELISA method and limiting dilution method, respectively (Kong et al., Citation2017).
Mature female BALB/c mice were injected intraperitoneally (i.p.) with 0.5 mL of paraffin 10 days before an i.p. injection of the positive hybridoma cells. The ascites fluid was collected 10 days after injection. The mAb was purified with the modified caprylic acid ammonium sulfate precipitation method. The mAb from the mouse that showed the highest titer and sensitivity was used in this study.
Development of the ic-ELISA
Checkerboard tests were performed to determine the optimal dilutions of the coating antigen and the primary antibody (Buchberger, Citation2007). Ninety-six-well microtiter plates were coated using the SPFX–OVA solution at different concentrations (from 50 to 10,000 ng/mL) at 37°C for 1 h. After the wells were washed four times with washing buffer, the plates were blocked with 5% porcine serum (200 μL/well) at 37°C for 1 h. After washing, 50 μL of antiserum (dilutions ranged from 1 × 10⁻⁵ to 6.5 × 10⁻⁵) and 50 μL of SPFX standard solution were added using a standard chequerboard titration method and incubated at 37°C for 30 min. After the wells were washed four times, goat anti-mouse IgG–HRP solution (1:2000) was added to the plates (50 μL/well) and the plates were incubated at 37°C for 30 min. For color development, substrate solution was added to each well (50 μL/well) and the plates were incubated for 10 min at room temperature. The reaction was terminated by the addition of the stop solution at 50 μL/well. The absorbance was measured with a microplate reader at 450 nm.
Sensitivity and specificity of the assay
The IC50 value and cross-reaction (CR) were determined to evaluate the sensitivity and specificity of the assay, respectively. Competitive immunoassays were performed using four related compounds (enrofloxacin, fleroxacin, flumequine, and ciprofloxacin) and several other compounds. The four fluoroquinolones were chosen because they are structurally similar to SPFX. The tested fluoroquinolones were subjected to the ic-ELISA, as described above for SPFX. The CR values were then calculated with the following equation:
Preparation of the lateral-flow ICA strip
A polyvinyl chloride (PVC) backing card, an nitrocellulose (NC) membrane, the sample pad and absorption pad were assembled to prepare the lateral-flow ICA strip as described previously (Yang et al., Citation2015). Sample and absorbent pads were made from nonwoven, 100% pure cellulose fiber. The sample pad was cut to 15 × 280 mm and saturated with a buffer (pH 8.0) containing 20 mmol/L sodium borate, 2.0% (w/v) sucrose, 2.0% (w/v) BSA, and 0.1% (w/v) NaN3 to reduce the matrix interference, and then dried and stored. The absorbent pad was cut to 40 × 280 mm. 1 mg/mL SPFX–BSA and 1 mg/mL goat anti-mouse IgG were individually applied on the nitrocellulose membrane as the test and control lines. The assembled strip card was dried at 37°C for 30 min and then cut into individual test strips.
The gold nanoparticles (GNPs) were prepared as described previously (Jiang et al., Citation2013). (1) The pH of the GNP solution was adjusted to pH 9.0 by 0.2 M K2CO3 and then 0.15 mg mAb was added to 10 mL GNP solution. The mixture was kept for 15 min at RT. (2) 0.1 mL of 20 mmol/L sodium borate (pH 9.0) containing 10% BSA (w/v) was slowly added and the mixture was incubated for another 15 min at RT for blocking and stabilizing the GNP-labeled mAb. (3) The GNP–mAb solution was collected by repeated centrifugation (25,000 g) at 4°C for 30 min after adding 20 mmol/L sodium borate (pH 9.0) containing 3% BSA and 3% sucrose. The precipitate was the labeled mAb and stored in the PBS at 4°C for later use.
Principle of the lateral-flow ICA strip
The competitive/inhibitory reaction between the SPFX in samples and the coating antigen (SPFX–OVA) proceeded on the T line for the GNP-labeled anti-SPFX mAb. If SPFX is present in the sample, it competes with the immobilized capture reagent for the limited amount of detection reagent. The more SPFX in the sample, the weaker the test line color. If abundant SPFX is present in the sample, it will completely block the reaction with the capture reagent, thus no test line is visible. Provided that the test strip and the test procedure are correct, the control line is always visible. If no colored capture line or only a red color at the test line appears, the strip was invalid, and the test should be repeated using a new strip.
For the lateral-flow ICA strip, the visual limit of detection (vLOD) was defined as the lowest concentration of SPFX that led to a definitely weaker color intensity of the T line compared to a negative sample (Kong et al., Citation2017). The cut-off value was the SPFX concentration that led to the disappearance of the T line (Li et al., Citation2013)
Honey sample preparation and HPLC analysis
Honey samples were obtained directly from a market. They were assayed with HPLC in the Supervision and Verification Center of the Ministry of Agriculture (Zhengzhou, China). The same samples were analyzed with the ic-ELISA and HPLC to compare the quantitative concordance of the two methods. The HPLC analysis was performed on an Agilent 1200 system, equipped with an Agilent UV–VIS detector set at 290 nm, and the Chromeleon™ software was used to calculate the peak areas. An Agilent Zorbax Eclipse XDB-C18 column (150 mm × 4.6 mm, 5.0 μm particle size) was used at a flow rate of 1 mL/min at 25 °C. The column conditions included an eluent of acetonitrile–0.05 mol/L phosphate buffer and an injection volume of 20 mL. Under these conditions, the retention time of SPFX was 13 min. The concentrations of SPFX in the honey samples were 0.8, 2, and 5 ng/mL, representing low, medium, and high levels of residue.
Results and discussion
Design and synthesis of the hapten
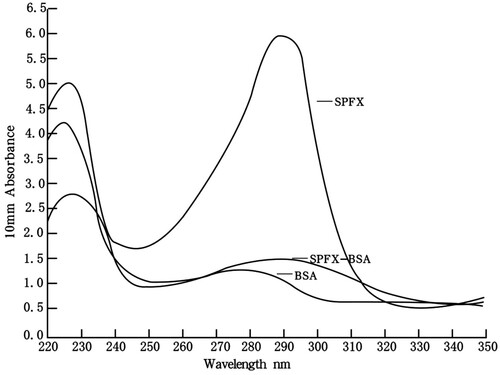
The design of hapten is one of the crucial steps in producing a high-quality antibody (Cao, Meng, Lu, & Xi, Citation2011; Sheng et al., Citation2009). The spacer-arm folding and steric-shielding effects of the hapten play important roles in the specificity and selectivity of an antibody (Wang et al., Citation2014). SPFX (molecular mass, 392.41 Da) as a small molecule requires the appropriate modification. The active carboxylic acid group at position 3 in the SPFX molecule allows its direct conjugation to the most commonly used carrier proteins (BSA and OVA). UV absorbance was used to characterize the BSA, SPFX, and SPFX–BSA. The hapten showed one specific ultraviolet absorption peak at 292 nm, whereas the BSA showed maximum absorption at 278 nm. The hapten–BSA conjugate showed typical absorbance peaks at both 224 and 292 nm (). These data demonstrate that the conjugation of SPFX–BSA was successfully synthesized.
Figure 2. UV scanning of BSA, SPFX-BSA, SPFX (BSA: Bovine serum albumin; SPFX–BSA: The conjugate of SPFX with BSA).
The mAb characterization
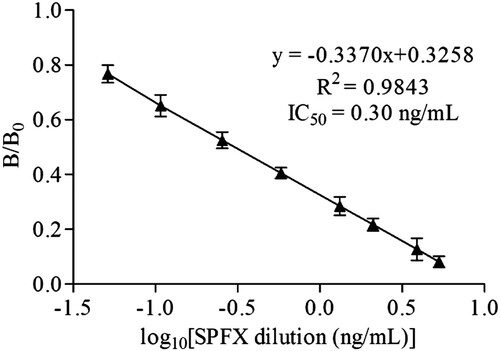
The selected hybridoma cell line was obtained after cell fusion, and the selected mAb, 3D5, was purified from the prepared ascites. The titer of the mAb 3D5 was determined to be >6.5 × 10⁵ by an ELISA. The IC50 value is a key criterion for evaluating the sensitivity of an ELISA. The lower the IC50 value, the higher the sensitivity of the assay (Zhi et al., Citation2010). In this study, the mAb 3D5 is highly sensitive, the IC50 of 3D5 was 0.3 ng/mL, and the LOD of the assay was 0.04 ng/mL ().
Figure 3. Inhibitive curve of SPFX mAb by ic-ELISA.
Specificity of mAb
The specificity of mAb was investigated by testing the IC50 and CR values obtained for a set of related compounds (Cao et al., Citation2011; Duan & Yuan, Citation2001; Holtzapple, Buckley, & Stanker, Citation1997). The specificity of 3D5 was evaluated by performing competitive assays against four fluoroquinolones and five other veterinary drugs (). The CR values for the antibody against four structurally related compounds were 1.68–4.01%, and the antibody shows no CR to other compounds (CR < 0.009%). The results clearly demonstrate that the mAb 3D5 is highly specific for SPFX.
Table 1. The CR of SPFX mAb 3D5 with compete compounds.
Optimization of ic-ELISA
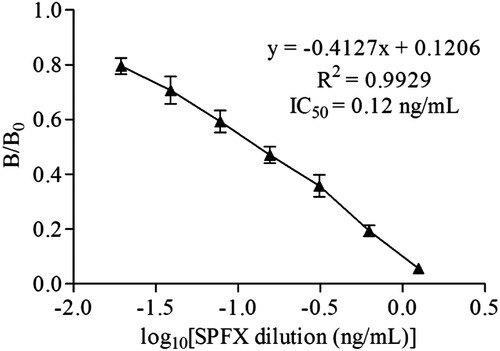
Different concentration standards were prepared, and ic-ELISA was developed to evaluate the sensitivity of mAb 3D5 with a coating antigen concentration of 1000 ng/mL and mAb concentration of 2 × 10⁻⁵. Under the optimal assay conditions, a standard curve for the ic-ELISA () was constructed with nonlinear regression using a four-parameter logistic equation. According to the standard curve, the IC50 was 0.12 ng/mL and the LOD was 0.02 ng/mL.
Figure 4. Standard curve of SPFX by ic-ELISA.
Immunochromatographic strip assay
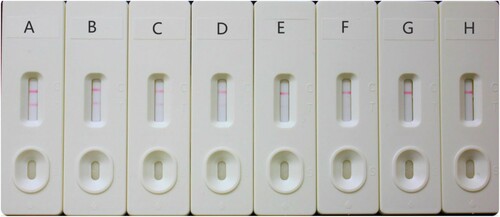
Each sample was spiked with the SPFX solution at concentrations of 0, 0.25, 0.5, 1, 1.25, 1.5, 2, and 2.5 ng/mL and then detected with a test strip. As shown in , a deep color was observed on the T line by the naked eye when 0 ng/mL SPFX was added. As the concentration of SPFX increased, the color on the T line became weaker. Accordingly, the vLOD was 1 ng/mL. The color disappeared completely when the concentration of SPFX reached 2 ng/mL. This concentration of 2 ng/mL was defined as the cut-off value when evaluating the sensitivity of the strip. Therefore, in the lateral-flow ICA strip analysis, the semiquantitative results evaluated with the naked eye were only detectable as negative (<1 ng/mL for SPFX), weakly positive (1–2 ng/mL for SPFX), or positive (>2 ng/mL for SPFX).
Figure 5. The spiked sample analysis with lateral-flow ICA strip by visual (n = 6). The spiked sample with SPFX: (A) 0 ng/mL; (B) 0.25 ng/mL; (C) 0.5 ng/mL; (D) 1 ng/mL; (E) 1.25 ng/mL; (F) 1.5 ng/mL; (G) 2 ng/mL; (H) 2.5 ng/mL. Negative result: the test line can be observed. Positive result: no test line is observed.
Sample analysis
SPFX (at concentrations of 0.8, 2, and 5 ng/mL) was added to the honey samples and measured with the ic-ELISA, the lateral-flow ICA strip, and HPLC. The average recoveries of SPFX by the ic-ELISA were 90.0–101.0% (). As expected, the semiquantitative results of samples (at concentrations of 0.8, 2, and 5 ng/mL) detected by the lateral-flow ICA strip were negative, weakly positive, and positive, respectively (). Good consistency was observed between the ic-ELISA and HPLC as shown in (R2 = 0.999). This further confirms the reliability of the two methods.
Table 2. The spiked sample analysis with ic-ELISA and lateral-flow ICA strip (n = 6).
Table 3. Concentrations of SPFX in honey samples determined by ic-ELISA and HPLC.
Conclusion
In this study, a sensitive and specific mAb 3D5 was obtained. Both the ic-ELISA method and the lateral-flow ICA strip method were established for the detection of SPFX in honey products. For the ic-ELISA method, under the optimum conditions, the IC50 for sample analysis was 0.12 ng/mL and the LOD was 0.02 ng/mL. The recovery rates ranged from 90.0% to 101.0% in honey samples. Good consistency was obtained between the ic-ELISA and HPLC. In the ICA strip, the vLOD and cut-off values were 1 and 2 ng/mL, respectively. In conclusion, both methods were effective for the analysis of honey samples, and these tools will play a significant role in future analytical applications.
Acknowledgements
We thank the reviewers for their valuable comments and recommendations, which have greatly improved the manuscript.
Disclosure statement
No potential conflict of interest was reported by the authors.
Additional information
Funding
Notes on contributors
Jingjing Li
Jingjing Li was borned in 1962. She is the dean of Chemical Technology and Food Science College, Zhengzhou Institute of Engineering and Technology. She is major in Food analysis and food safety and the Candidate of Academic Technology Leaders of Henan Province.
Aimin Zhi
Aimin Zhi borned in 1976. He obtained his Ph.D at Hunan Agricultural University in China in 2008. He worked in Henan Academy of Agricultural Sciences from 2009 to 2013 and joined Chemical Technology and Food Science College, Zhengzhou Institute of Engineering and Technology in 2014. He is major in the field of Rapid detection of food safety. Now, he authorized more than 45 patents and published more than 15 SCI papers.
Guochao Jia
Guochao Jia borned in 1978. He obtained his BS Degree and completed his MS at Henan Agricultural University in China in 2011 and 2014. Now, he is a Ph.D candidate of University of Shanghai for Science and Technology. He studies in the field of Rapid detection of food safety. Tel:+86-13120674219.
Hui Nie
Hui Nie Hui Nie is a lecturer in Chemical Technology and Food Science College, Zhengzhou Institute of Engineering and Technology. Her main research direction is food safety. She published 2 scientific papers about food detection.
Lianzhong Ai
Lianzhong Ai was borned in 1976. He worked in Shanghai Bright Dairy Co., Ltd from 2002 to 2013 and joined School of Medical Instrument and Food Engineering, University of Shanghai for Science and Technology in 2013. He has long been study in the field of food biotechnology research. Now, he authorized more than 30 patents and published more than 40 SCI papers.
Related Research Data
References
- Alcaráz, M. R., Siano, G. G., Culzoni, M. J., Muñoz de la Peña, A., & Goicoechea, H. C. (2014). Modeling four and three-way fast high-performance liquid chromatography with fluorescence detection data for quantitation of fluoroquinolones in water samples. Analytica Chimica Acta, 809(27), 37–46. doi: https://doi.org/10.1016/j.aca.2013.12.011
- Beberok, A., Wrześniok, D., Otręba, M., Miliński, M., Rok, J., & Buszman, E. (2015). Effect of norfloxacin and moxifloxacin on melanin synthesis and antioxidant enzymes activity in normal human melanocytes. Molecular and Cellular Biochemistry, 401(1–2), 107–114. doi: https://doi.org/10.1007/s11010-014-2297-7
- Buchberger, W. W. (2007). Novel analytical procedures for screening of drug residues in water, waste water, sediment and sludge. Analytica Chimica Acta, 593(593), 129–139. doi: https://doi.org/10.1016/j.aca.2007.05.006
- Cao, Z.-Z., Meng, M., Lu, S.-X., & Xi, R.-M. (2011). Development of an indirect chemiluminescent competitive ELISA to detect danofloxacin residues in milk. Analytical Letters, 44(6), 1077–1084. doi: https://doi.org/10.1080/00032719.2010.507295
- Chen, J.-J., & Jiang, J.-Q. (2013). Monoclonal antibody-based solvent tolerable indirect competitive ELISA for monitoring ciprofloxacin residue in poultry samples. Food and Agricultural Immunology, 24(3), 331–344. doi: https://doi.org/10.1080/09540105.2012.689817
- Deng, R.-G., Zhang, G.-P., Hu, X.-F., Cai, S.-J., Yang, J.-F., & Jia, G.-C. (2013). China Patent No. 201310333735.1. Zhengzhou: Patent Office of the People’s Republic of China.
- Duan, J. H., & Yuan, Z. H. (2001). Development of an indirect competitive elisa for ciprofloxacin residues in food animal edible tissues. Journal of Agricultural and Food Chemistry, 49(3), 1087–1089. doi: https://doi.org/10.1021/jf000091j
- Giacometti, A., Cirioni, O., Barchiesi, F., & Scalise, G. (2000). In-vitro activity and killing effect of polycationic peptides on methicillin-resistant Staphylococcus aureus and interactions with clinically used antibiotics. Diagnostic Microbiology and Infectious Disease, 38(2), 115–118. doi: https://doi.org/10.1016/S0732-8893(00)00175-9
- Gul, S., Sultana, N., Saeed Arayne, M., Shamim, S., & Akhtar, M. (2012). New method for optimization and simultaneous determination of sparfloxacin and non steroidal anti-inflammatory drugs: Its in-vitro application. American Journal of Analytical Chemistry, 3(4), 328–337. doi: https://doi.org/10.4236/ajac.2012.34045
- He, K., & Blaney, L. (2015). Systematic optimization of an SPE with HPLC-FLD method for fluoroquinolone detection in wastewater. Journal of Hazardous Materials, 282(23), 96–105. doi: https://doi.org/10.1016/j.jhazmat.2014.08.027
- Holtzapple, C. K., Buckley, S. A., & Stanker, L. H. (1997). Development of antibodies against the fluoroquinolone sarafloxacin and molecular modeling studies of cross-reactive compounds. Food and Agricultural Immunology, 9(1), 13–26. doi: https://doi.org/10.1080/09540109709354930
- Jiang, J.-Q., Yang, X.-F., Wang, Z.-L., Deng, R.-G., Wang, X.-N., & Zhang, G.-P. (2013). Development of a monoclonal antibody based colloidal gold immunochromatography strip for multianalysis of clenbuterol and ractopamine. Acta Veterinaria Et Zootechnica Sinica, 44(1), 87–94. Retrieved from http://118.145.16.233/Jweb_xmsy/EN/Y2013/V44/I1/87
- Jiang, J.-Q., Zhang, H.-T., Zhao, H.-Z., Zhao, K., Xu, Z.-Y., Chang, X.-Y., & Wang, Z. L. (2011). Development and optimization of a mAb-based indirect competitive elisa for enrofloxacin residue in duck. Applied Mechanics and Materials, 48–49, 423–427. doi: https://doi.org/10.4028/www.scientific.net/AMM.48-49.423
- Kong, D., Xie, Z., Liu, L., Song, S., Kuang, H., Cui, G., & Xu, C. (2017). Development of indirect competitive ELISA and lateral-flow immunochromatographic assay strip for the detection of sterigmatocystin in cereal products. Food and Agricultural Immunology, 28(2), 260–273. doi: https://doi.org/10.1080/09540105.2016.1263985
- Li, Y.-L., Hao, X.-L., Ji, B.-Q., Xu, C.-L., Chen, W., Shen, C.-Y., & Ding, T. (2009). Rapid determination of 19 quinolone residues in spiked fish and pig muscle by high-performance liquid chromatography (HPLC) tandem mass spectrometry. Food Additives & Contaminants: Part A, 26(3), 306–313. doi: https://doi.org/10.1080/02652030802484851
- Li, X., Li, P.-W., Zhang, Q., Li, R., Zhang, W., Zhang, Z.-W., … Tang, X.-Q. (2013). Multi-component immunochromatographic assay for simultaneous detection of aflatoxin B1, ochratoxin A and zearalenone in agro-food. Biosensors and Bioelectronics, 49, 426–432. doi: https://doi.org/10.1016/j.bios.2013.05.039
- Liu, L., Luo, L., Suryoprabowo, S., Peng, J., Kuang, H., & Xu, C. (2014). Development of an immunochromatographic strip test for rapid detection of ciprofloxacin in milk samples. Sensors, 14(9), 16785–16798. doi: https://doi.org/10.3390/s140916785
- Martín-Galiano, A. J., & de la Campa, A. G. (2003). High-efficiency generation of antibiotic-resistant strains of Streptococcus pneumoniae by PCR and transformation. Antimicrobial Agents and Chemotherapy, 47(4), 1257–1261. doi: https://doi.org/10.1128/AAC.47.4.1257-1261.2003
- Minnick, M. F., Wilson, Z. R., Smitherman, L. S., & Samuels, D. S. (2003). Gyra mutations in ciprofloxacin-resistant bartonella bacilliformis strains obtained in vitro. Antimicrobial Agents and Chemotherapy, 47(1), 383–386. doi: https://doi.org/10.1128/AAC.47.1.383-386.2003
- Peng, J., Liu, L. Q., Kuang, H., Cui, G., & Xu, C.-L. (2017). Development of an icELISA and immunochromatographic strip for detection of norfloxacin and its analogs in milk. Food and Agricultural Immunology, 28(2), 288–298. doi: https://doi.org/10.1080/09540105.2016.1263987
- Peng, D., Wang, Y., Feng, L., Cao, G., Tao, Y., Liu, Z., & Yuan, Z. (2016). Preparation of broadly specific monoclonal antibodies for simultaneous determination of fluoroquinolone residues in eggs. Food Analytical Methods, 9(12), 3520–3531. doi: https://doi.org/10.1007/s12161-016-0546-y
- Pinacho, D. G., Sánchez-Baeza, F., Pividori, M. I., & Marco, M. P. (2014). Electrochemical detection of fluoroquinolone antibiotics in milk using a magneto immunosensor. Sensors, 14(9), 15965–15980. doi: https://doi.org/10.3390/s140915965
- Sheng, W., Xia, X.-F., Wei, K., Ji, L., Li, Q.-X., & Xu, T. (2009). Determination of marbofloxacin residues in beef and pork with an enzyme-linked immunosorbent assay. Journal of Agricultural and Food Chemistry, 57(13), 5971–5975. doi: https://doi.org/10.1021/jf900940n
- Tian, X.-M., Zhang, Y.-Z., Sun, X.-L., Qian, H., & Ji, P. (2013). Preparation of anti-pefloxacin antibody and indirect competitive enzyme-linked immunosorbent assay for detection of pefloxacin residue in eggs. Journal of Analytical Science, 3, 15–22.
- Tlili, I., Caria, G., Ouddane, B., Ghorbel-Abid, I., Ternane, R., Trabelsi-Ayadi, M., & Net, S. (2016). Simultaneous detection of antibiotics and other drug residues in the dissolved and particulate phases of water by an off-line SPE combined with on-line SPE-LC-MS/MS: Method development and application. Science of the Total Environment, 563–564, 424–433. doi: https://doi.org/10.1016/j.scitotenv.2016.04.101
- Tochi, B. N., Khaemba, G., Isanga, J., Mukunzi, D., Liu, L., Peng, J., … Xu, C. (2016). Monoclonal antibody for the development of specific immunoassays to detect enrofloxacin in foods of animal origin. Food and Agricultural Immunology, 27(4), 435–448. doi: https://doi.org/10.1080/09540105.2015.1089844
- Tochi, B. N., Peng, J., Song, S., Liu, L., Kuang, H., & Xu, C. (2016). Production and application of a monoclonal antibody (mAb) against ofloxacin in milk, chicken and pork. Food and Agricultural Immunology, 27(5), 643–656. doi: https://doi.org/10.1080/09540105.2016.1148125
- Wang, Z., Zhang, H., Ni, H., Zhang, S., & Shen, J. (2014). Development of a highly sensitive and specific immunoassay for enrofloxacin based on heterologous coating haptens. Analytica Chimica Acta, 820, 152–158. doi: https://doi.org/10.1016/j.aca.2014.02.043
- Weigel, L. M., Anderson, G. J., & Tenover, F. C. (2002). DNA gyrase and topoisomerase iv mutations associated with fluoroquinolone resistance in proteus mirabilis. Antimicrobial Agents and Chemotherapy, 46(8), 2582–2587. doi: https://doi.org/10.1128/AAC.46.8.2582-2587.2002
- Yang, X. D., Wang, F. Y., Song, C. M., Wu, S. Y., Zhang, G. P., & Zeng, X. Y. (2015). Establishment of a lateral flow colloidal gold immunoassay strip for the rapid detection of estradiol in milk samples. LWT - Food Science and Technology, 64(1), 88–94. doi: https://doi.org/10.1016/j.lwt.2015.04.022
- Zhang, H.-T., Jiang, J.-Q., Wang, Z.-L., Chang, X.-Y., Liu, X.-Y., Wang, S.-H., & Chen, J.-S. (2011). Development of an indirect competitive elisa for simultaneous detection of enrofloxacin and ciprofloxacin. Journal of Zhejiang University SCIENCE B, 12(11), 884–891. doi: https://doi.org/10.1631/jzus.B1100076
- Zhi, A. M., Li, B. B., Liu, Q. T., Hu, X. F., Zhao, D., Hou, Y. Z., … Zhang, G. P. (2010). Development of a lateral-flow immunochromatographic test device for the rapid detection of difloxacin residues. Food and Agricultural Immunology, 21(4), 335–345. doi: https://doi.org/10.1080/09540105.2010.504766