
 ?Mathematical formulae have been encoded as MathML and are displayed in this HTML version using MathJax in order to improve their display. Uncheck the box to turn MathJax off. This feature requires Javascript. Click on a formula to zoom.
ABSTRACT
A monoclonal antibody (mAb) directed against phenylethanolamine A (PEA) was successfully prepared with the immunization of mice and cell fusion, and used to develop a detection method for a colloidal gold immunoassay. The 50% inhibitory concentration of mAb PEA-2G10 was 0.213 ng/mL, the limit of detection was 0.033 ng/mL, and its detection range 0.033–0.679 ng/mL. The recovery rate for PEA in swine urine was 84.5–90.8%, with good stability and accuracy. “Dry” immunoassay test strips were successfully prepared based on antibody 2G10. When the strip was tested in swine urine, the cutoff value for PEA was 5 ng/mL, with highly sensitivity. The method developed here can be used to test swine urine on-site for the rapid detection of PEA.
Introduction
Phenylethanolamine A (PEA, 2-[4-(nitrophenyl) butan-2-ylamino]-1-[4-methoxyphenyl]ethanol, C19H24N2O4) has been used illegally in animal husbandry in China in recent years (Tang, Cai, Deng, & Li, Citation2015). The addition of PEA to feed promotes pig growth and protein accumulation, improving the lean meat ratio and the fat conversion rate and shortening the animal growth cycle (Yan, Zhang, Tang, Deng, & Li, Citation2014). PEA can accumulate in animals, and if humans eat meat products from these animals, they can experience dizziness, rapid heartbeat, muscle tremor, palpitations, dyspnea symptoms, or even death in severe cases (Bai et al., Citation2012). Therefore, in 2010, the Chinese Ministry of Agriculture forbade the addition of PEA and other substances to animal feed and drinking water (Li et al., Citation2015).
Currently, the methods used to determine PEA concentrations include high-performance liquid chromatography (HPLC), liquid chromatography–tandem mass spectrometry (LC–MS/MS) (Li et al., Citation2017), gas chromatography–mass spectrometry (GC–MS), and liquid chromatography–mass spectrometry (LC–MS), as well as electrochemical (Liu, Cai, et al., Citation2017) and immunological methods (Mei et al., Citation2014). Although instrumental detection methods are characteristically highly accurate (Tang et al., Citation2015), the instruments are expensive, the preprocessing methods and operations are complex, and the times required for detection are long. Therefore, these properties limit the use of these techniques for rapid screening. Immunoassay methods are based on specific antigen–antibody binding reactions (Gu, Liu, Song, Kuang, & Xu, Citation2016), and have the advantages of strong specificity, high sensitivity, simplicity, and high throughput (Wang, Liufu, et al., Citation2016). The instruments are also inexpensive, the preprocessing is simple, and they are suitable for commercial production. The selectivity and sensitivity of immunoassays are much higher than those of conventional physical and chemical analyses. They are also applicable to the analysis of trace components in complex samples (Dai et al., Citation2015).
The enzyme-linked immunosorbent assay (ELISA) was developed almost simultaneously in the 1970s by the Swedish researchers Engvall and Perlman and the Dutch researchers Weeman and Schurrs (Jiang, Weng, & Li, Citation2011). The ELISA combines the specificity of the immune response with the sensitivity of enzyme-catalyzed reactions (Junhua et al., Citation2015). It has become the most widely used and fastest developing immunoassay technology because it is sensitive and convenient, the enzyme-labeled reagents are stable, there is no radioactive pollution, and it is easily automated (Uraipong et al., Citation2017). ELISAs play significant roles in clinical diagnoses (Capra, Ferro, Cannavo, La Rosa, & Zirilli, Citation2017) and the treatment of disease (Novakova et al., Citation2017), food safety testing (including the detection of pesticide and drug residues, pathogenic microorganisms, biological toxins, and heavy metal pollution) (Cimmino et al., Citation2017; Fraser et al., Citation2017; He et al., Citation2017; Wang et al., Citation2017), and genetic engineering (Delaney et al., Citation2017).
The aim of this study was to develop a monoclonal antibody (mAb) directed against PEA that has high sensitivity and is stable in pig urine. The antibody was used to develop a colloidal gold immunoassay test strip to meet the requirements for rapid PEA detection. The detection method established in this study has high sensitivity, is simple to operate, requires no sample pretreatment or specialized equipment, and is suitable for screening at the grass-roots level on farms and in slaughterhouses.
Materials and methods
Chemicals
Salbutamol, clenbuterol, ractopamine, cimaterol, brombuterol hydrochloride, formoterol, mabuterol, and terbutaline were purchased from J&K Scientific (Shanghai, China). PEA was from Dr Ehrenstorfer GmbH (Augsburg, Germany). Bovine serum albumin (BSA; MW, 67,000), ovalbumin (OVA; MW, 43,000 Da), and keyhole limpet hemocyanin (KLH; MW, 5,000,000 Da) were from Sigma Chemical Company (St. Louis, MO, USA). Enzyme-immunoassay-grade horseradish peroxidase (HRP), HRP-labeled goat anti-mouse immunoglobulin G (IgG) antibody, 3,3′,5,5′-tetramethylbenzidine (TMB), and gelatin were from Sigma-Aldrich (St. Louis, MO, USA). The culture medium for cell fusion was from Gibco (Shanghai, China). The materials for the test strips were from Shanghai Jieyi Biotechnology Co., Ltd. (Shanghai, China), and included glass fiber membrane for the sample pad, nitrocellulose (NC) membrane for immobilizing the coating antigen, Ahlstrom 8964 test paper for the conjugate pad, and H5076 filter paper for the absorbent pad. Chloroauric acid, trisodium citrate, and trehalose were purchased from Sigma Chemical Company.
Solutions
The coating buffer was prepared by 50 mM carbonate bicarbonate (CB, pH 9.6). The blocking buffer was 0.2% gelatin in CB. The assay buffer was phosphate-buffered saline (PBS; 0.01 M phosphate, pH 7.4), and the washing buffer was 0.05% Tween 20 in PBS. Solution A consisted of 9.33 g of citric acid, 36.8 g of Na2HPO4, and 180 µL of 30% H2O2 per 1000 mL. Solution B was prepared by adding 0.06% (v/v) TMB to glycol. The color solution contained solution A and solution B mixed in a 5:1 (v/v) ratio. Urine was obtained from a local pig farm (Wuxi, China).
Principle of the immunochromatographic strip test
The colloidal gold test strip is based on a specific antigen–antibody reaction and detects a specific substance. An antibody is combined with gold nanoparticles by electrostatic adsorption to form the gold-labeled mAb. The test line (T line) and the control line (C line) on the colloidal gold test strip produce the results: the antigen is sprayed onto the T line and an anti-mouse IgG antibody is sprayed on the C line. When the antigen and antibody react, the T line becomes colored, producing a visible test result. The sample solution is added to the sample pad, flows in the direction of the absorbent pad, and passes through the conjugate layer that contains the colloidal gold-labeled antibody. If the sample solution does not contain the substance to be tested, the gold-labeled mAb reacts with the antigen on the T line, coloring the T line. However, if the sample solution contains the substance to be measured, it competes with the antigen for the gold-labeled mAb on the T line, causing less colloidal gold label to be captured by the coating antigen, so the T line is less intensely colored or even lacks color altogether. The free gold-labeled mAb or mAb conjugate is captured by the anti-mouse IgG antibody, so the C line always shows a clear color (Liu, Liu, et al., Citation2017).
Antigen preparation
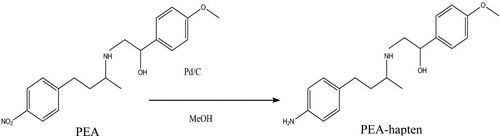
The PEA hapten was synthesized with the procedure described by Cao et al. (Citation2013; ). The immunogen and coating antigen were directly coupled to a protein (BSA, KLH, or OVA) with the diazobenzidine method. First, 5.16 mg of PEA hapten was dissolved in 40 µL of 1 M hydrochloric acid (HCl) and 1 mL of methanol solution. The mixture was then stored at 4°C for 0.5 h, after which 5 µL of 30% sodium nitrite was added and stirred at 4°C for 1 h in the dark (solution I). The protein (10 mg; BSA, KLH, or OVA) was dissolved in 1 mL of 0.1 M CB (pH 9.6). Solution I was added to the protein solution and stirred for 4 h in the dark. The conjugate was dialyzed against 0.01 M PBS for 2 days. These antigens were stored at −20°C before use.
Figure 1. Synthesis of the PEA hapten.
mAb preparation
In this study, BALB/c mice (6–8 weeks old) were immunized by subcutaneous injection with the immunogen (100 µg per mouse) mixed with an equal volume of complete Freund’s adjuvant. After 21 days, the immunogen (50 µg per mouse) was emulsified with the same volume of incomplete Freund’s adjuvant for the booster immunizations, which were repeated every 3 weeks. One week after the third immunization, the mouse blood was collected and tested with an indirect competitive ELISA (ic-ELISA), to select the mice whose sera showed the highest affinity and sensitivity for PEA. These mice were later immunized intraperitoneally for cell fusion. After three times subclones, cell lines with good growth, good specificity, and high sensitivity for PEA were obtained by screening the subclones and hybridoma cells. The cell lines were then expanded in culture and injected into mice to prepare the peritoneal ascites. The antibody was purified from the ascites with the octanoic acid–saturated ammonium sulfate precipitation method. The antibody concentration was measured with UV spectrophotometry.
Characterization of mAbs
An ic-ELISA was used to screen for the mouse sera with the best affinity and sensitivity for PEA. The bimodal matrix method was used to measure the mouse sera in this experiment. Each well of a 96-well plate was incubated with 100 µL of the coating antigen (PEA–OVA) at 37°C for 2 h. After the plates were washed three times, 200 µL of blocking buffer was added to each well and incubated at 37°C for 2 h. After the plates were washed, they were placed in a 37°C incubator for 30 min. Then 50 µL/well standard and diluted mouse serum was added to the wells and incubated at 37°C for 30 min. After the plates were washed, HRP-labeled goat anti-mouse IgG antibody was added and incubated at 37°C for 30 min, and the plates were washed three times again. Color buffer (100 µL) was added to each well and incubated for 30 min in the dark. The reaction was terminated by the addition of 50 µL/well sulfuric acid (2 M). The absorbance at 450 nm of each well was determined with a microplate reader.
Cross-reactivity
Cross-reactivity (CR) was used to determine the specificity of the mAb. Salbutamol, clenbuterol, ractopamine, cimaterol, brombuterol, mabuterol, terbutaline, and formoterol were tested with an ic-ELISA (Kong, Liu, Song, Kuang, & Xu, Citation2017).
Screening PEA-negative pig urine samples
The purpose of this experiment was to produce a quality product that meets the requirements of the market. Therefore, the product must function in the presence of pig urine, so PEA-negative urine samples were collected for testing. All the samples were from slaughterhouses in Wuxi and Nanjing. The pig urine samples were sent to Jiangsu Province Entry–Exit Inspection and Quarantine Bureau (Nanjing, Jiangsu) for testing, and the Beta-Agonists ELISA test kit (Randox Food Diagnostics, Crumlin, UK) was used to screen the samples for PEA-negative pig urine.
The urine was purified by centrifugation (4700 × g, 10 min) and stored at −20°C before analysis. Different concentrations of the PEA standard were added to the urine, and the ic-ELISA was used to analyze the effectiveness of the mAb in urine.
Preparation of colloidal gold-labeled mAb
The average diameter of the gold nanoparticles used for the experiment was 30 nm. The specific method was as follows: 100 mL of chloroauric acid (0.01 g/L) was boiled for 30 min, and then 2 mL of trisodium citrate solution (1%) was added, mixed, and stirred. After 1 min, the color of the solution turned to wine red. Heating was continued, and the sample was stirred for 15 min until the reaction was complete. Ultrapure water was added to the solution to a final total volume of 100 mL, and the solution was stored at 4°C (Kong, Xie, et al., Citation2017).
Preparation of the immunochromatographic strip
The purified mAb was mixed with 1 mL of colloidal gold solution and 0.1 M K2CO3 and stirred for 2 h at room temperature. BSA (10%, 100 mL) was added to the solution and stirred for 2 h, and the mixture was then centrifuged at 5100 × g for 20 min to remove any unbound antibody and BSA from the supernatant. The precipitate was redissolved to a total volume of 0.1 mL and stored at 4°C (Wang, Zou, et al., Citation2016). The “dry” immunochromatographic strip consisted of five parts: a polyvinylchloride (PVC) backing plate, a sample pad, an absorbent pad, a conjugate pad (glass fiber), and an NC membrane. The NC membrane was attached to the middle of the PVC backing plate; the absorbent pad was secured to the top of the PVC backing plate; the conjugate pad and the sample pad were pasted sequentially onto the bottom of the PVC backing plate. The mAb-labeled gold nanoparticles were sprayed onto the glass fiber material, forming the conjugate pad. The goat anti-mouse IgG antibody (0.5 mg/mL) was sprayed onto the NC membrane to form the C line, and the coating antigen was sprayed onto the NC membrane to form the T line. The NC membrane was then stuck to the combined pad at 37°C for 2 h. The test strips were cut to a width of 3 mm (Liu et al., Citation2014).
Assay of the immunochromatographic strip
Once the liquid sample was added to the sample pad, it migrated upward by capillary action. If the T line and C line became deep red after 3–5 min, the sample was negative. However, if the C line took on a deep color, but the T line was light colored or had no color, the sample was considered positive.
Recovery
The recovery rate reflects the accuracy of the antibody. In this study, PEA-negative urine samples were selected for the recovery experiment. Different concentrations of the PEA standard were added to PEA-negative urine and analyzed with the ic-ELISA.
Results and discussion
Characterization of the immunogen and coating antigen
Because the molecular weight of the hapten itself is small, it is not immunogenic. Therefore, a carrier protein must be coupled to it to increase its molecular weight and confer strong immunogenicity. BSA, KLH, and OVA are commonly used for this purpose. OVA is less immunogenic than BSA and KLH, so it is often coupled to a hapten to produce the coating antigen. We selected KLH as the immunogen to stimulate the mice to produce an adequate immune response. The PEA hapten was coupled to the proteins with the diazotization method to form the immunogen and the coating antigen. The shape and position of the absorption peak for PEA changed significantly after the reactions, and each complete PEA antigen was identified with UV spectrophotometry. The results for the characterization of the antigens are shown in .
Figure 2. The UV–Vis spectra of different antigens. Antigens with KLH as immunogen (a) and antigens with OVA as coating antigens (b).
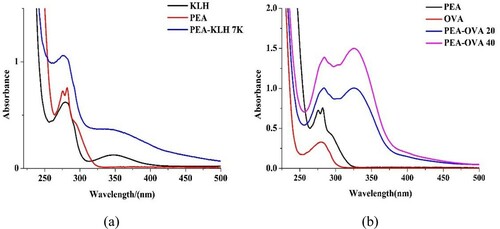
The antigen produced with the diazotization method showed an absorption peak for the diazo bond at 340 nm. In (a), this peak at 340 nm coincides with the characteristic peak for KLH, but the peak for the coupling product at the same concentration is larger. Compared with the absorption peak for the protein, the peak for the coupling product was slightly blue-shifted under the influence of the hapten. This confirms that the immunogen was constructed successfully. As can be seen in (b), the absorption peak for the diazo bond causes the absorption peak for the coupling product at 280 nm to be slightly red-shifted. This indicates that the PEA hapten was successfully coupled to the proteins and that the coating antigen was constructed correctly.
Preparation and sensitivity of mAbs
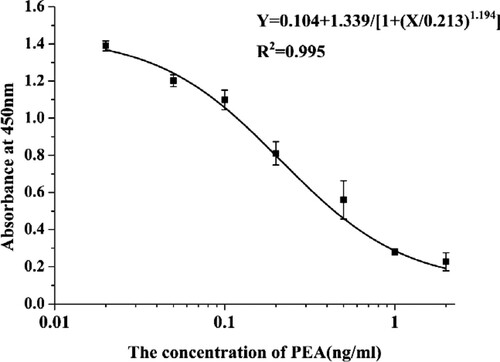
After five immunizations, the test mice produced antibodies at high titers, which exerted good inhibitory effects, with IC50 values of 20 µg/L. In this study, mouse splenocytes and Sp2/0 myeloma cells were fused with the polyethylene glycol fusion technique. We screened the subclones and hybridoma cells and selected PEA-2G10 for expanded culture and cryopreservation. An ic-ELISA was used to test and verify the mAb. shows that the standard curve for mAb 2G10 against the PEA concentration was y = 0.104 + 1.339/[1 + (x/0.312)1.194]. The linear regression correlation coefficient (R2) was 0.996, the IC50 value was 0.213 ng/mL, the limit of detection (IC10) was 0.033 ng/mL, and the linear range was 0.066–0.679 ng/mL. The purified PEA-2G10 mAb was used for the immunochromatographic strip assay.
Figure 3. The standard curve of developed Ic-ELISA method.
Cross-reactivity
The specificity of the antibody is expressed as its CR, or its capacity to recognize other similar and dissimilar substances. When the CR of a substance for closely related substances is <10%, it is considered specific. To determine the specificity of the anti-PEA antibody, its CR with salbutamol, clenbuterol, ractopamine, cimaterol, brombuterol, formoterol, mabuterol, and terbutaline was measured. The results are shown in . From these results, antibody 2G10 only reacted with PEA, and its CRs with other substances were <10%. Therefore, PEA-2G10 is a highly specific mAb.
Table 1. Cross-reactivity of PEA-2G10.
Characterization of the immunochromatographic strip for PEA in pig urine
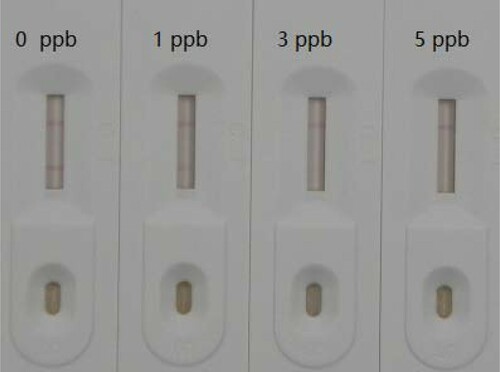
The results obtained with the dry colloidal gold immunoassay test strip based on mAb PEA-2G10 are shown in . To facilitate the detection of PEA, we optimized the conditions used to prepare the test strip to maximize the dark color on the T line and C line. The concentrations of the PEA standard solutions were 0, 1, 3, and 5 ng/mL. As the standard concentration increased, the color of the T line became weaker and disappeared completely in the presence of 5 ng/mL PEA, which meets the criterion of the current market.
Figure 4. Analysis of PEA concentration with strip (the strip cut-off completely at 5 ng/mL of PEA).
Recovery test with ic-ELISA
The concentrations of spiked PEA added to the PEA-negative pig urine samples were 0.1, 0.2, and 0.4 ng/mL. The experiment was performed with the ic-ELISA. The results are shown in . The recovery rates were 84.5–90.8%, indicating that the analytical method established with mAb PEA-2G10 has good stability and accuracy, and can be applied to the actual detection of PEA in pig urine samples.
Table 2. Recovery of PEA in swine urine by ELISA (n = 3).
Conclusions
In this study, the PEA hapten was directly coupled to proteins to generate immunogen and coating antigen. An mAb directed against PEA was produced with the construction of hybridoma cells, and used to develop an ELISA and colloidal gold test strips. The IC50 value of mAb PEA-2G10 was 0.213 ng/mL, with a linear range of 0.066–0.679 ng/mL. PEA-2G10 showed little CR with other β-agonists, indicating the high specificity of the antibody. As screened by urine adding a matrix directly, this immunochromatographic strip based on mAb PEA-2G10 directly detects PEA in animal urine samples, with a shorter detection time than other methods.
Disclosure statement
No potential conflict of interest was reported by the authors.
Additional information
Funding
Notes on contributors
Wei Jiang
Wei Jiang got her bachelor from Yangzhou University, Yangzhou, China in 2015 and then began to study in Jiangnan University (Wuxi, China) for her Master Degree in food science. Her research interest includes immunoassay development for food safety.
Lu Zeng
Lu Zeng got her bachelor from Zhejiang Chinese Medical University, Hangzhou, China in 2015 and then began to study in Jiangnan University (Wuxi, China) for her Master Degree in food science. Her research interests are immunoassay applications in food.
Liqiang Liu
Liqiang Liu got his Ph.D in Food science in 2014 from Jiangnan University, Wuxi, China and then became a faculty in the college of Food science and technology of Jiangnan University. His research interests are immunochromatographic strip design and application.
Shanshan Song
Shanshan Song got her Master degree in Food science in 2012 from Jiangnan University, Wuxi, China and then became a research assistant in the college of Food science and technology of Jiangnan University. Her research interests are monoclonal antibody development.
Hua Kuang
Hua Kuang got her Ph.D from China Agricultural University in 2009 and then began to work as a faculty in the college of Food science and technology of Jiangnan University. She is currently a full professor in food safety. Her research interests are biosensor development.
Related Research Data
References
- Bai, Y. H., Liu, Z. H., Bi, Y. F., Wang, X., Jin, Y. Z., Sun, L., … Xu, S. X. (2012). Preparation of polyclonal antibodies and development of a direct competitive enzyme-linked immunosorbent assay to detect residues of phenylethanolamine A in urine samples. Journal of Agricultural and Food Chemistry, 60(46), 11618–11624. doi: https://doi.org/10.1021/jf3036066
- Cao, B. Y., He, G. Z., Yang, H., Chang, H. F., Li, S. Q., & Deng, A. P. (2013). Development of a highly sensitive and specific enzyme-linked immunosorbent assay (ELISA) for the detection of phenylethanolamine A in tissue and feed samples and confirmed by liquid chromatography tandem mass spectrometry (LC-MS/MS). Talanta, 115, 624–630. doi: https://doi.org/10.1016/j.talanta.2013.06.026
- Capra, A. P., Ferro, E., Cannavo, L., La Rosa, M. A., & Zirilli, G. (2017). A child with severe irondeficiency anemia and a complex TMPRSS6 genotype. Hematology (Amsterdam, Netherlands), 22(9), 559–564. doi:https://doi.org/10.1080/10245332.2017.1317990
- Cimmino, A., Iannaccone, M., Petriccione, M., Masi, M., Evidente, M., Capparelli, R., … Evidente, A. (2017). An ELISA method to identify the phytotoxic Pseudomonas syringae pv. actinidiae exopolysaccharides: A tool for rapid immunochemical detection of kiwifruit bacterial canker. Phytochemistry Letters, 19, 136–140. doi: https://doi.org/10.1016/j.phytol.2016.12.027
- Dai, M. Y., Gong, Y. F., Liu, A., Zhang, L. L., Lin, J. X., Zhang, M. Z., & Yu, X. P. (2015). Development of a colloidal gold-based lateral-flow immunoassay for the rapid detection of phenylethanolamine A in swine urine. Analytical Methods, 7(10), 4130–4137. doi: https://doi.org/10.1039/C5AY00641D
- Delaney, A. M., Adams, C. F., Fernandes, A. R., al-Shakli, A. F., Sen, J., Carwardine, D. R., … Chari, D. M. (2017). A fusion of minicircle DNA and nanoparticle delivery technologies facilitates therapeutic genetic engineering of autologous canine olfactory mucosal cells. Nanoscale, 9(25), 8560–8566. doi: https://doi.org/10.1039/C7NR00811B
- Fraser, S., Shih, J. Y., Ware, M., O’Connor, E., Cameron, M. J., Schwickart, M., … Regnstrom, K. (2017). Current trends in ligand binding real-time measurement technologies. The AAPS Journal, 19(3), 682–691. doi: https://doi.org/10.1208/s12248-017-0067-7
- Gu, H., Liu, L., Song, S., Kuang, H., & Xu, C. (2016). Development of an immunochromatographic strip assay for ractopamine detection using an ultrasensitive monoclonal antibody. Food and Agricultural Immunology, 27(4), 471–483. doi: https://doi.org/10.1080/09540105.2015.1126808
- He, J., Wu, N., Luo, P., Guo, P., Qu, J., Zhang, S., … Jiang, W. (2017). Development of a heterologous enzyme-linked immunosorbent assay for the detection of clindamycin and lincomycin residues in edible animal tissues. Meat Science, 125, 137–142. doi: https://doi.org/10.1016/j.meatsci.2016.11.024
- Jiang, H., Weng, X., & Li, D. (2011). Microfluidic whole-blood immunoassays. Microfluidics and Nanofluidics, 10(5), 941–964. doi: https://doi.org/10.1007/s10404-010-0718-9
- Junhua, L., Chunsheng, L., Meng, W., Yan, Z., Xiaofei, M., Hua, C., & Jinghui, Y. (2015). Development of an ultrasensitive immunochromatographic assay (ICA) strip for the rapid detection of phenylethanolamine A in urine and pork samples. Journal of Food Science, 80(4), T894–T899. doi: https://doi.org/10.1111/1750-3841.12814
- Kong, D. Z., Liu, L. Q., Song, S. S., Kuang, H., & Xu, C. L. (2017). Development of sensitive, rapid, and effective immunoassays for the detection of vitamin B-12 in fortified food and nutritional supplements. Food Analytical Methods, 10(1), 10–18. doi: https://doi.org/10.1007/s12161-016-0543-1
- Kong, D. Z., Xie, Z. J., Liu, L. Q., Song, S. S., Kuang, H., & Xu, C. L. (2017). Development of ic-ELISA and lateral-flow immunochromatographic assay strip for the detection of vancomycin in raw milk and animal feed. Food and Agricultural Immunology, 28(3), 414–426. doi: https://doi.org/10.1080/09540105.2017.1293014
- Li, J., Chen, Y., Su, Y. Q., Ding, X. M., Xia, W. S., Liu, H. M., & Zhang, Y. B. (2017). Single-step multiresidue determination of β-lactam antibiotics and β-agonists in porcine muscle by liquid chromatography-tandem mass spectrometry. Food Analytical Methods, 10(7), 2185–2193. doi: https://doi.org/10.1007/s12161-016-0738-5
- Li, X. M., Wang, W. J., Wang, L. M., Wang, Q., Pei, X. Y., & Jiang, H. Y. (2015). Rapid determination of phenylethanolamine A in biological samples by enzyme-linked immunosorbent assay and lateral-flow immunoassay. Analytical and Bioanalytical Chemistry, 407(25), 7615–7624. doi: https://doi.org/10.1007/s00216-015-8917-6
- Liu, Y., Cai, M., Wu, W., Fang, Y., She, P., Xu, S., & Bao, N. (2017). Multichannel electroanalytical devices for competitive ELISA of phenylethanolamine A. Biosensors & Bioelectronics, 99(2018), 21–27.
- Liu, R., Liu, L. Q., Song, S. S., Cui, G., Zheng, Q. K., Kuang, H., & Xu, C. L. (2017). Development of an immunochromatographic strip for the rapid detection of 10 β-agonists based on an ultrasensitive monoclonal antibody. Food and Agricultural Immunology, 28(4), 625–638. doi: https://doi.org/10.1080/09540105.2017.1309358
- Liu, L. Q., Luo, L. J., Suryoprabowo, S., Peng, J., Kuang, H., & Xu, C. L. (2014). Development of an immunochromatographic strip test for rapid detection of ciprofloxacin in milk samples. Sensors, 14(9), 16785–16798. doi: https://doi.org/10.3390/s140916785
- Mei, L., Cao, B., Yang, H., Xie, Y., Xu, S., & Deng, A. (2014). Development of an immunoaffinity chromatography column for selective extraction of a new agonist phenylethylamine A from feed, meat and liver samples. Journal of Chromatography B, 945–946, 178–184. doi: https://doi.org/10.1016/j.jchromb.2013.11.057
- Novakova, L., Axelsson, M., Khademi, M., Zetterberg, H., Blennow, K., Malmestrom, C., … Lycke, J. (2017). Cerebrospinal fluid biomarkers as a measure of disease activity and treatment efficacy in relapsing-remitting multiple sclerosis. Journal of Neurochemistry, 141(2), 296–304. doi: https://doi.org/10.1111/jnc.13881
- Tang, Q. H., Cai, F. D., Deng, A. P., & Li, J. G. (2015). Ultrasensitive competitive electrochemiluminescence immunoassay for the β-adrenergic agonist phenylethanolamine A using quantum dots and enzymatic amplification. Microchimica Acta, 182(1–2), 139–147. doi: https://doi.org/10.1007/s00604-014-1292-8
- Uraipong, C., Allan, R., Li, C., Kennedy, I., Wong, V., & Lee, N. (2017). A survey of 17α-ethinylestradiol and mestranol residues in Hawkesbury River, Australia, using a highly specific enzyme-linked immunosorbent assay (ELISA) demonstrates the levels of potential biological significance. Ecotoxicology and Environmental Safety, 144, 585–592. doi: https://doi.org/10.1016/j.ecoenv.2017.06.077
- Wang, X., Liu, F., Shao, Q., Yin, Z., Wang, L., & Fu, Z. (2017). A novel chemiluminescent immunochromatographic assay strip for rapid detection of mercury ions. Analytical Methods, 9(16), 2401–2406. doi: https://doi.org/10.1039/C7AY00231A
- Wang, X. M., Liufu, T. L., Beloglazova, N. V., Luo, P. J., Qu, J. W., & Jiang, W. X. (2016). Development of a competitive indirect enzyme-linked immunosorbent assay for screening phenylethanolamine A residues in pork samples. Food Analytical Methods, 9(11), 3099–3106. doi: https://doi.org/10.1007/s12161-016-0500-z
- Wang, Z., Zou, S., Xing, C., Song, S., Liu, L., & Xu, C. (2016). Preparation of a monoclonal antibody against testosterone and its use in development of an immunochromatographic assay. Food and Agricultural Immunology, 27(4), 547–558. doi: https://doi.org/10.1080/09540105.2015.1137276
- Yan, P. P., Zhang, J., Tang, Q. H., Deng, A. P., & Li, J. G. (2014). A quantum dot based electrochemiluminescent immunosensor for the detection of pg level phenylethanolamine A using gold nanoparticles as substrates and electron transfer accelerators. The Analyst, 139(17), 4365–4372. doi: https://doi.org/10.1039/C4AN00378K