
ABSTRACT
Humans and animals are exposed to mycotoxins naturally present in foods. Ochratoxin A (OTA), one of the most abundant and toxic mycotoxins, is ubiquitous in nature and harmful to humans and animals. In this study, we developed a rapid, simple, specific, and sensitive lateral-flow immunochromatographic assay for detection of OTA in 0.01 M phosphate-buffered saline solution (PBS) (pH 7.4) and in red wine. We produced sensitive and selective monoclonal antibody against OTA. Under optimized conditions, the cut-off limit of the test strip was 10 ng/mL OTA in 0.01 M PBS (pH 7.4) and in red wine. The results were obtained within 10 min. Therefore, our developed method is useful for the detection of OTA in red wine.
Introduction
Mycotoxins, secondary metabolites produced by fungi, are potentially dangerous to human and animal health (Turner et al., Citation2015; Zheng, Xu, Wang, Zhan, & Chen, Citation2014). Mycotoxin contamination can occur at any stage during food production, including cultivation and storage (Reddy et al., Citation2010). For example, wine, beer, cereals, nuts, dried fruits, coffee, spices, beans, and beverages may become contaminated during their preparation (Andrade & Lancas, Citation2017).
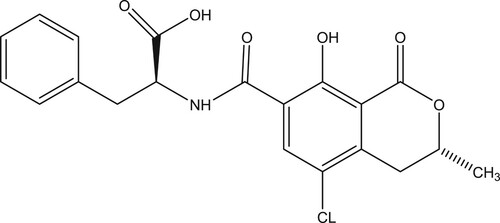
The mycotoxin ochratoxin A (, OTA) is a ubiquitous chlorophenolic mycotoxin that is produced by fungi of the genera Penicillium and Aspergillus. Due to their toxicity and prevalence, mycotoxins constitute a major concern in food safety (Kokkonen, Jestoi, & Rizzo, Citation2005). The occurrence of OTA in food and feed has been reported worldwide. Wine and cereal are considered to be one of the major food commodities susceptible to OTA contamination (Karczmarczyk et al., Citation2016; Karczmarczyk, Haupt, & Feller, Citation2017). Even though it is difficult to completely eliminate mycotoxins from foods, it is possible to decrease the risk of exposure via a rigorous monitoring programme. In Brazil and in the European Union, the maximum permissible level of OTA in wine is 2 µg/kg (Andrade & Lancas, Citation2017; Zhu et al., Citation2015).
Figure 1. Chemical structure of ochratoxin A.
To monitor the presence of OTA in foods, several detection methods have been developed including thin layer chromatography (TLC) (Teixeira et al., Citation2011), high-performance liquid chromatography (HPLC) (Dohnal, Dvorak, Malir, Ostry, & Roubal, Citation2013; Marino-Repizo et al., Citation2015; Marino-Repizo, Gargantini, Manzano, Raba, & Cerutti, Citation2017), and liquid chromatography-tandem mass spectrometry (LC-MS/MS) (Kim, Hong, et al., Citation2017; Miro-Abella et al., Citation2017; Zhang et al., Citation2017).
HPLC is the most frequently used due its high sensitivity and accuracy. Even though it can simultaneously detect major ochratoxins, HPLC is expensive, time consuming, and unsuitable for on-site detection (Gu, Liu, Song, Kuang, & Xu, Citation2016; Liu, Suryoprabowo, Zheng, Song, & Kuang, Citation2017; Suryoprabowo, Liu, Peng, Kuang, & Xu, Citation2014). TLC, the national standard test method, is rarely used because of its low sensitivity and specificity (Isanga et al., Citation2017; Khaemba et al., Citation2016; Suryoprabowo, Liu, Peng, Kuang, & Xu, Citation2015).
Immunoassays based on antibody–antigen recognition are highly specific and could be a sensitive tool for the detection of OTA. The enzyme-linked immunosorbent assay (ELISA) (Garcia-Fonseca, Ballesteros-Gomez, & Rubio, Citation2016; Kim, Lee, Nam, Seo, & Yoo, Citation2017) has high specificity, is applicable for high throughput applications, requires simple sample preparation steps, and is cost-effective (Kong et al., Citation2017; Peng, Liu, Kuang, Cui, & Xu, Citation2017). The lateral-flow immunochromatographic strip allows the semi-quantitative analysis of several drug residues and has become increasingly popular because it is simple, rapid (can be performed in 5–10 min), specific, and sensitive.
OTA residues in cereal samples (Sun et al., Citation2016), agricultural products (Li et al., Citation2013; Majdinasab et al., Citation2015), and Astragalus membranaceus (Zhou et al., Citation2016) have been detected using the lateral-flow immunochromatographic strip test. However, no studies have used the immunochromatographic lateral-flow test to determine OTA in red wine samples. The aim of this study was to develop a lateral-flow immunochromatographic test strip for the detection of OTA in red wine.
Material and methods
Chemicals and reagents
OTA was purchased from J&K Scientific (Shanghai, China). Complete Freund’s adjuvant (FCA), incomplete Freund’s adjuvant (FIA), and enzyme immunoassay-grade horseradish peroxidase (HRP)-labeled goat anti-mouse immunoglobulin were obtained from Sigma (St. Louis, MO, USA). QuickAntibody-Mouse 5W was supplied by Biodragon-Immunotech Co., Ltd. (Beijing, China). N,N″-carbonyldiimidazolen (CDI) was acquired from East China Chemicals Co., Ltd. (Wuxi, China) and gelatin was obtained from Beijing Biodee Biotechnology Co., Ltd. (Beijing, China). Tetramethyl benzidine and HRP were purchased from Aladdin Chemistry Co., Ltd. (Shanghai, China). All reagents used for cell fusion were from Sunshine Biotechnology Co., Ltd. (Nanjing, China). Bovine serum albumin (BSA) and keyhole-limpet haemocyanin (KLH) were purchased from Solarbio Science & Technology, Co, Ltd. (Beijing, China). All other reagent and chemicals were supplied by the National Pharmaceutical Group Chemical Reagent Co, Ltd. (Shanghai, China).
Nitrocellulose (NC) high-flow plus membranes (Pura-bind RP) were obtained from Whatman-Xinhua Filter Paper Co., Ltd. (Hangzhou, China). Glass fibre membrane (CB-SB08) used for the sample pad, polyvinylchloride backing material and absorbance pad (SX18) were supplied by Goldbio Tech Co., Ltd. (Shanghai, China). A BioDot TSR 3000 Membrane Strip Reader (Gene Company Limited, Shanghai, China) was used to test the colour intensities of colloidal gold nanoparticles (GNPs). The coating antigens (OTA-CDI-BSA) and specific monoclonal antibodies (mAbs; anti-OTA mAb, No. 1H2) were generated in our laboratory.
All buffer solutions were prepared using ultrapure water (Milli-Q purification system, Millipore Co., Bedford, MA, USA). The strip cutting instrument was CM 4000 (Gene, Shanghai, China), and the dispensers were Airjet Quanti 3000TM and Biojet Quanti 3000TM (XinqidianGene-technology Co., Ltd., Beijing, China).
Preparation and characterization of monoclonal anti-OTA antibody
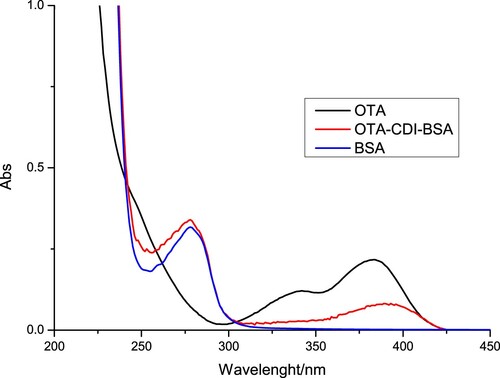
OTA was conjugated to BSA using the CDI method (Cao et al., Citation2015). Briefly, OTA was mixed with BSA at a 50:1 ratio and dissolved in 2 mL of acetone with CDI. The mixture was stirred at room temperature for 3 h to form an activated amide intermediate. The reaction mixture was subsequently vacuum-dried and the resulting yellow powder was dissolved in 2 mL of anhydrous N-N-dimethylformamide (DMF). This solution was added dropwise to BSA dissolved in 4 mL of carbonate buffer (0.05 M, pH 9.5). After stirring for 5 h at room temperature, OTA-CDI-BSA () was dialysed against 0.025 M carbon buffer for 3 days at room temperature, and stored at –20°C until use.
Figure 2. The UV spectra characterization for OTA-CDI-BSA, OTA, and BSA.
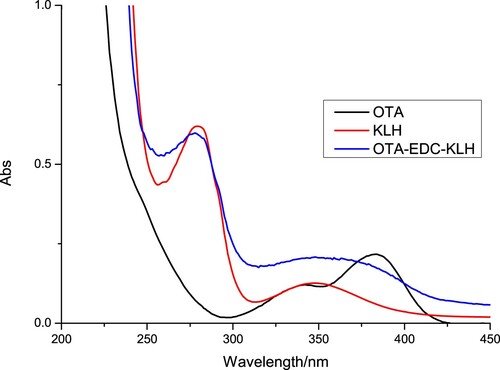
We used female BALB/c mice (6–8 weeks age) to produce mAbs against OTA. OTA was conjugated to KLH using the ester method (Liu et al., Citation2017). The mice were immunized subcutaneously with OTA-EDC-KLH (). Briefly, a mixture of OTA, carboxyl-reactive carbodiimide cross linker (1-ethyl-3-[3-dimethylaminopropyl]carbodiimide hydrochloride) (EDC), and N-hydroxysuccinimide (NHS) were added to DMF and incubated for 24 h (solution 1). KLH was mixed with 0.01 M phosphate-buffered saline solution (PBS) (solution 2). Solution 1 was slowly added to solution 2 while stirring, and the mixture was stirred continuously for 8 h at room temperature. OTA-EDC-KLH was dialysed against distilled water for 3 days and subsequently against 0.01 M PBS for 3 days.
Figure 3. The UV spectra characterization for OTA-EDC-KLH, OTA, and KLH.
We used FCA in the first immunization and FIA was used in the subsequent booster injections. The mice were immunized with OTA-EDC-KLH every 3 weeks with 100 µg (first immunization) and 50 µg (subsequent injections; 2–5 times). We analysed the antibodies in blood samples of mice using ELISA. The mouse with the highest titre was sacrificed and its splenocytes were fused with Sp 2/0 murine myeloma cells. The resulting hybridomas were screened using indirect ELISA. The selected hybridoma cells were expanded and injected into BALB/c mice to produce mAbs. The ascites were harvested and purified by the caprylic acid-ammonium sulphate precipitation method (Chen et al., Citation2014), and the purified mAbs were stored at –20°C.
Development of the immunochromatographic strip
Preparation of colloidal GNPs
All the solvents were prepared with ultrapure water and passed through a 0.22 µm filter membrane. Chlorauric acid (0.1 g/L, 25 mL) was heated to boiling under constant stirring. Following the addition of 1.0 mL of 1% w/v sodium citrate tribasic dehydrate, the mixture was stirred for 30 min. When the colour of the solution turned wine-red, it was allowed to cool to room temperature, and stored at 4°C. Observations by transmission electron microscopy revealed that the GNPs had a nearly uniform particle size of 15 nm.
Preparation of colloidal gold-labelled mAb
We used anti-OTA mAb (no. 1H2) with a half-maximal inhibitory concentration (IC50) of 0.1 ng/mL. Colloidal GNP solution (10 mL) was adjusted to pH 7.0 with 0.1 M K2CO3 (40 µL). Briefly, mAbs (0.50 mL) were added to colloidal GNP solution dropwise. After 35 min, 1 mL of 10% (w/v) BSA was added, and the mixture was stirred for 2 h. The product was centrifuged at 8000 rpm for 45 min to remove any gold aggregates. The solution was separated into two layers; the lower layer (gold-labelled mAbs) was rinsed with 0.02 M phosphate buffer containing 5% sucrose, 1% BSA, and 0.5% polyethylene glycol (PEG) 6000 (pH 7.4). The conjugation products were reconstituted to 1 mL using gold-labelling resuspension buffer (0.02 M PBS, 5% sucrose, 2% sorbitol, 1% mannitol, 0.1% PEG, 0.1% tween, and 0.04% NaN3) and stored at 4°C.
Test procedure and principle
Prior to the test, 50 µL of gold-labelled mAbs is mixed with 150 µL of sample solution, allowed to react for about 5 min, and added onto the sample pad. The solution migrates to the absorbent pad, and the test results are visualized within 5 min. In OTA-positive samples, OTA competes with OTA–BSA conjugates embedded in the test (T) line for the finite amount of anti-OTA mAb. When a sufficient amount of OTA is present, free OTA binds to gold-labelled mAb, preventing mAb from binding to OTA–BSA in the T line. Therefore, the higher the OTA content in the sample, the weaker the colour of the T line. In OTA-negative samples, the limited amount of colloidal gold-labelled mAb is trapped by the immobilized OTA–BSA conjugate, and a clearly visible red T line appears.
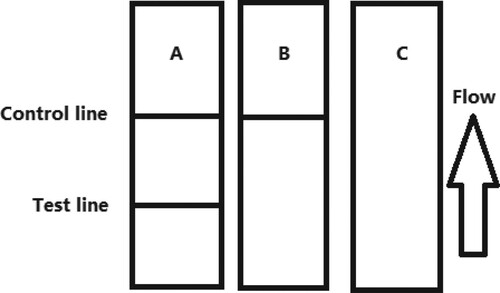
The sample must reach the control (C) line, which contains goat anti-mouse IgG antibody. Therefore, the C line must always appear in a successful test, whereas the T line will only appear when the sample is negative ((A)). The appearance of the C line alone is indicative that OTA is present ((B)), whereas if neither the C line nor the T line appears ((C)), the test procedure is incorrect or the strip is invalid, indicating that the test should be repeated with a new strip.
Figure 4. Illustration of typical strip test results. If the sample is negative (A), a positive result could be indicated only if the control line appears (B), and if the control and test line does not appears (invalid) (C).
Determination of performance
Sensitivity of the test strip
The sensitivity of the test strip was determined by testing OTA-containing samples. The OTA standard was diluted to 0, 0.5, 1, 2.5, 5, and 10 ng/mL in 0.01 M PBS (pH 7.4), and the detection limit was determined. The sample solution (100 µL) was mixed with 50 µL gold-labelled mAb, allowed to react for 5 min, and added onto the sample pad. After 5 min, the test strip reader was used to measure the colour intensities. The lowest detection limit (LDL) that could be detected by the naked eye was defined as the amount of OTA that produced a colour reaction on the strip that was visibly different in intensity from that obtained from 0 ng/mL OTA. Six replicates for each concentration were analysed on the same day.
Detection of OTA in red wine
We obtained red wine from a local market. Red wine (10 mL) was mixed with 0.2% PVP, Vortexed for 3 min, and centrifuge at 4000 rpm for 6 min. Two layers were formed; the pH of the resulting supernatant was adjusted to 7, and the samples were spiked with OTA solution (10 µg/mL, prepared with 0.01 M PBS, pH 7.4). The OTA concentrations in red wine were 0 (control), 0.5, 1, 2.5, 5, and 10 ng/mL. Six replicates for each concentration were analysed using the test strips.
Results and discussion
Optimization of the strip test
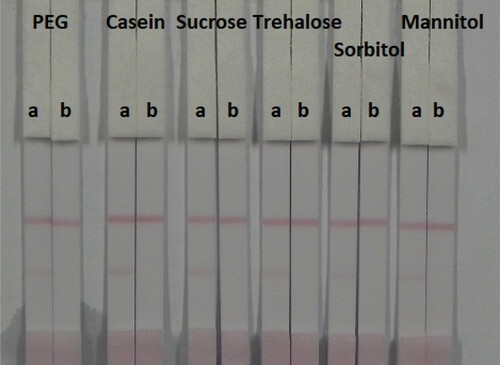
The strip materials must be hydrophilic and have consistent flow characteristics in the immunochromatographic assay. NC must be hydrophobic; however, it can be rendered hydrophilic with the addition of surfactants. It is important to choose the appropriate surfactant when developing these assays because not every protein is compatible with every surfactant. In this study, suspension buffer (0.02 M PBS, 5% sucrose, 2% sorbitol, 1% mannitol, 0.1% PEG, 0.1% tween, and 0.04% NaN3) was mixed with 13 reagents including PVP, PEG, polyvinyl alcohol (PVA), BSA, casein, sucrose, trehalose, sorbitol, mannitol, tween-20, brij-35, triton X-100, and Rhodasurf® On-870 (an ethoxylated oleyl alcohol). shows that the surfactants containing PEG, casein, sucrose, trehalose, sorbitol, and mannitol resulted in adequate and stable colour reactions. shows that casein resulted in the best signal colour on the T line.
Figure 5. Result of using 14 kinds of surfactants. 1 = suspension buffer, 2 = PVP, 3 = PEF, 4 = PVA, 5 = BSA, 6 = Casein, 7 = Sucrose, 8 = Trehalose, 9 = Sorbitol, 10 = Mannitol, 11 = tween-20, 12 = Brij-35, 13 = Triton X-100, and 14 = On-870. a = negative (0 ng/mL). b = positive (50 ng/mL).
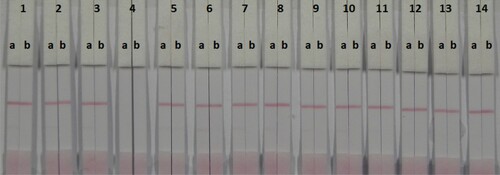
Figure 6. Colloidal gold immunochromatographic for OTA by using six kinds of surfactant. a = negative (0 ng/mL). b = positive (50 ng/mL).
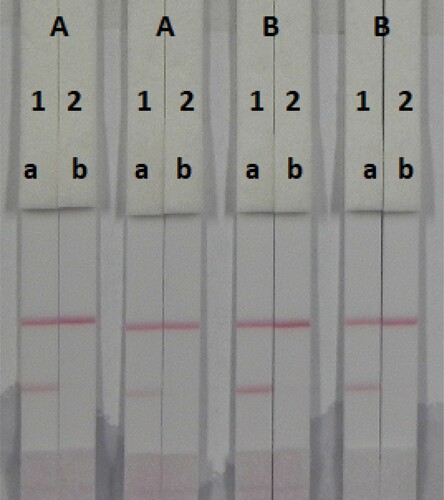
The concentration of mAbs in GNPs and of the coating antigen affects the sensitivity of the assay. Two different concentrations of mAbs (4 or 8 µg/L) were allowed to react with OTA-negative samples (0 ng/mL) and OTA-positive samples (25 ng/mL). shows that there were significant differences in colour intensity between 4 and 8 µg/L. We observed that the optimum concentration of mAb in GNP was 8 µg/L based on the colour intensities on both lines (OTA-positive and OTA-negative samples). Additionally, there were significant differences in colour intensity at 1 and 2 mg/mL coating antigen. At 1 mg/mL coating antigen, the colour intensity of the T line was weaker than at 2 mg/mL, suggesting that more sensitive detection could be achieved at 2 mg/mL coating antigen. Therefore, the optimum conditions of our developed assay consisted of 2 mg/mL coating antigen and 8 µg/L mAb in GNP.
Figure 7. Optimization of the immunochromatographic strip. Concentration of coating antigen (A) 1 mg/mL; (B) 2 mg/mL. The dosage of the mAb that add in GNP: (1) 8 µg/L; (2) 4 µg/L. The standard concentration: (a) 0 ng/mL and (b) 25 ng/mL.
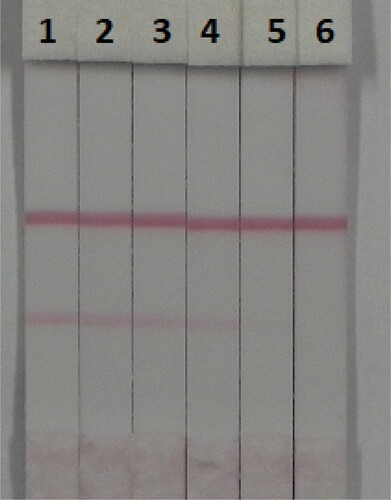
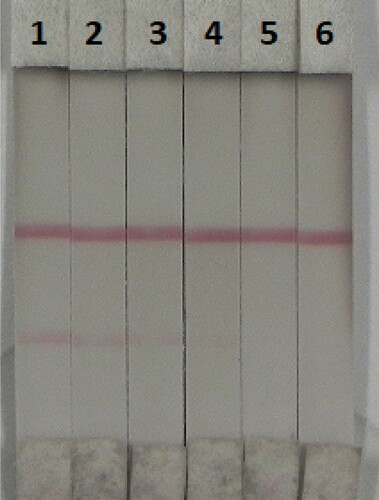
We investigated the sensitivity of the assay using a series of OTA standards diluted in 0.01 M PBS (pH 7.4). The LDL was defined as the amount of OTA that produced a colour reaction on the strip that was visibly different in intensity from the obtained from OTA-negative samples. shows that the signal colour on the T lines changed from strong (0 ng/mL) to weak and completely disappeared at 10 ng/mL OTA.
Figure 8. Colloidal gold immunochromatography assay for OTA in 0.01 M PBS (pH 7.4). OTA concentration: 1 = 0 ng/mL; 2 = 0.5 ng/mL; 3 = 1 ng/mL; 4 = 2.5 ng/mL; 5 = 5 ng/mL; and 6 = 10 ng/mL.
Detection of OTA in red wine
We removed polyphenols from red wine using PVP and adjusted its pH to 7.0 (Gurban, Prieto-Simon, Marty, & Noguer, Citation2006). Polyphenols must be minimized, because these compounds may inactivate the antibody and interfere with the measurement. To ensure the stabilization of wine samples and adequate antigen–antibody binding, the pH value must be adjusted to 7.0 (Ngundi et al., Citation2005; Prieto-Simon, Campas, Marty, & Noguer, Citation2008).
In this study, we determined matrix effects using red wine. One of the major advantages of the immunochromatographic strip assay is its rapidity and ease of use. The samples was spiked with OTA standard solution (10 µg/mL, prepared with 0.01 M PBS pH 7.4) at final OTA concentrations of 0.5, 1, 2.5, 5, and 10 ng/mL. Six replicates were determined at each concentration. The spiked samples were analysed using our developed method. shows that colour intensity decreased with increasing OTA concentrations. The signal colour on the T line changed from strong to weak with increasing OTA concentrations and completely disappeared at 10 ng/mL.
Figure 9. Result of OTA detection with colloidal gold immunochromatographic strip assay spiked in red wine (n = 6). 1 = 0 ppb, 2 = 0.5 ppb, 3 = 1 ppb, 4 = 2.5 ppb, 5 = 5 ppb, and 6 = 10 ppb.
Conclusions
A sensitive colloidal lateral-flow immunochromatographic assay was developed for the rapid detection of OTA in red wine samples. Under optimized conditions, the assay had a cut-off value of 10 ng/mL OTA in 0.01 M PBS (pH 7.4) and red wine. The results were obtained in 10 min. The lateral-flow immunochromatographic assay represents a sensitive and rapid detection method of OTA in red wine.
Disclosure statement
No potential conflict of interest was reported by the authors.
Additional information
Funding
Related Research Data
References
- Andrade, M. A., & Lancas, F. M. (2017). Determination of ochratoxin A in wine by packed in-tube solid phase microextraction followed by high performance liquid chromatography coupled to tandem mass spectrometry. Journal of Chromatography A, 1493, 41–48. doi: https://doi.org/10.1016/j.chroma.2017.02.053
- Cao, S., Song, S., Liu, L., Kong, N., Kuang, H., & Xu, C. (2015). Comparison of an enzyme-linked immunosorbent assay with an immunochromatographic assay for detection of lincomycin in milk and honey. Immunological Investigations, 44(5), 438–450. doi: https://doi.org/10.3109/08820139.2015.1021354
- Chen, X., Xu, L., Ma, W., Liu, L., Kuang, H., Wang, L., & Xu, C. (2014). General immunoassay for pyrethroids based on a monoclonal antibody. Food and Agricultural Immunology, 25(3), 341–349. doi: https://doi.org/10.1080/09540105.2013.794328
- Dohnal, V., Dvorak, V., Malir, F., Ostry, V., & Roubal, T. (2013). A comparison of ELISA and HPLC methods for determination of ochratoxin A in human blood serum in the Czech Republic. Food and Chemical Toxicology, 62, 427–431. doi: https://doi.org/10.1016/j.fct.2013.09.010
- Garcia-Fonseca, S., Ballesteros-Gomez, A., & Rubio, S. (2016). Restricted access supramolecular solvents for sample treatment in enzyme-linked immuno-sorbent assay of mycotoxins in food. Analytica Chimica Acta, 935, 129–135. doi: https://doi.org/10.1016/j.aca.2016.06.042
- Gu, H., Liu, L., Song, S., Kuang, H., & Xu, C. (2016). Development of an immunochromatographic strip assay for ractopamine detection using an ultrasensitive monoclonal antibody. Food and Agricultural Immunology, 27(4), 471–483. doi: https://doi.org/10.1080/09540105.2015.1126808
- Gurban, A. M., Prieto-Simon, B., Marty, J. L., & Noguer, T. (2006). Malate biosensors for the monitoring of malolactic fermentation: Different approaches. Analytical Letters, 39(8), 1543–1558. doi: https://doi.org/10.1080/00032710600713214
- Isanga, J., Mukunzi, D., Chen, Y., Suryoprabowo, S., Liu, L., Kuang, H., & Xu, C. (2017). Development of a monoclonal antibody assay and a lateral flow strip test for the detection of paromomycin residues in food matrices. Food and Agricultural Immunology, 28(3), 355–373. doi: https://doi.org/10.1080/09540105.2016.1272551
- Karczmarczyk, A., Haupt, K., & Feller, K. H. (2017). Development of a QCM-D biosensor for ochratoxin A detection in red wine. Talanta, 166, 193–197. doi: https://doi.org/10.1016/j.talanta.2017.01.054
- Karczmarczyk, A., Reiner-Rozman, C., Hageneder, S., Dubiak-Szepietowska, M., Dostalek, J., & Feller, K. H. (2016). Fast and sensitive detection of ochratoxin A in red wine by nanoparticle-enhanced SPR. Analytica Chimica Acta, 937, 143–150. doi: https://doi.org/10.1016/j.aca.2016.07.034
- Khaemba, G. W., Tochi, B. N., Mukunzi, D., Joel, I., Guo, L., Suryobrobowo, S., … Xu, C. (2016). Development of monoclonal antibody and lateral test strip for sensitive detection of clenbuterol and related beta(2)-agonists in urine samples. Food and Agricultural Immunology, 27(1), 111–127. doi: https://doi.org/10.1080/09540105.2015.1079598
- Kim, D.-H., Hong, S.-Y., Kang, J. W., Cho, S. M., Lee, K. R., An, T. K., & Lee, C. (2017). Simultaneous determination of multi-mycotoxins in cereal grains collected from South Korea by LC/MS/MS. Toxins, 9, 106. doi: https://doi.org/10.3390/toxins9030106
- Kim, S., Lee, S., Nam, T.-G., Seo, D., & Yoo, M. (2017). Comparison of a newly developed liquid chromatography with tandem mass spectrometry method and enzyme-linked immunosorbent assay for detection of multiple mycotoxins in Red pepper powder. Journal of Food Protection, 80(8), 1347–1354. doi: https://doi.org/10.4315/0362-028X.JFP-17-006
- Kokkonen, M., Jestoi, M., & Rizzo, A. (2005). The effect of substrate on mycotoxin production of selected Penicillium strains. International Journal of Food Microbiology, 99(2), 207–214. doi: https://doi.org/10.1016/j.ijfoodmicro.2004.08.014
- Kong, D., Xie, Z., Liu, L., Song, S., Kuang, H., Cui, G., & Xu, C. (2017). Development of indirect competitive ELISA and lateral-flow immunochromatographic assay strip for the detection of sterigmatocystin in cereal products. Food and Agricultural Immunology, 28(2), 260–273. doi: https://doi.org/10.1080/09540105.2016.1263985
- Li, X., Li, P., Zhang, Q., Li, R., Zhang, W., Zhang, Z., … Tang, X. (2013). Multi-component immunochromatographic assay for simultaneous detection of aflatoxin B-1, ochratoxin A and zearalenone in agro-food. Biosensors & Bioelectronics, 49, 426–432. doi: https://doi.org/10.1016/j.bios.2013.05.039
- Liu, L., Suryoprabowo, S., Zheng, Q., Song, S., & Kuang, H. (2017). Rapid detection of aldicarb in cucumber with an immunochromatographic test strip. Food and Agricultural Immunology, 28(3), 427–438. doi: https://doi.org/10.1080/09540105.2017.1293015
- Majdinasab, M., Sheikh-Zeinoddin, M., Soleimanian-Zad, S., Li, P., Zhang, Q., Li, X., & Tang, X. (2015). Ultrasensitive and quantitative gold nanoparticle-based immunochromatographic assay for detection of ochratoxin A in agro-products. Journal of Chromatography B-Analytical Technologies in the Biomedical and Life Sciences, 974, 147–154. doi: https://doi.org/10.1016/j.jchromb.2014.10.034
- Marino-Repizo, L., Gargantini, R., Manzano, H., Raba, J., & Cerutti, S. (2017). Assessment of ochratoxin A occurrence in Argentine red wines using a novel sensitive quechers-solid phase extraction approach prior to ultra high performance liquid chromatography-tandem mass spectrometry methodology. Journal of the Science of Food and Agriculture, 97(8), 2487–2497. doi: https://doi.org/10.1002/jsfa.8065
- Marino-Repizo, L., Kero, F., Vandell, V., Senior, A., Isabel Sanz-Ferramola, M., Cerutti, S., & Raba, J. (2015). A novel solid phase extraction - ultra high performance liquid chromatography-tandem mass spectrometry method for the quantification of ochratoxin A in red wines. Food Chemistry, 172, 663–668. doi: https://doi.org/10.1016/j.foodchem.2014.09.094
- Miro-Abella, E., Herrero, P., Canela, N., Arola, L., Borrull, F., Ras, R., & Fontanals, N. (2017). Determination of mycotoxins in plant-based beverages using QuEChERS and liquid chromatography-tandem mass spectrometry. Food Chemistry, 229, 366–372. doi: https://doi.org/10.1016/j.foodchem.2017.02.078
- Ngundi, M. M., Shriver-Lake, L. C., Moore, M. H., Lassman, M. E., Ligler, F. S., & Taitt, C. R. (2005). Array biosensor for detection of ochratoxin A in cereals and beverages. Analytical Chemistry, 77(1), 148–154. doi: https://doi.org/10.1021/ac048957y
- Peng, J., Liu, L., Kuang, H., Cui, G., & Xu, C. (2017). Development of an icELISA and immunochromatographic strip for detection of norfloxacin and its analogs in milk. Food and Agricultural Immunology, 28(2), 288–298. doi: https://doi.org/10.1080/09540105.2016.1263987
- Prieto-Simon, B., Campas, M., Marty, J.-L., & Noguer, T. (2008). Novel highly-performing immunosensor-based strategy for ochratoxin A detection in wine samples. Biosensors & Bioelectronics, 23(7), 995–1002. doi: https://doi.org/10.1016/j.bios.2007.10.002
- Reddy, K. R. N., Salleh, B., Saad, B., Abbas, H. K., Abel, C. A., & Shier, W. T. (2010). An overview of mycotoxin contamination in foods and its implications for human health. Toxin Reviews, 29(1), 3–26. doi: https://doi.org/10.3109/15569541003598553
- Sun, Y., Xing, G., Yang, J., Wang, F., Deng, R., Zhang, G., … Zhang, Y. (2016). Development of an immunochromatographic test strip for simultaneous qualitative and quantitative detection of ochratoxin A and zearalenone in cereal. Journal of the Science of Food and Agriculture, 96(11), 3673–3678. doi: https://doi.org/10.1002/jsfa.7550
- Suryoprabowo, S., Liu, L. Q., Peng, J., Kuang, H., & Xu, C. L. (2014). Development of a broad specific monoclonal antibody for fluoroquinolone analysis. Food Analytical Methods, 7(10), 2163–2168. doi: https://doi.org/10.1007/s12161-014-9863-1
- Suryoprabowo, S., Liu, L. Q., Peng, J., Kuang, H., & Xu, C. L. (2015). Antibody for the development of specific immunoassays to detect nadifloxacin in chicken muscles. Food and Agricultural Immunology, 26(3), 317–324. doi: https://doi.org/10.1080/09540105.2014.914469
- Teixeira, T. R., Hoeltz, M., Einloft, T. C., Dottori, H. A., Manfroi, V., & Noll, I. B. (2011). Determination of ochratoxin A in wine from the southern region of Brazil by thin layer chromatography with a charge-coupled detector. Food Additives & Contaminants Part B-Surveillance, 4(4), 289–293. doi: https://doi.org/10.1080/19393210.2011.638088
- Turner, N. W., Bramhmbhatt, H., Szabo-Vezse, M., Poma, A., Coker, R., & Piletsky, S. A. (2015). Analytical methods for determination of mycotoxins: An update (2009–2014). Analytica Chimica Acta, 901, 12–33. doi: https://doi.org/10.1016/j.aca.2015.10.013
- Zhang, K., Schaab, M. R., Southwood, G., Tor, E. R., Aston, L. S., Song, W. … Begley, T. H. (2017). A collaborative study: Determination of mycotoxins in corn, peanut butter, and wheat flour using stable isotope dilution assay (SIDA) and liquid chromatography-tandem mass spectrometry (LC-MS/MS). Journal of Agricultural and Food Chemistry, 65(33), 7138–7152. doi: https://doi.org/10.1021/acs.jafc.6b04872
- Zheng, R., Xu, H., Wang, W., Zhan, R., & Chen, W. (2014). Simultaneous determination of aflatoxin B-1, B-2, G(1), G(2), ochratoxin A, and sterigmatocystin in traditional Chinese medicines by LC-MS-MS. Analytical and Bioanalytical Chemistry, 406(13), 3031–3039. doi: https://doi.org/10.1007/s00216-014-7750-7
- Zhou, W., Kong, W., Dou, X., Zhao, M., Ouyang, Z., & Yang, M. (2016). An aptamer based lateral flow strip for on-site rapid detection of ochratoxin A in Astragalus membranaceus. Journal of Chromatography B-Analytical Technologies in the Biomedical and Life Sciences, 1022, 102–108. doi: https://doi.org/10.1016/j.jchromb.2016.04.016
- Zhu, Z., Peng, M., Zuo, L., Zhu, Z., Wang, F., Chen, L., … Luo, S.-Z. (2015). An aptamer based surface plasmon resonance biosensor for the detection of ochratoxin A in wine and peanut oil. Biosensors & Bioelectronics, 65, 320–326. doi: https://doi.org/10.1016/j.bios.2014.10.059