
 ?Mathematical formulae have been encoded as MathML and are displayed in this HTML version using MathJax in order to improve their display. Uncheck the box to turn MathJax off. This feature requires Javascript. Click on a formula to zoom.
ABSTRACT
An anti-pefloxacin (PEF) monoclonal antibody (mAb), an indirect competitive enzyme-linked immunosorbent assay and lateral-flow test strip methods were developed to detect fluoroquinolone (FQ) residues in chicken muscle samples. Under optimised conditions, the anti-PEF mAb showed reasonable cross-reactivity with nine FQs with a limit of detection of 0.082 ng/mL assayed in 0.01 M phosphate buffered saline (PBS) solution. The intra- and inter-assay recoveries from spiked samples were within the range of 62.42–111.47% and 63.5–113.79%, respectively. The visual cut-off values of the lateral flow test strip in 0.01 M PBS and in food matrices were within the range of 2.5–50 ng/mL and 5–100 µg/kg, respectively. These results show that the anti-PEF mAb immunoassay and lateral flow test strip methods are suitable for simultaneous detection and routine monitoring of FQ residues in food.
Introduction
Antibiotics are subdivided into different groups based on their activity and structures. Among these groups, synthetic fluoroquinolones (FQs) are the most important class of antibiotics that are widely used to treat serious infectious diseases in clinical practice and in veterinary medicine (Chang, Wang, & Tsai, Citation2010). Pefloxacin, [1-ethyl-6-fluoro-7-(4-methyl-piperazin-1-yl)-4-oxo-quinoline-3-carboxylic acid], which contains a naphthyridine core, is a broad-spectrum FQ antibacterial agent. It shows excellent antibacterial activity against most gram-negative and gram-positive bacteria (Soayed, Refaat, & Noor El-Din, Citation2014). Clinically, it is widely used in the treatment of respiratory and urinary infections. In agriculture, pefloxacin, along with other antibiotics, is used to treat diseases and to stimulate growth in animal production industries (Gonzalez Ronquillo & Angeles Hernandez, Citation2017).
In the past few decades, several researchers have reported risks related to the use of antibiotics, for instance; the use of FQs has been linked to an increased risk of tendinitis and tendon rupture (Xu, Liu, Guo, & Cui, Citation2015). Additionally, increases in acquired resistance to frequently-used antibiotics has been detected since the introduction of these antibiotics in human and veterinary medicine (Nelson, Chiller, Powers, & Angulo, Citation2007). In addition antibiotic resistance can spread to humans through consumption of food animals containing antibiotic residues (Marshall & Levy, Citation2011; Peng, Liu, Kuang, Cui, & Xu, Citation2016). Therefore, in order to solve the problem of antibiotic resistance and to protect consumers, several countries and regulatory authorities worldwide have established maximum residue limits for some antibiotic drugs in animal-based food products (Cao, Lu, et al., Citation2011; Liu et al., Citation2014). The Ministry of Agriculture of the People’s Republic of China has already banned the use of pefloxacin in food animals, and its use in animal feeds as at December 31, 2015.
The misuse and inappropriate use of pefloxacin in animal-based food products have drawn considerable attention to public health safety. This has necessitated an urgent call to develop efficient methods to control the pefloxacin residues in foods. Generally, the most frequently-used methods for the determination of FQs are based on high performance liquid chromatography (HPLC), liquid chromatography-mass spectrometry (LC/MS), or liquid chromatography-tandem mass spectrometry (LC–MS/MS) (Hermo, Barrón, & Barbosa, Citation2006; Hermo, Nemutlu, Kır, Barrón, & Barbosa, Citation2008). These methods are sensitive; however, they require expensive instruments and highly-trained personnel to operate and to interpret complex chromatographic and spectral results. For that reason, alternative simple methods such as enzyme-linked immunosorbent assays (ELISA) are required to fulfil the need for on-site tests to monitor residues in foodstuffs (Tochi, Peng et al., Citation2016). Compared to immunoassays, ELISA and immunochromatographic assays have broad application; they are rapid, simple, effective and need less sample preparation. In addition, it is possible to test many samples at the same time, in contrast to instrumental methods. Many immunoassay methods have been developed for the detection of pefloxacin residues (Cao, Sui, Kong, Li, & Lin, Citation2011; Jinqing, Citation2014; Lu et al., Citation2006). However, studies on lateral-flow immunochromatographic assay methods for detection of pefloxacin residues are still limited. Therefore, the aim of this study was to produce a monoclonal antibody, and develop an indirect competitive enzyme-linked immunosorbent assay (ic-ELISA) and immunochromatographic assays for the determination of pefloxacin residues in chicken muscle.
Materials and methods
Reagents and apparatus
Pefloxacin and other FQ drugs were purchased from J&K Scientific Ltd., (Shanghai, China). Bovine serum albumin (BSA), ovalbumin (OVA), [2,2′-(Ethylenedioxy)bis(ethylamine)] (EDEA), 3,3′,5,5′-tetramethylbenzidine (TMB), Freund’s complete adjuvant (FCA), Freund’s incomplete adjuvant (FIA), N-hydroxysuccinimide (NHS), 1-Ethyl-3-(3-dimethylaminopropyl) carbodiimide (EDC), Tween-20 and gelatine were purchased from Sigma-Aldrich (St. Louis, MO, USA). Goat anti-mouse immunoglobulin (IgG) antibody was purchased from Jackson ImmunoResearch Laboratories (West Grove, PA, USA). Hypoxanthine–aminopterin–thymidine (HAT) and hypoxanthine–thymidine (HT) supplement and other cell culture reagents were purchased from Life Technologies Corporation (Shanghai, China). Other reagents and chemicals were acquired from the National Pharmaceutical Group Chemical Reagent Co., Ltd. (Shanghai, China).
A UV-Visible Spectrophotometer (BIOMATE 3S) was obtained from Thermo Fisher Scientific (Waltham, MA, USA). An Eon™ Microplate spectrophotometer was purchased from Biotech Instruments Inc., (Winooski, VT, USA). Dialysis tubing (MWCO: Nominal: 1400) and 96-well microtiter plates were supplied by Green Bird Biotechnology Development Co., Ltd. (Shanghai, China) and Wuxi Biotechnology Co., Ltd. (Wuxi, China), respectively; a high-speed refrigerated centrifuge (Neofuge 15R) was obtained from Shanghai Lishen Scientific Equipment Co., Ltd. (Shanghai, China). Nitrocellulose (NC) high-flow plus membranes (Pura-bind RP) were from Whatman-Xinhua Filter Paper Co., Ltd. (Hangzhou, China). The glass fibre membrane (CB-SB08) used for the sample pad, the polyvinylchloride (PVC) backing material and the absorbent pad (SX18) were supplied by Goldbio Tech Co., Ltd. (Shanghai, China). The biostrip dispenser and cutter were from Xinqidian Gene-Technology Co. Ltd. (Beijing, China).
Eight-week-old female BALB/c mice were obtained from Beijing Vital River Laboratory Animal Technology Co., Ltd., (Beijing, China).
Solutions and buffers
Solutions were made up as follows: (1) 0.01 M PBS was prepared by mixing 8.0 g of NaCl, 3.62 g of Na2HPO4·12 H2O, 0.2 g of KH2PO4 and 0.2 g of KCl dissolved in 1 L of distilled water and adjusted to pH 7.4; (2) 0.05 M carbonate buffer (CB, pH 9.6) without and with 0.2% (w/v, g/l) gelatine, for the coating and blocking solutions, respectively; (3) 0.01 M PBS containing 0.05% Tween-20 (v/v) (Phosphate Buffered Saline with Tween [PBST]) was used as washing buffer; (4) 0.01 M PBS containing 0.1% (w/v, g/L) gelatine and 0.05% (v/v) Tween 20 was used as the antibody dilution buffer; (5) substrate stock solution buffer comprised 100 mL of 0.1 M citrate-phosphate buffer (pH 5.0) containing 180 µL of 30% H2O2; (6) TMB solution (60 mg of TMB dissolved in 100 mL glycol); (7) TMB-substrate solution [5:1 (v/v) mixture of substrate buffer and TMB solution]; and (8) 2 M H2SO4 solution for stopping colour development.
Design and synthesis of antigens
The immunogen and coating antigens were prepared by the carbodiimide (EDC) coupling method reported in our previous study (Mukunzi, Isanga, Suryoprabowo, Liu, & Kuang, Citation2017). Initially, the carrier protein BSA was cationized with 2,2′-ethylenedioxy-bis-ethylamine (EDEA) to form EDEA-BSA. As illustrated in , PEF was covalently coupled to EDEA-BSA to form the immunogen PEF-EDEA-BSA. Briefly, PEF (15 mg), EDC (24 mg), and NHS (9.0 mg) were dissolved in 5 mL of 0.05 M MES, pH 4.7, then incubated for 6 h at room temperature under constant stirring. Next, this solution was slowly added to a solution of EDEA-BSA (0.35 μmol) in 10 mL of CB (0.05 M, pH 9.6). The mixture was stirred for 3 h, and uncoupled haptens were removed by dialysis at room temperature against frequent changes of PBS solution every five to six hours for three days. The coating antigen was prepared by the same method using EDEA-OVA as the carrier protein. UV absorbance was used to evaluate conjugation rate. Conjugates were stored at −20°C.
Immunisation of mice
Eight-week-old female BALB/c mice were acclimatised for one week before immunisation. An emulsion of immunogen PEF-EDEA-BSA was prepared by using 1 mL of FCA and 2 mg of PEF-EDEA-BSA dissolved in 1 mL of sterile 0.9% (w/v) sodium chloride (NaCl). The primary dose consisted of 100 µg and was subcutaneously injected at multiple sites on the back of mice. Three subsequent booster injections of 50 µg immunogen emulsified with FIA were administered at three-week intervals. Seven days following the third boost, blood was collected from the tail vein of the mice. The collected blood samples were tested for anti-PEF activity by indirect competitive ELISA. Lastly, the mouse with the highest anti-PEF activity was intraperitoneally injected with 30 µg of immunogen prepared in 0.2 mL saline and three days later; its spleen was removed and used for hybridoma production.
Cell fusion, screening and production of mAb
The mouse antiserum specific for the PEF molecule was selected for cell fusion. Mouse spleen lymphocytes were fused with myeloma cells using polyethylene glycol (PEG) to form hybrid cells (Isanga et al., Citation2016; Kong et al., Citation2015; Kuang et al., Citation2013). One week after cell fusion, the ic-ELISA method was used to screen for positive cells with high anti-PEF activity. The selected cell lines were subcloned and screened repeatedly five times at intervals of six to seven days. At the end of the cell fusion process, the hybrid cell line 2G3 was selected for bulk antibody production. The cells were intraperitoneally injected into mature female BALB/c mice primed with paraffin oil. Ascites fluid which contained the antibodies was harvested and purified by the caprylic acid-ammonium sulphate precipitation method (Kuang et al., Citation2013). Further purification was performed by dialysis against 0.01 M PBS in order to remove ammonium sulphate salts and other small impurities. The purified antibody was quantified and stored at −20°C.
ELISA procedure
The ic-ELISA was developed using the checker-board titration procedure to enhance the interaction between coating antigen PEF-EDEA-OVA (0.3, 0.1, 0.03 and 0.01 μg/mL) and anti-PEF mAb (1.0, 0.5, 0.25 and 0.125 μg/mL) concentrations. Microtiter plates were coated with 100 μL/well and incubated at 37°C for 2 h. The plates were washed three times with PBST (0.01 M PBS containing 0.05% Tween-20 v/v), and blocked with 200 μL/well of the blocking buffer. After incubation at 37°C for 2 h, the plates were washed twice with PBST and each well was loaded with 50 μL of PEF standard solution followed by the addition of 50 μL of anti-PEF-mAb. The plates were incubated for 30 min at 37°C. Afterwards, the plates were washed three times, and secondary antibody (HRP-labeled goat anti-mouse IgG) diluted 1:3,000 with antibody dilution buffer was added (100 μL/well). The microtiter plates were incubated for 30 min and washed four times. Immediately, freshly-prepared TMB substrate solution was added to the plates (100 μL/well) and allowed to react in the dark for 15 min at 37°C. The colour development was stopped by adding 50 µL/well of 2 M Sulphuric acid (H2SO4) and the absorbance values were determined at 450 nm by a microtiter plate reader.
Effects of physical–chemical parameters on ELISA performance
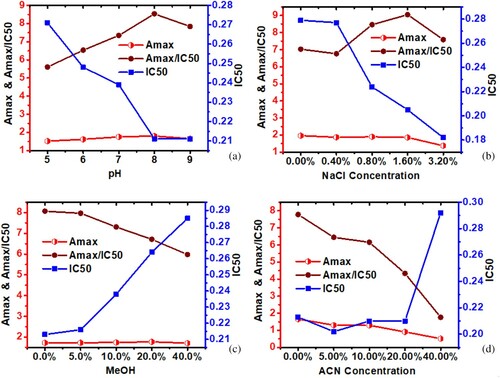
Immunoassay methods are generally improved by adjusting various parameters of the assay buffer. In this study, the effects of pH, salt concentration and organic solvent contents were investigated. A pH range of 6.0–9.0, sodium chloride in the range of 0–3.2% (w/v), and methanol and acetonitrile concentrations in the range of 0–40% (v/v) were tested. The maximum absorbance (Amax), half-inhibition concentration (IC50), and maximal Amax/IC50 ratio were used as conclusive criteria. Then, based on the optimum conditions identified, a standard curve was established using the four-parameter sigmoidal logistic dose response generated by OriginPro 8.5 (OriginLab Corporation, Northampton, MA, USA).
Cross-reactivity determination
The sensitivity and specificity of the anti-PEF mAb were evaluated by studying cross-reactivity (CR) with related FQ analogues (). Standard concentrations were prepared under the optimum assay buffer conditions and each IC50 value was determined using the ic-ELISA procedure. The CR was calculated using the following equation.
Table 1. Cross-reactivity of PEF-mAb with different FQ compounds.
Preparation of the lateral-flow test strip
Preparation of colloidal gold particles
Colloidal gold nanoparticles (GNPs) were prepared using the trisodium citrate reduction method (Kong et al., Citation2015; Xu et al., Citation2016). All solvents were prepared with double-distilled water and then filtered through a 22 µm transfer membrane. With constant stirring, the chloroauric acid (25 mL of 0.1 g/L) solution was heated to boiling point, then 1% w/v sodium citrate tribasic dihydrate solution (1.0 mL) was added. The resulting mixture was kept stirring for 30 min until it developed a colour like red wine. The solution was then cooled to room temperature, and stored at 4°C. Transmission electron microscopy analysis showed that the GNP had a closely uniform particle size of 15 nm.
Preparation of colloidal gold-labeled mAb
The PEF colloidal gold-labeled mAb was prepared following the methods previously described (Mukunzi et al., Citation2016). The colloidal gold solution was neutralised to pH 7.0 with 0.1 M K2CO3. To this solution (10 mL), anti-PEF mAb (0.4 mL) was slowly added and after 35 min, 1 mL of 10% (w/v) BSA was added. The mixture was stirred for 2 h. The resulting product was centrifuged for 45 min at 8000×g to remove gold aggregates. After centrifugation, the bottom layer (red gold-labeled) was collected and washed with 0.02 M phosphate buffer containing 5% sucrose, 1% BSA, and 0.5% PEG 6000 (pH 7.4). The conjugates were reconstituted to 1 mL in gold-labeling resuspension buffer (0.02 M PBS, 5% sucrose, 2% sorbitol, 1% mannitol, 0.1% PEG, 0.1% tween, and 0.04% NaN3) and stored at 4°C.
Preparation of NC capture membranes
The coating antigen (PEF-EDEA-BSA) and goat anti-mouse IgG were used as the capture reagents in the control line on the test strip. The antigen and goat anti-mouse IgG coatings were sprayed onto the NC membrane at 1 µL/cm using a dispenser to form the test and control lines on the strip. The capture and control reagents were also sprayed onto the glass fibre membrane to prepare the conjugate pad, which was later dried at 37°C for 2 h. The NC membrane coated with capture reagents was then pasted onto the centre of the plastic backing plate PVC and the conjugate pad, sample pad, and absorbent pad were laminated and pasted onto the backing plate. Finally, the plate was cut into 2.8 mm-wide strips with a strip cutter.
Application of the lateral flow test strip in 0.01 M PBS and spiked chicken meat samples
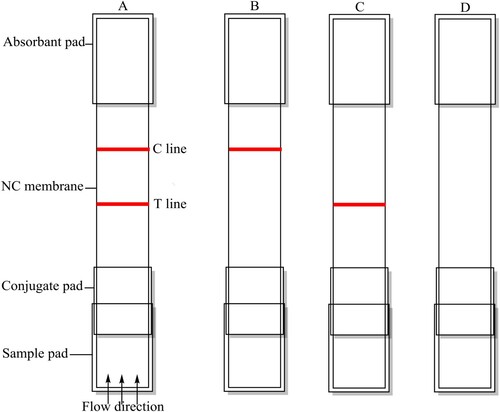
As illustrated in , the results of the test strips were evaluated as follows: a positive test was obtained when a sample with a strong target analyte was loaded onto the sample application pad and flowed through the strip to produce a coloured line in the control zone ((B)); a negative result occurred when a sample with a weak or without a target analyte was loaded onto the sample application pad and flowed through the strip to produce coloured lines in both control zone and test zone ((A)). When no line appeared either at the control line or the test line, the test was invalid (Liu et al., Citation2017; Mukunzi et al., Citation2016). In this work, 50 µL of PEF-gold-labeled mAb was mixed with 150 µL of sample solution (FQ analyte dissolved in PBS or spiked into chicken muscle samples) and allowed to react for about 5 min, then added to the sample pad. The solution was allowed to migrate to the absorbent pad, and the test results were obtained within 10 min.
Sample preparation and analysis
Chicken muscle samples were purchased from a local supermarket and authenticated to be free from FQ residues by HPLC–MS/MS. The samples were homogenised, and aliquots of 2 g were placed into 15 mL test tubes containing 2 mL of 80% methanol solution and spiked with different concentrations of each FQ drug (PEF, NOR, CIPRO, ENO, FLE, PF, OFL, SARA, and LOM; ). The spiked samples were thoroughly vortexed, mixed on a shaker for 15 min, and then centrifuged at 8445×g. The supernatants were collected and dried in a vacuum drier at 45°C; the resulting dried matter was reconstituted with 2 mL of 0.01 M PBS and aliquots were analysed by either ic-ELISA or the lateral flow strip test method.
Table 2. Recovery results of nine FQ compounds from fortified chicken muscle.
Results and discussion
Design and synthesis of the coating antigen
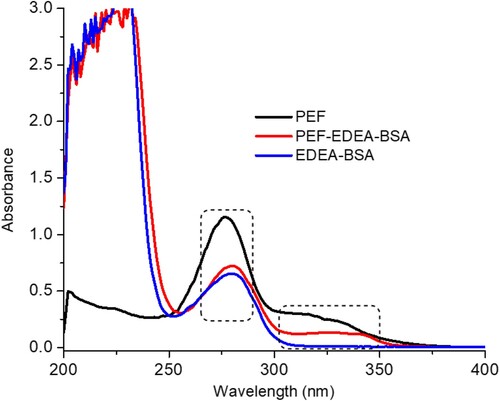
Pefloxacin, like other small molecules, is not able to stimulate an immune response except when it is attached to a large protein carrier such as BSA, keyhole limpet hemocynin (KLH) , or OVA. Therefore, it is fundamentally necessary to modify its structure in such a way that it will produce a desirable immune response. Based on the molecular structure of PEF, its carboxyl group (−COOH) was covalently linked to the N-terminal of cationized BSA (EDEA-BSA) with the help of the carbodiimide (EDC) coupling method () to produce the (PEF-EDEA-BSA) antigen. This new antigen (PEF-EDEA-BSA) was spectrophotometrically analysed and displayed the spectrum range from 300 to 350 nm highlighting the presence of PEF and it also showed a large peak at 280 nm emphasising the combined spectrum of PEF and EDEA-BSA molecules (). This indicated that the conjugation was successful. The coating antigen PEF-EDEA-OVA was analysed using the same approach, which revealed a characteristic UV pattern similar to the PEF-EDEA-BSA antigen.
Figure 1. The schematic diagram of PEF- immunogen synthesis.
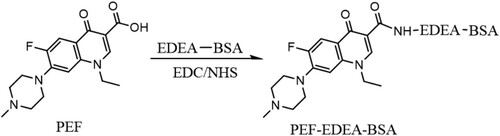
Figure 2. Illustration of typical strip test results. (A) negative test, (B) positive test and (C and D) invalid tests.
Optimisation of ic-ELISA
The optimum conditions for an ic-ELISA are usually established by evaluating different parameters in order to enhance the sensitivity of the antibody. Using the checkerboard titration method, it was determined that the optimal concentrations of coating antigen (PEF-EDEA-OVA) and anti-PEF mAb were 0.03 and 0.125 μg/mL, respectively. Other parameters of pH, NaCl and organic solvent contents were assessed in order to simulate the characteristic behaviour of food matrices. The evaluation of pH effects showed that from pH 5.0 to 8.0 there was a progressive increase in Amax value (1.519–1.802) and a slight decrease at pH 9.0 (Amax value 1.653). On the other hand, the IC50 value was decreased as the Amax/IC50 ratio increased ((a)). Ultimately, pH 8.0 was selected for subsequent experiments. Increasing salt concentration (0–0.1.6%) showed no significant change in Amax value until the salt concentration reached 3.2% when the Amax value dropped sharply down from 1.858 to 1.378. A salt concentration of 1.6% was selected because it exhibited a desirable IC50 value ((b)).
Figure 3. Characterization of PEF-EDEA-BSA conjugate by UV spectrophotometric.
Organic solvent tolerance was optimised also to assess the effects of methanol and acetonitrile, since they are often used in the extraction of FQ residues from food samples (Chen & Jiang, Citation2013). It was observed that increasing the methanol concentration from 0% to 5% had no significant effects on Amax, while the IC50 value changed slightly from 0.213 to 0.216 ng/mL. Concentrations of methanol of 10% and above significantly increased the IC50 value. The Amax was negatively affected by the increase in acetonitrile concentration, but the IC50 was not greatly affected until the concentration of acetonitrile reached 40% ((d)).
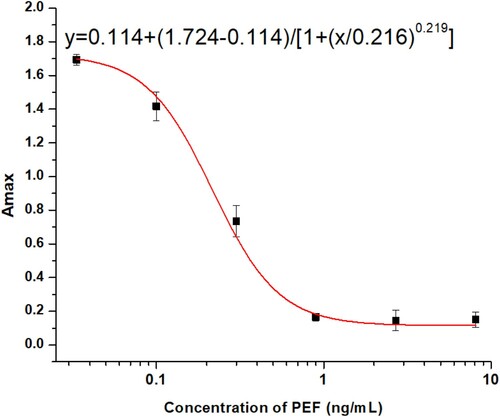
Based on the optimum conditions (pH 8.0, 1.6% NaCl, 5% methanol and 0% acetonitrile) we established the standard curve for the ic-ELISA (). The standard curve generated the equation , with a linear regression correlation coefficient R2 = 0.997. The IC50 value was 0.205 ng/mL and the limit of detection (IC10) was 0.067 ng/mL.
Figure 4. Effects of (a) pH variation, (b) salt concentration, (c) methanol concentration and (d) acetonitrile (ACN) concentration on ic-ELISA performance.
Determination of cross-reactivity
The capability of the anti-PEF mAb to recognise other FQs was determined by ic-ELISA and the results are shown in . In comparison with earlier immunoassays developed against FQs (Cao, Lu, et al., Citation2011; Cao, Sui, et al., Citation2011; Jinqing, Haitang, & Ziliang, Citation2011; Suryoprabowo, Liu, Peng, Kuang, & Xu, Citation2014; Tochi et al., Citation2016; Wang, Zhang, Ni, Zhang, & Shen, Citation2014), the anti-PEF mAb and ic-ELISA developed in this study showed a great improvement in terms of IC50 (0.218 ng/mL) and could effectively bind 9 out of 22 FQs investigated with an IC50 below 2 ng/mL. This broad selectivity was only observed for PEF, NOR, CIPRO, ENO, FLE, PF, OFL, SARA, and LOM; the majority of drugs which are classified into the second generation of FQs (King, Malone, & Lilley, Citation2000).
Immunoassay analysis of spiked chicken muscle samples
Based on the CR and IC50, the compounds PEF, NOR, CIPRO, ENO, FLE, PF, OFL, SARA and LOM were spiked into and recovered from spiked chicken muscle samples and analysed by ic-ELISA. To evaluate whether the matrix was affecting the ic-ELISA, standard curves were generated in PBS and compared with standard curves generated using the control matrices from chicken muscle sample extracts. Comparison of their IC50 and Amax showed no significant difference. shows the spiked levels and recovery data for each drug. The mean recoveries for the nine selected FQs ranged from 62.42% to 111.47% and 63.5% to 113.79% with %CV less than 13.59% and 12.2%, respectively for intra and inter-assays. In summary, the spiked samples showed good agreement between the spiking level and the concentration detected. Therefore, the developed ic-ELISA method is appropriate for simultaneous detection of FQs in chicken muscle samples.
Figure 5. The PEF Inhibition standard curve under optimised conditions (pH 8.0, 1.6%NaCl, 5% MeOH and, 0.0% ACN in PBS assay).
Lateral-flow strip detection of FQs in 0.1 M PBS and spiked samples
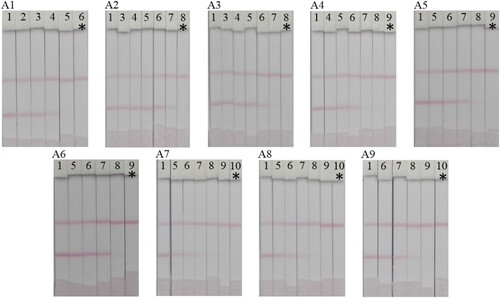
Validation of the PEF lateral-flow test strip in PBS was performed by detecting different concentrations of the nine FQs prepared in 0.01 M PBS (1 = 0, 2 = 0.1, 3 = 0.25, 4 = 0.5, 5 = 1.0, 6 = 2.5, 7 = 5, 8 = 10, 9 = 25, and 10 = 50 ng/mL). The visual cut-off value for each FQ is presented in . The best-detected FQ was PEF with a visual cut-off value of 2.5 ng/mL ((A1)).
Figure 6. Lateral flow test strips of nine FQ compounds in 0.01 M PBS assay (A1) PEF, (A2) NOR, (A3) CIPRO, (A4) ENO, (A5) FLE, (A6) PF, (A7) OFL, (A8) SARA and (A9) LOM. Various analyte concentrations; (1 = 0, 2 = 0.1, 3 = 0.25, 4 = 0.5, 5 = 1.0, 6 = 2.5, 7 = 5, 8 = 10, 9 = 25, and 10 = 50 ng/mL). *The visual cut off value.
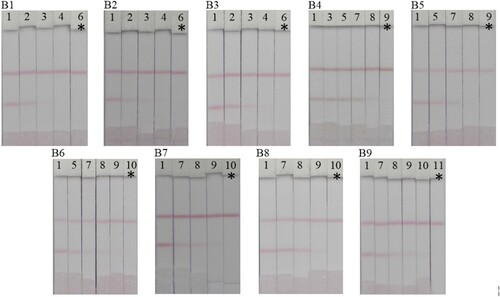
For real samples, homogenised chicken muscle samples were spiked with different standards of the nine FQs (1 = 0, 2 = 0.625, 3 = 1.25, 4 = 2.5, 5 = 3.125, 6 = 5, 7 = 6.25, 8 = 12.5, 9 = 25, 10 = 50 and 11 = 100 µg/kg). The samples were extracted with 80% methanol and the crude extracts were dried under vacuum. The recovered FQ substances were dissolved in 0.01 M PBS and evaluated using the PEF lateral-flow test strip. The results were analysed with the naked eye and the visual cut-off value ranged from 5 to 100 µg/kg (). Since 2005, the US Food and Drug Administration has outlawed the use of FQs in chicken farming. In addition, the Chinese Ministry of Agriculture has banned the use of PEF, OFL, NOR and LOM in food-producing animals (China Ministry of Agriculture, Citation2015). Therefore, the lateral-flow test strip we developed satisfies the requirement for screening out all the second-generation FQs in food products.
Figure 7. Detection of nine FQ compounds in chicken muscle using Lateral flow test strips. (B1) PEF, (B2) NOR, (B3) CIPRO, (B4) ENO, (B5) FLE, (B6) PF, (B7) OFL, (B8) SARA and (B9) LOM. Spiked amounts; (1 = 0, 2 = 0.625, 3 = 1.25, 4 = 2.5, 5 = 3.125, 6 = 5, 7 = 6.25, 8 = 12.5, 9 = 25, 10 = 50 and 11 = 100 µg/kg). *The visual cut off value.
Conclusion
In this study, we developed a PEF-monoclonal antibody, ic-ELISA and lateral flow test strip for the detection of FQ residues in chicken muscle samples. Under optimised conditions, the mAb showed an IC50 value of 0.2 ng/mL, with an limit of detection value of 0.082 ng/mL. Based on the sensitivity of the anti-PEF antibody, ic-ELISA and lateral flow test strip methods were capable of detecting nine target FQ substances in chicken muscle samples. The results were within the range of 0.2–4 ng/mL and 5–100 µg/kg, respectively for ic-ELISA and lateral flow test strip methods. Therefore, these rapid and effective tools are suitable for sensitive and on-site mass sample screening and can play an important role in preliminary and semi-quantitative analytical methods.
Disclosure statement
No potential conflict of interest was reported by the authors.
Additional information
Funding
Related Research Data
References
- Cao, Z., Lu, S., Liu, J., Zhan, J., Meng, M., & Xi, R. (2011). Preparation of anti-lomefloxacin antibody and development of an indirect competitive enzyme-linked immunosorbent assay for detection of lomefloxacin residue in milk. Analytical Letters, 44(6), 1100–1113. doi: https://doi.org/10.1080/00032719.2010.511733
- Cao, L., Sui, J., Kong, D., Li, Z., & Lin, H. (2011). Generic immunoassay of quinolones: Production and characterization of anti-pefloxacin antibodies as broad selective receptors. Food Analytical Methods, 4(4), 517–524. doi: https://doi.org/10.1007/s12161-011-9196-2
- Chang, C.-S., Wang, W.-H., & Tsai, C.-E. (2010). Simultaneous determination of 18 quinolone residues in marine and livestock products by liquid chromatography/tandem mass spectrometry. Journal of Food and Drug Analysis, 18(2), 87–97.
- Chen, J.-J., & Jiang, J.-Q. (2013). Monoclonal antibody-based solvent tolerable indirect competitive ELISA for monitoring ciprofloxacin residue in poultry samples. Food and Agricultural Immunology, 24(3), 331–344. doi: https://doi.org/10.1080/09540105.2012.689817
- China Ministry of Agriculture. (2015). Gazette of the Ministry of Agriculture of the People’s Republic of China, no. 2292. Retrieved from http://www.moa.gov.cn
- Gonzalez Ronquillo, M., & Angeles Hernandez, J. C. (2017). Antibiotic and synthetic growth promoters in animal diets: Review of impact and analytical methods. Food Control, 72, 255–267. doi: https://doi.org/10.1016/j.foodcont.2016.03.001
- Hermo, M. P., Barrón, D., & Barbosa, J. (2006). Development of analytical methods for multiresidue determination of quinolones in pig muscle samples by liquid chromatography with ultraviolet detection, liquid chromatography–mass spectrometry and liquid chromagraphy–tandem mass spectrometry. Journal of Chromatography A, 1104(1–2), 132–139. doi: https://doi.org/10.1016/j.chroma.2005.11.080
- Hermo, M. P., Nemutlu, E., Kır, S., Barrón, D., & Barbosa, J. (2008). Improved determination of quinolones in milk at their MRL levels using LC–UV, LC–FD, LC–MS and LC–MS/MS and validation in line with regulation 2002/657/EC. Analytica Chimica Acta, 613(1), 98–107. doi: https://doi.org/10.1016/j.aca.2008.02.045
- Isanga, J., Tochi, B. N., Mukunzi, D., Chen, Y., Liu, L., Kuang, H., & Xu, C. (2016). Development of a specific monoclonal antibody assay and a rapid testing strip for the detection of apramycin residues in food samples. Food and Agricultural Immunology, 28(1), 49–66. doi:10.1080/09540105.2016.1202211
- Jinqing, J. (2014). Development of a monoclonal antibody-based broad-specificity ELISA for fluoroquinolone residues. Journal of Food, Agriculture & Environment, 12(2), 70–73.
- Jinqing, J., Haitang, Z., & Ziliang, W. (2011). Multiresidue determination of sarafloxacin, difloxacin, norfloxacin, and pefloxacin in fish using an enzyme-linked immunosorbent assay. Procedia Environmental Sciences, 8, 301–306. doi: https://doi.org/10.1016/j.proenv.2011.10.048
- King, D. E., Malone, R., & Lilley, S. H. (2000). New classification and update on the quinolone antibiotics. American Family Physician, 61(9), 2741–2748.
- Kong, N., Song, S., Peng, J., Liu, L., Kuang, H., & Xu, C. (2015). Sensitive, fast, and specific immunoassays for methyltestosterone detection. Sensors (Basel), 15(5), 10059–10073. doi: https://doi.org/10.3390/s150510059
- Kuang, H., Xing, C., Hao, C., Liu, L., Wang, L., & Xu, C. (2013). Rapid and highly sensitive detection of lead ions in drinking water based on a strip immunosensor. Sensors (Basel), 13(4), 4214–4224. doi: https://doi.org/10.3390/s130404214
- Liu, L., Chen, Y., Song, S., Zheng, Q., Wu, X., & Kuang, H. (2017). Development of an antibody-based colloidal gold immunochromatographic lateral flow strip test for natamycin in milk and yoghurt samples. Food and Agricultural Immunology, 28(6), 1283–1292. doi:10.1080/09540105.2017.1337084
- Liu, L., Luo, L., Suryoprabowo, S., Peng, J., Kuang, H., & Xu, C. (2014). Development of an immunochromatographic strip test for rapid detection of ciprofloxacin in milk samples. Sensors (Basel), 14(9), 16785–16798. doi: https://doi.org/10.3390/s140916785
- Lu, S., Zhang, Y., Liu, J., Zhao, C., Liu, W., & Xi, R. (2006). Preparation of anti-pefloxacin antibody and development of an indirect competitive enzyme-linked immunosorbent assay for detection of pefloxacin residue in chicken liver. Agricultural and Food Chemistry, 54(19), 6995–7000. doi: https://doi.org/10.1021/jf061309q
- Marshall, B. M., & Levy, S. B. (2011). Food animals and antimicrobials: Impacts on human health. Clinical Microbiology Reviews, 24(4), 718–733. doi: https://doi.org/10.1128/CMR.00002-11
- Mukunzi, D., Isanga, J., Suryoprabowo, S., Liu, L., & Kuang, H. (2017). Rapid and sensitive immunoassays for the detection of lomefloxacin and related drug residues in bovine milk samples. Food and Agricultural Immunology, 28(4), 599–611. doi: https://doi.org/10.1080/09540105.2017.1306495
- Mukunzi, D., Tochi, B. N., Isanga, J., Liu, L., Kuang, H., & Xu, C. (2016). Development of an immunochromatographic assay for hexestrol and diethylstilbestrol residues in milk. Food and Agricultural Immunology, 27(6), 855–869. doi: https://doi.org/10.1080/09540105.2016.1183601
- Nelson, J. M., Chiller, T. M., Powers, J. H., & Angulo, F. J. (2007). Fluoroquinolone-resistant campylobacter species and the withdrawal of fluoroquinolones from use in poultry: A public health success story. Clinical Infectious Diseases, 44(7), 977–980. doi: https://doi.org/10.1086/512369
- Peng, J., Liu, L., Kuang, H., Cui, G., & Xu, C. (2016). Development of an icELISA and immunochromatographic strip for detection of norfloxacin and its analogs in milk. Food and Agricultural Immunology, 28(2), 288–298. doi: https://doi.org/10.1080/09540105.2016.1263987
- Soayed, A. A., Refaat, H. M., & Noor El-Din, D. A. (2014). Characterization and biological activity of pefloxacin–imidazole mixed ligands complexes. Inorganica Chimica Acta, 421, 59–66. doi: https://doi.org/10.1016/j.ica.2014.05.020
- Suryoprabowo, S., Liu, L., Peng, J., Kuang, H., & Xu, C. (2014). Development of a broad specific monoclonal antibody for fluoroquinolone analysis. Food Analytical Methods, 7(10), 2163–2168. doi: https://doi.org/10.1007/s12161-014-9863-1
- Tochi, B. N., Peng, J., Song, S., Liu, L., Kuang, H., & Xu, C. (2016). Determination of sarafloxacin and its analogues in milk using an enzyme-linked immunosorbent assay based on a monoclonal antibody. Analytical Methods, 8(7), 1626–1636. doi: https://doi.org/10.1039/C5AY02702K
- Wang, Z., Zhang, H., Ni, H., Zhang, S., & Shen, J. (2014). Development of a highly sensitive and specific immunoassay for enrofloxacin based on heterologous coating haptens. Analytica Chimica Acta, 820, 152–158. doi: https://doi.org/10.1016/j.aca.2014.02.043
- Xu, Y., Liu, S., Guo, F., & Cui, F. (2015). Oxidation of enrofloxacin with permanganate: Kinetics, multivariate effects, identification of oxidation products, and determination of residual antibacterial activity. Journal of Chemistry, 2015, 1–8.
- Xu, L., Peng, S., Liu, L., Song, S., Kuang, H., & Xu, C. (2016). Development of sensitive and fast immunoassays for amantadine detection. Food and Agricultural Immunology, 27(5), 678–688. doi: https://doi.org/10.1080/09540105.2016.1148667