
ABSTRACT
Immunochromatographic assay (ICA) is an efficient analytical technique and rapid, convenient, easy-to-use, low-cost, and on-site detection method that has been widely used to evaluate food safety. However, an important issue to be addressed for this method is its matrix effect. In this work, time-resolved fluorescent nanobead ICA (TRFN-ICA) and colloidal gold ICA (CG-ICA) were developed to detect clenbuterol in swine urine. Under optimized working conditions, the limits of detection of TRFN-ICA and CG-ICA were 16 and 68 pg/mL, respectively. The matrix effect on TRFN-ICA and CG-ICA was assessed in 20 swine urine samples. Results indicated that the sensitivity of TRFN-ICA was better than that of CG-ICA, and the detection time of the former was shorter than that of the latter. The matrix effect on TRFN-ICA was more serious than that on CG-ICA.
1. Introduction
Clenbuterol (CLB), which is a synthesized β-adrenergic agonist, promotes accretion of skeletal muscle mass by inhibiting fat synthesis and increasing protein synthesis as a “leanness enhancer” (Zhang et al., Citation2006; Zhang, Wang et al., Citation2009). However, CLB can accumulate in animal tissues after its long-term or high-dose use, remain in the body for a long time, and cause severe adverse effects, such as central nervous and vascular diseases (Deng et al., Citation2015). Hence, its use in livestock production has been prohibited in many countries, including China, the USA, and the European Union (Qu et al., Citation2016).
Current confirmed methods of CLB in different biological matrices include gas chromatography mass spectrometry (He, Su, Zeng, Liu, & Huang, Citation2007; Zhao, Zhao, Huangfu, & Wu, Citation2010) and liquid chromatography tandem mass spectrometry (LC-MS) (Li, Wu, Yang, Zhang, & Huang-Fu, Citation2010; Zhang, Chang et al., Citation2009). Although these methods are specific, sensitive, and accurate, they require complicated sample pretreatment, trained operators, and sophisticated instruments.
Immunochromatographic assay (ICA) has been widely used to detect targets related to food safety (Tang et al., Citation2017). ICA is a rapid, convenient, easy-to-use, low-cost, and on-site detection method (Guo et al., Citation2015; Liu et al., Citation2014; Peng, Liu, Kuang, Cui, & Xu, Citation2016). Colloidal gold ICA (CG-ICA) (Khaemba et al., Citation2016; Lai, Xu, Fung, & Xiong, Citation2007), quantum dot ICA (Luo et al., Citation2011), sulfonated polystyrene magnetic nanobead ICA (Wu et al., Citation2014), fluorescent microsphere ICA (Deng et al., Citation2014), and surface-enhanced Raman scattering ICA (Deng et al., Citation2015) have been successfully utilized to detect CLB. However, the matrix effect of a sample on ICA for CLB detection has yet to be reported.
In this study, time-resolved fluorescent nanobead ICA (TRFN-ICA) and CG-ICA were developed, and the matrix effect of different swine urines on TRFN-ICA and CG-ICA was firstly studied.
2. Materials and methods
2.1. Materials and equipment
The following materials were used in this study: time-resolved fluorescent nanobeads (TRFNs, 1.05%, solid content, w/v; carboxylate-modified Eu (III)-chelate-doped polystyrene nanobeads, excitation = 345 nm, emission = 614 nm; Nanjing Weice Biotech Co., Ltd., Nanjing, China); bovine serum albumin (BSA) and N-(3-dimethylaminopropyl)-N′-ethylcarbodiimide hydrochloride (EDC·HCl) (Sigma, St. Louis, MO, USA); CLB-BSA conjugate antigen (Wuxi Zodoboer Biotech., Co., Ltd., Wuxi, China); gold chloride trihydrate (HAuCl4·3H2O, 99.9%) and swine urine samples (Guohong Swine Breed Farm, Nanchang, China); CLB, ractopamine (RAC), penbutolol (PEN), salbutamol (SAL), mabuterol (MAB), terbutaline (TER), and clorprenaline (CLO) (Dr. Ehrenstorfer, GmbH, Augsburg, Germany); nitrocellulose (NC) membrane (Millipore, Bedford, MA, USA); polyvinylchloride backing pad, absorbent pad, sample pad, and conjugate pad (Shanghai Kinbio Tech., Co., Ltd., Shanghai, China); and goat anti-mouse IgG (Meridian Life Science, Inc., Memphis, TN, USA). CG was prepared in our laboratory (Li et al., Citation2013). All of the solvents and other chemicals were of analytical reagent grade.
The following instruments were utilized in this study: two portable strip readers for a TRFN-immunochromatographic test strip (ICTS, excitation wavelength = 365 nm, emission wavelength = 610 nm) and CG-ICTS (absorption wavelength = 525 nm) (Fenghang Scientific Instrument Co., Ltd., Zhejiang, China); XYZ-3050 platform (BioDot, Irvine, CA, USA); and automatic programmable cutter (Hangzhou Fenghang Technology Co., Ltd., Hangzhou, China). The LEDs in TRFN portable reader served as the excitation source at 365 ± 20 nm. The detection wavelength of TRFN portable reader was 615 ± 20 nm.
2.2. Preparation of TRFN-mAb complex and CG-ICA complex
2.2.1. Preparation of TRFN-mAb complex
The TRFN anti-CLB antibody complex was prepared in accordance with previously reported methods (Hu et al., Citation2017) with slight modifications. In brief, 5.0 μL of TRFN (10 mg/mL, w/v) was added to 500 μL of 0.05 M boric acid buffer and ultrasonicated (30 kHz frequency, 20% amplitude, 0.6 intermittent frequencies) at room temperature for 2 min. Subsequently, 5.0 μL of fresh EDC solution (0.5 mg/mL) was added to the mixture and stirred for 30 min. Afterward, 50 μL of anti-CLB mAb solution was added dropwise to the mixture, incubated at room temperature for 2 h, and blocked with 50 μL of fresh blocking buffer containing BSA (10%, w/v) and Tween-20 (1%, v/v) for 2 h. The mixture was centrifuged at 12,000 rpm at 4°C for 20 min. The pellet was suspended in 100 μL of boric acid buffer (0.05 M, pH 7.4) with 0.2% BSA and 0.5% Tween-20.
2.2.2. Preparation of CG-mAb complex
The CG anti-CLB antibody complex was prepared in accordance with previously described methods (Wang et al., Citation2015) with slight modifications. The pH of 1 mL of CG solution was adjusted to 6.0 with 0.2 M K2CO3, and 100 μL of anti-CLB mAb solution was added dropwise to the CG solution. The solution was stirred for 60 min at room temperature and then blocked with 100 μL of 1% (w/v) polyethylene glycol (PEG) 20,000 solution for 30 min and 100 μL of fresh BSA (10%, w/v) for 30 min. The solution was then centrifuged at 8,000 rpm and 4°C for 30 min. The pellet was dissolved in 100 μL of phosphate-buffered saline (PBS) containing 5% sucrose, 2% trehalose, 1% PEG 20,000, 1% BSA, and 0.25% Tween-20.
2.3. Optimization of TRFN-ICA and CG-ICA parameters
The pH, anti-CLB mAb concentration, and CLB-BSA were optimized. The optimal conditions were based on the signal intensity of the test (T) line of the negative sample and the competitive inhibition ratio of the positive sample. The competitive inhibition ratio was calculated by using the following equation: 1–B/B0, where B0 was the signal intensity ratio of the T line to that of the C line (T/C) with the negative sample, whereas B was the signal intensity of T/C with the positive sample (800 pg/mL).
Different pH levels of 0.05 M boric acid buffer solution (pH 4.0, 5.0, 6.0, 7.0, and 8.0) were selected to prepare a TRFN-mAb complex, whereas various pH levels of CG (pH 5.5, 6.0., 6.5, 7.0, and 7.5) were set to form a CG-mAb complex. The TRFN-mAb complex was prepared with the anti-CLB mAb solution at 1, 3, 5, 7, and 9 μg/mL. The CG-mAb complex was also prepared with the anti-CLB mAb solution at 10, 30, 50, 70, and 90 μg/mL. The CLB-BSA antigen at 0.2, 0.4, 0.6, and 0.8 mg/mL was sprayed on the T line of TRFN-ICTS and CG-ICTS.
2.4. Preparation of ICTS
The ICTS consisted of a sample pad, a conjugate pad, NC membrane, and an absorbent pad (Gu, Liu, Song, Kuang, & Xu, Citation2016). The sample pad was pre-treated with 50 mM borate buffer (pH 7.4) containing 1% BSA, 0.5% Tween-20, and 0.05% sodium azide and further dried at 60°C for 2 h. CLB-BSA (0.4 mg/mL) and goat anti-mouse antibody (0.4 mg/mL) were respectively sprayed onto the NC membrane as the T and C lines and dried at 37°C for 12 h. The sample pad, the conjugate pad, the NC membrane, and the absorbent pad were assembled as a strip.
2.5. Immunological kinetics analysis of TRFN-ICA and CG-ICA
The immunological kinetics of TRFN-ICA and CG-ICA were analyzed. The signal intensity of the T line was recorded every 30 s for 35 min. Kinetic curves were established by plotting the signal intensity of T line, C line, and ratio of T/C against time.
2.6. Establishment of standard calibration curve
The standard calibration curve was established between the T/C ratio and the logarithm of the CLB concentration. The following CLB concentrations were detected: 0, 20, 80, 100, 200, 800, 1000, 2000, 4000, and 8000 pg/mL by TRFN-ICTS and 0, 40, 100, 200, 400, 800, 1000, 2000, 4000, and 8000 pg/mL by CG-ICTS. Each concentration was then analyzed in three replicates. The limit of detection (LOD) is defined as the concentration of CLB in the PBS that causes a 10% decrease in the B/B0 ratio compared with that produced by the PBS (Song et al., Citation2013). Half-maximal inhibitory concentration (IC50) is defined as the concentration of CLB in the PBS that causes a 50% decrease in the B/B0 ratio compared with that produced by the PBS.
2.7. Specificity of TRFN-ICA and CG-ICA
The specificities of TRFN-ICA and CG-ICA were evaluated using six other β-adrenergic agonists (RAC, PEN, SAL, MAB, TER, and CLO) at 800 pg/mL in PBS. Each measurement was performed in three replicates.
2.8. Accuracy and precision of TRFN-ICA and CG-ICA
The accuracies of TRFN-ICA and CG-ICA were estimated by calculating their recovery ratio. The precisions of TRFN-ICA and CG-ICA was assessed by the coefficient of variation (CV). PBS was spiked with final CLB concentrations of 400, 800, and 1000 pg/mL. Each measurement was performed in three replicates (Bai et al., Citation2012).
2.9. Matrix effect of swine urine on TRFN-ICA and CG-ICA
The 20 negative samples of swine urine confirmed by LC-MS were spiked with CLB at a final concentration of 800 pg/mL. The 20 spiked samples were detected with TRFN-ICA and CG-ICA to examine the matrix effect. Each measurement was performed in three replicates.
3. Results and discussion
3.1. ICTS procedure
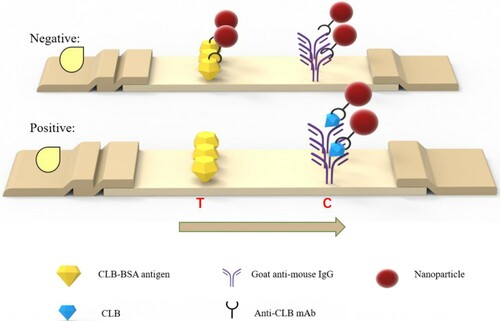
The procedure of ICTS was based on indirect competitive immunoassay to detect CLB. In our study, 1.5 μL of TRFN-mAb complex or 2.0 μL of CG-mAb complex was pipetted into enzyme-linked immunosorbent assay microplate wells. Then, 100 μL of the sample was added and mixed at room temperature for 5 min. The mixture was added to the sample pad of the ICTS. TRFN-ICTS was scanned with a TRFN-ICA reader after 10 min, while CG-ICTS was scanned with a CG-ICA reader after 15 min. When CLB was not present in significant amounts in the sample (negative), the label-mAb complex was captured by CLB-BSA coated on the T line. The signal intensity of the T line was recorded using a portable test strip reader. When the sample contained a large amount of CLB (positive), the specific antibody binding sites were occupied by CLB in the sample and left no or less binding sites for CLB-BSA on the T line. Therefore, no or less signal intensity was found on the T line (Scheme 1).
Scheme 1. Schematic of CLB detection using ICAs. The ICAs used in the study were based on indirect competitive immunoassay principle.
3.2. Characterization of two labels and label-mAb complex
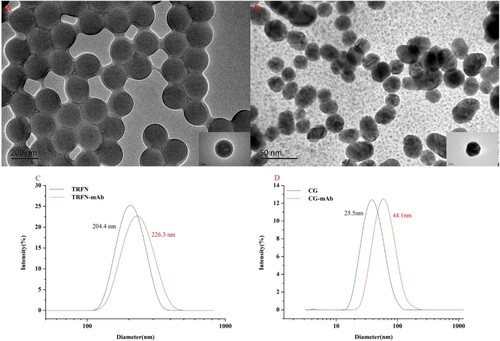
The morphological characteristics and sizes of TRFN and CG were analyzed with a transmission electron microscope (TEM, JEOLJOM 2100, Tokyo, Japan). The TEM images showed that TRFN and CG were relatively uniform in sizes and had average diameters of 158.0 and 24.5 nm, respectively. In (a–b). The dynamic light scattering (DLS) of TRFN, CG, TRFN-mAb complex, and CG-mAb complex was analyzed with a particle size analyzer (Nano-ZS, Malvern Instruments Ltd., Worcestershire, UK). DLS revealed that the hydrodynamic diameters of TRFN, CG, TRFN-mAb complex, and CG-mAb complex were 204 ± 1.80, 25.5 ± 1.78, 226.3 ± 0.85, and 44.1 ± 1.56 nm, respectively ((c–d)).
Figure 1. Characterization of two labels and two label-mAb complexes. (A) TEM image of TRFN; (B) TEM image of CG; (C) DLS of TRFN and TRFN-mAb complex; (D) DLS of CG and CG-mAb complex.
3.3. Optimization of TRFN-ICA and CG-ICA parameters
3.3.1. Optimization of pH
Labelling pH should be optimized because labelling pH affects antibody activity and coupling efficiency (Luo et al., Citation2017). Optimal pH was obtained on the basis of the largest competitive inhibition ratio with positive samples and larger signal intensity of T line with negative samples. The TRFN-mAb complex was prepared by covalently coupling the amino group of anti-CLB mAb with the carboxyl group of TRFN in the presence of EDC·HCl. The T line signal intensity and competitive inhibition ratio of TRFN-ICA increased significantly when pH varied from 4.0 to 5.0. T line signal intensity also slowly increased and reached the maximum at pH 8.0. However, the competitive inhibition ratio significantly decreased (Figure S1A). Therefore, labelling pH 5.0 was selected as the optimal pH for coupling with TRFN. The anti-CLB mAb was adsorbed onto CG through a combination of hydrophobic electrostatic and electrostatic interactions. The T line signal intensity and competitive inhibition ratio of CG-ICA slowly increased when pH ranged from 5.5 to 6.0 and significantly decreased at pH 6.5, 7.0, and 7.5. The maximum T line signal intensity and competition inhibition rate were determined when pH was 6.0 (Figure S1B). Therefore, 6.0 was the optimal pH for the CG-ICA.
3.3.2. Optimizing the concentration of anti-CLB mAb for label-mAb complex preparation
The concentration of anti-CLB mAb played a key role in the detection of CLB (Figure S2A). As the concentration of anti-CLB mAb increased, the T line signal intensity of TRFN-ICA gradually increased and reached the maximum when the concentration of anti-CLB mAb was 9 μg/mL. However, the maximum competitive inhibition ratio and high signal intensity of T line were obtained when the concentration of anti-CLB mAb was 7 μg/mL. Therefore, 7 μg/mL was selected as the optimal concentration of anti-CLB mAb for coupling with TRFN. Figure S2B shows that 50 μg/mL was the optimal concentration of anti-CLB mAb for CG-ICA.
3.3.3. Optimizing the concentration of CLB-BSA on T line
The T line signal intensity of TRFN-ICA gradually increased as the concentration of CLB-BSA on the T line increased (Figure S3A) and reached the strongest signal intensity when the concentration of CLB-BSA was 0.8 mg/mL. However, the maximum competitive inhibition ratio and large signal intensity of T line were obtained when the concentration of CLB-BSA was 0.4 mg/mL. Therefore, 0.4 mg/mL was selected as the optimal concentration of CLB-BSA on the T line. Figure S3B shows that the concentration of 0.4 mg/mL was also the optimal concentration of CLB-BSA for CG-ICA.
3.4. Immunological kinetics analysis of TRFN-ICA and CG-ICA
The immunological kinetics of TRFN-ICA and CG-ICA were analyzed. Figure S4A shows that the signal intensity on both lines (T and C) of TRFN-ICA increased gradually within 35 min of observation. However, the T/C value decreased gradually and achieved equilibrium in 10 min. These results indicated that the optimum immune reaction time for TRFN-ICA was 10 min if T/C was considered. Figure S4B shows that the optimum immune reaction time was 15 min for CG-ICA.
3.5. Establishment of standard calibration curve
The standard calibration curve was plotted by using the T/C ratio and the logarithm of various known CLB concentrations. (a) (TRFN-ICA) shows the reliable correlation coefficient (R2 = 0.9975) and the standard equation y = −0.354 ln (x) + 3.3478, where x is the concentration of CLB in pg/mL, and y is the T/C ratio. Error bars were based on triplicate measurements at different CLB concentrations. (b) (CG-ICA) shows a reliable correlation coefficient (R2 = 0.9886). The standard equation was y = −0.576 ln (x) + 4.6787. (c) and (d) shows the detection result of TRFN-ICTS and CG-ICTS at different concentration of CLB. The LOD, IC50, and dynamic range of TRFN-ICA and CG-ICA are shown in .
Figure 2. Standard calibration curve for CLB was obtained by plotting T/C against the logarithm of various CLB concentrations. (A) Standard calibration curve of TRFN-ICA. (B) Standard calibration curve of CG-ICA. (C) The detection result of TRFN-ICTS (the concentration of CLB were 100, 200, 800, 1000, and 2000 pg/mL). (D) The detection result of CG-ICTS (the concentration of CLB were 200, 400, 800, 1000, and 2000 pg/mL).
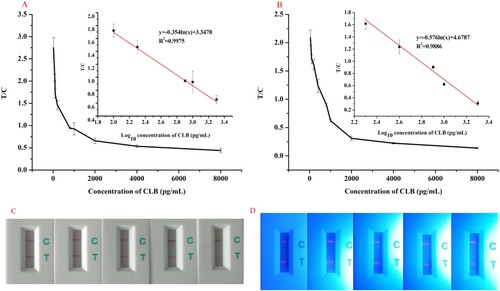
Table 1. Analytical characteristics for CLB detection with TRFN-ICA and CG-ICA in PBS.
3.6. Specificity of TRFN-ICA and CG-ICA
The specificities of TRFN-ICA and CG-ICA were evaluated by analyzing six other β-adrenergic agonists (RAC, PEN, SAL, MAB, TER, and CLO) at 800 pg/mL (Figure S5). The T/C ratios of TRFN-ICA and CG-ICA with six other β-adrenergic agonists were as high as that with CLB negative sample. This finding indicated that TRFN-ICA and CG-ICA yielded a high specificity for CLB detection.
3.7. Accuracy and precision of TRFN-ICA and CG-ICA
Recovery experiments were conducted to evaluate the accuracy of TRFN-ICA and CG-ICA by using CLB-spiked PBS. CV was conducted to evaluate the precision of the two ICAs (). The recovery rates of TRFN-ICA and CG-ICA ranged from 83.3% to 103.6% and from 97.3% to 106.2%, with a CV of 2.1% to10.6% and 3.3% to 6.7%, respectively.
Table 2. Accuracy and precision of two ICAs in CLB-spiked PBS.
3.8. Matrix effect of swine urine on TRFN-ICA and CG-ICA
Twenty spiked swine urines were used to detect CLB quantitatively with two ICAs and assess the matrix effect. The results () indicated that the matrix effect was ubiquitous for the detection of CLB with swine urine. For TRFN-ICA, the detection results of samples 1, 5, 6, 7, 8, 12, 13, 14, 15, 16, 18, 19, and 20 were lower than the spiked concentration of CLB, whereas the detection results of samples 2, 3, 4, 9, 10, 11, and 17 were larger than the spiked concentration of CLB. For CG-ICA, the detection results of samples 4, 8, 9, 10, 13, 16, 17, 18, 19, and 20 were lower than the spiked concentration of CLB, whereas the detection results of samples 1, 2, 3, 5, 6, 7, 11, 12, 14, and 15 were larger than the spiked concentration of CLB. We compared the two ICAs and observed that the tolerance of CG-ICA to the matrix effect was better than that of TRFN-ICA. The detection results of samples 2, 9, 10, 11, and 17 were 4264, 1883, 2782, 3251, and 1088 pg/mL, respectively, which were much larger than the spiked concentrations for TRFN-ICA, that is, more than 30% of spiked concentration of 800 pg/mL (1040 pg/mL). The detection results of samples 2, 7, and 11 were 1261, 1236, and 1107 pg/mL, respectively, which were much larger than the spiked concentration (1040 pg/mL) for CG-ICA. The detection results of samples 1, 5, 6, 7, 12, 13, 14, 15, 16, 18, and 20 were 352, 480, 93, 305, 380, 21, 116, 420, 213, 256, and 156 pg/mL, respectively, which were much lower than the spiked concentration for TRFN-ICA, that is, less than 30% of the spiked concentrations of 800 pg/mL (560 pg/mL). The detection result of sample 18 was 383 pg/mL, which was much lower than the spiked concentration (560 pg/mL) for CG-ICA. These data indicated that the number of samples in which the detection results were more than and less than 30% of the spiked concentrations for TRFN-ICA and CG-ICA were 16 (5 + 11) and 4 (3 + 1), respectively. Furthermore, some detection results of TRFN-ICA were 4264, 2782, and 3251 pg/mL, which were higher than that of CG-ICA (1261 pg/mL). Meanwhile, some detection results of TRFN-ICA were 93, 21, 116, and 156 pg/mL, which were lower than that of CG-ICA (383 pg/mL). However, the sensitivity of TRFN-ICA was better than that of CG-ICA, and the detection time of the former was shorter than that of the latter. The matrix effect on TRFN-ICA was also more serious than that on CG-ICA.
Table 3. Matrix effect of the TRFN-ICA and CG-ICA in CLB-spiked twenty swine urine samples.
4. Conclusions
TRFN-ICA and CG-ICA were successfully established and systematically compared for the quantitative detection of CLB on the basis of an indirect competitive format. The LODs of TRFN-ICA and CG-ICA were 16 and 68 pg/mL, respectively. The sensitivity of TRFN-ICA was better than that of CG-ICA, and the detection time of the former was shorter than that of the latter because TRFN has unique optical properties, such as high fluorescence intensity, narrow emission bands, large Stoke shifts, and long fluorescence lifetime. Twenty swine urine samples were analyzed by both methods to assess the matrix effects. CG-ICA could resist matrix interference to a greater extent than TRFN-ICA could do in the quantitative detection of CLB in swine urine. TRFN-ICA may need further studies for the practical detection of CLB in swine urine.
Acknowledgements
This study was financially supported by the Jiangxi Food Inspection and Testing Research Institute (JXARS-03).
Disclosure statement
No potential conflict of interest was reported by the authors.
Additional information
Funding
Related Research Data
References
- Bai, Y., Liu, Z., Bi, Y., Wang, X., Jin, Y., Sun, L., … Xu, S. (2012). Preparation of polyclonal antibodies and development of a direct competitive enzyme-linked immunosorbent assay to detect residues of phenylethanolamine a in urine samples. Journal of Agricultural and Food Chemistry, 60(46), 11618–11624. doi: https://doi.org/10.1021/jf3036066
- Deng, S. L., Shan, S., Xu, C. L., Liu, D. F., Xiong, Y. H., Wei, H., & Lai, W. H. (2014). Sample preincubation strategy for sensitive and quantitative detection of clenbuterol in swine urine using a fluorescent microsphere-based immunochromatographic assay. Journal of Food Protection, 77(11), 1998–2003. doi: https://doi.org/10.4315/0362-028X.JFP-14-086
- Deng, A., Xie, Y., Chang, H., Zhao, K., Li, J., Yang, H., … Xu, S. (2015). A novel immunochromatographic assay (ICA) based on surface-enhanced Raman scattering for the sensitive and quantitative determination of clenbuterol. Analytical Methods, 7(2), 513–520. doi: https://doi.org/10.1039/C4AY01923G
- Gu, H., Liu, L., Song, S., Kuang, H., & Xu, C. (2016). Development of an immunochromatographic strip assay for ractopamine detection using an ultrasensitive monoclonal antibody. Food and Agricultural Immunology, 27(4), 471–483. doi: https://doi.org/10.1080/09540105.2015.1126808
- Guo, J., Liu, L., Xue, F., Xing, C., Song, S., Kuang, H., & Xu, C. (2015). Development of a monoclonal antibody-based immunochromatographic strip for cephalexin. Food and Agricultural Immunology, 26(2), 282–292. doi: https://doi.org/10.1080/09540105.2014.907242
- He, L., Su, Y., Zeng, Z., Liu, Y., & Huang, X. (2007). Determination of ractopamine and clenbuterol in feeds by gas chromatography-mass spectrometry. Animal Feed Science and Technology, 132(3–4), 316–323. doi: https://doi.org/10.1016/j.anifeedsci.2006.03.013
- Hu, L. M., Luo, K., Xia, J., Xu, G. M., Wu, C. H., Han, J. J., … Lai, W. H. (2017). Advantages of time-resolved fluorescent nanobeads compared with fluorescent submicrospheres, quantum dots, and colloidal gold as label in lateral flow assays for detection of ractopamine. Biosensors and Bioelectronics, 91, 95–103. doi: https://doi.org/10.1016/j.bios.2016.12.030
- Khaemba, G. W., Tochi, B. N., Mukunzi, D., Joel, I., Guo, L., Suryobrobowo, S., … Xu, C. (2016). Development of monoclonal antibody and lateral test strip for sensitive detection of clenbuterol and related β2 -agonists in urine samples. Food and Agricultural Immunology, 27(1), 111–127. doi: https://doi.org/10.1080/09540105.2015.1079598
- Lai, W., Xu, Y., Fung, D. Y., & Xiong, Y. (2007). Development of a lateral-flow assay for rapid screening of the performance-enhancing sympathomimetic drug clenbuterol used in animal production; food safety assessments. Asia Pacific Journal of Clinical Nutrition, 16(S1), 106–110.
- Li, C., Luo, W., Xu, H., Zhang, Q., Xu, H., Aguilar, Z. P., … Xiong, Y. (2013). Development of an immunochromatographic assay for rapid and quantitative detection of clenbuterol in swine urine. Food Control, 34(2), 725–732. doi: https://doi.org/10.1016/j.foodcont.2013.06.021
- Li, C., Wu, Y. L., Yang, T., Zhang, Y., & Huang-Fu, W. G. (2010). Simultaneous determination of clenbuterol, salbutamol and ractopamine in milk by reversed-phase liquid chromatography tandem mass spectrometry with isotope dilution. Journal of Chromatography A, 1217(50), 7873–7877. doi: https://doi.org/10.1016/j.chroma.2010.10.055
- Liu, L., Luo, L., Suryoprabowo, S., Peng, J., Hua, K., & Xu, C. (2014). Development of an immunochromatographic strip test for rapid detection of ciprofloxacin in milk samples. Sensors, 14(9), 16785–16798. doi: https://doi.org/10.3390/s140916785
- Luo, K., Hu, L., Guo, Q., Wu, C., Wu, S., Liu, D. … Lai, W. (2017). Comparison of 4 label-based immunochromatographic assays for the detection of Escherichia coli O157:H7 in milk. Journal of Dairy Science, 100(7), 5176–5187. doi: https://doi.org/10.3168/jds.2017-12554
- Luo, W., Li, H., Xu, H., Xiong, Y., Wei, H., & Lai, W. (2011). Quantum dots-based lateral flow strip assay for rapid detection of clenbuterol. International conference on biomedical engineering and informatics, 1520–1524.
- Peng, J., Liu, L., Kuang, H., Cui, G., & Xu, C. (2016). Development of an icELISA and immunochromatographic strip for detection of norfloxacin and its analogs in milk. Food and Agricultural Immunology, 28(2), 288–298. doi: https://doi.org/10.1080/09540105.2016.1263987
- Qu, X., Lin, H., Du, S., Sui, J., Zhang, X., & Cao, L. (2016). Development of a nano-gold capillary immunochromatographic assay for rapid and semi-quantitative detection of clenbuterol residues. Food Analytical Methods, 9(9), 1–10. doi: https://doi.org/10.1007/s12161-016-0442-5
- Song, C., Zhi, A., Liu, Q., Yang, J., Jia, G., Shervin, J., … Xu, C. (2013). Rapid and sensitive detection of β-agonists using a portable fluorescence biosensor based on fluorescent nanosilica and a lateral flow test strip. Biosensors and Bioelectronics, 50, 62–65. doi: https://doi.org/10.1016/j.bios.2013.06.022
- Tang, X., Li, P., Zhang, Q., Zhang, Z., Zhang, W., & Jiang, J. (2017). Time-resolved fluorescence immunochromatographic assay developed using two idiotypic nanobodies for rapid, quantitative, and simultaneous detection of aflatoxin and zearalenone in maize and its products. Analytical Chemistry, 89(21), 11520–11528. doi: https://doi.org/10.1021/acs.analchem.7b02794
- Wang, J. Y., Chen, M. H., Sheng, Z. C., Liu, D. F., Wu, S. S., & Lai, W. H. (2015). Development of colloidal gold immunochromatographic signal-amplifying system for ultrasensitive detection of Escherichia coli O157:H7 in milk. Rsc Advances, 5(76), 62300–62305. doi: https://doi.org/10.1039/C5RA13279G
- Wu, K., Guo, L., Xu, W., Xu, H., Aguilar, Z. P., Xu, G., … Wan, Y. (2014). Sulfonated polystyrene magnetic nanobeads coupled with immunochromatographic strip for clenbuterol determination in pork muscle. Talanta, 129, 431–437. doi: https://doi.org/10.1016/j.talanta.2014.06.007
- Zhang, L. Y., Chang, B. Y., Dong, T., He, P. L., Yang, W. J., & Wang, Z. Y. (2009). Simultaneous determination of salbutamol, ractopamine, and clenbuterol in animal feeds by SPE and LC-MS. Journal of Chromatographic Science, 47(4), 324–328. doi: https://doi.org/10.1093/chromsci/47.4.324
- Zhang, M. Z., Wang, M. Z., Chen, Z. L., Fang, J. H., Fang, M. M., Liu, J., & Yu, X. P. (2009). Development of a colloidal gold-based lateral-flow immunoassay for the rapid simultaneous detection of clenbuterol and ractopamine in swine urine. Analytical and Bioanalytical Chemistry, 395(8), 2591–2599. doi: https://doi.org/10.1007/s00216-009-3181-2
- Zhang, G. P., Wang, X. N., Yang, J. F., Yang, Y. Y., Xing, G. X., Li, Q. M., … Guo, J. Q. (2006). Development of an immunochromatographic lateral flow test strip for detection of beta-adrenergic agonist Clenbuterol residues. Journal of Immunological Methods, 312(1–2), 27–33. doi: https://doi.org/10.1016/j.jim.2006.02.017
- Zhao, L., Zhao, J., Huangfu, W. G., & Wu, Y. L. (2010). Simultaneous determination of melamine and clenbuterol in animal feeds by GC–MS. Chromatographia, 72(3-4), 365–368. doi: https://doi.org/10.1365/s10337-010-1643-5