
ABSTRACT
Immunomodulatory effects of Echinacea purpurae and Pelargonium sidoides in calves were investigated. Sixty 25-day-old nonvaccinated calves living in integrated farm unit were randomly selected and were divided into 5 treatment groups consisting of 12 calves each; 4 groups were receiving different amounts and/or times of Echinacea and Pelargonium and the control group received placebo. Blood levels of γ-interferon, cytokine gene expression, lactoferrin and total IgG were analysed on days 0, 9, and 30. When levels for total IgG, γ-interferon, mRNAs for the γ-interferon, IL-1-β, IL-4 and the tumour necrosis factor-α genes were compared from days 0 to 9 post-treatment, significant differences were found between treated and non-treated calves using various amounts of Echinacea and Pelargonium; a doses of 250 mg Echinacea and 62.5 mg Pelargonium for 5 days seems to be ideal. Echinacea purpurae and Pelargonium sidoides are able to modulate immune functions in calves.
Introduction
Calf health and its management are important for the economy and productivity of cattle operations. Calves are exposed to many stress factors such as transport, inadequate feeding, constant exchange of animals, overcrowding, improper climate and poor hygienic conditions. These stress factors cause a decrease in natural immunity which in turn allows access of pathogens mainly through mucosal sites. Since the calf’s immune system is not well established in the first weeks of life, adequate colostral supply and good husbandry are critical to avoid intestinal and respiratory pathogens (Ayrle et al., Citation2016; Cho & Yoon, Citation2014; Lorenz et al., Citation2011). In order to improve calf health and immunity, numerous prophylactic tools such as antibiotics, vaccination, biosecurity and good husbandry are applied (Ayrle et al., Citation2016; Windeyer et al., Citation2014; Wu, He, & Kang, Citation2017).
Phytotherapy is an alternative health tool since it is able to modulate the innate and adaptive immunity with positive results for herd health. In addition, herbal products are advantageous to certain antibiotics since they do not promote bacterial resistance (Theisen & Muller, Citation2012). In order to reduce the antibiotic usage in farm animals, products derived from medicinal plants are used worldwide for the prevention and treatment of infectious diseases in animals and humans. However, the effects of many medicinal herbs on the immune system in animals have not been investigated in detail (Ayrle et al., Citation2016).
There are several reports on the effects of Echinacea, Pelargonium extracts in the immune system in animals and humans. Among the nine different Echinacea species, Echinacea pallida, Echinacea angustifolia and Echinacea purpurea have generally been used as herbal medicine (Zhai et al., Citation2007a). Various animal studies suggest that Echinacea may modulate innate and adaptive immune responses. It has previously been shown that E. purpurea activates murine/human macrophages by inducing the production of interferon (IFN) and interleukin (IL)-1 (Rininger, Kickner, Chigurupati, McLean, & Franck, Citation2000). Echinacin, derived from E. purpurea, has been reported to attach to macrophages and T cells, which protects the host from viral invasion (Goel et al., Citation2002; Xiong, Kadota, Tani, & Namba, Citation1996). In addition, a polysaccharide derived from Echinacea inhibited fungal and bacterial growth in mice and increased the level of reactive oxygen intermediates and macrophage chemotaxis as well as production of IL-10, IL-6, IL-1-β and tumour necrosis factor-α (TNF-α) (Roesler et al., Citation1991; Steinmuller et al., Citation1993). However, ethanol extracts of Echinacea decreased monocyte and macrophage responses in mice to lipopolysaccharide and endotoxin by downregulating the production of TNF-α and prostaglandin E2 (LaLone et al., Citation2007; Stevenson et al., Citation2005). In another study mice, E. angustifolia enhanced bacterial killing while E. pallida and E. purpurea did not have an effect on killing (Zhai et al., Citation2007b).
Echinacea was found to produce profound effects on immune cells such as an increase in immune cell numbers (Cundell, Matrone, Ratajczak, & Jr, Citation2003), respiratory cellular activity, lymphocyte activation (Robbers & Tyler, Citation1999), macrophages, phagocytosis (Goel et al., Citation2002; O’Neill, McKee, & Clarke, Citation2002), granulocyte migration (Cundell et al., Citation2003; O’Neill et al., Citation2002), natural killer cell cytotoxicity (Agbabiaka, Guo, & Ernst, 2000; Currier & Miller, Citation2001), interferon (Hayashi, Ohotsuki, Suzuki, & Watanabe, Citation2001) and cytokine production (Cundell et al., Citation2003; Robbers & Tyler, Citation1999) as well as antibody response (Bodinet, Lindequist, Teuscher, & Freudenstein, Citation2002; Freier et al., Citation2003; Rehman et al., Citation1999).
Herbal medicine prepared from the roots of Pelargonium sidoides and Pelargonium reniforme are traditionally used to treat gastrointestinal and respiratory infections, dysmenorrhoea and hepatic disorders in South Africa (Brendler & van Wyk, Citation2008). EPs 7630 derived from Pelargonium is approved as a medicinal product for the therapy of patients with acute bronchitis, common cold, rhinosinusitis, tonsillopharyngitis or COPD (Agbabiaka et al., Citation2008; Matthys et al., Citation2013). In addition, in vitro studies showed that Pelargonium acts against viral and bacterial infections by inhibiting the attachment to cells of influenza virus, HIV-1, HSV, coronavirus, RSV, parainfluenza virus, EMCV, coxsackie virus, Streptococcus pyogenes and Helicobacter pylori (Beil & Kilian, Citation2007; Theisen & Muller, Citation2012; Helfer et al., Citation2014; Thale et al., Citation2011). It has also been reported that EPs 7630 increased the mRNA expression of IL-1-β, IL-6, IL-10, IL-12, IL-18, TNF-α, IFN-α, IFN-γ (Kolodziej & Kiderlen, Citation2007; Trun, Kiderlen, & Kolodziej, Citation2006; Thale et al., Citation2011). However, there is no report on the effect of Pelergonium on livestock.
Cytokines play an important role in progression and prevention of infectious diseases by modulating the immune response such as induction of fever, the production of cellular and humoral factors such as antibodies, cytokines, acute phase proteins and interferons. Therefore, it is important to understand cytokine expression levels in immune cells in order to predict the innate and adaptive immune response to different pathogens after infections and vaccinations (Konnai, Usui, Ohashi, & Onuma, Citation2003; Pacheco et al., Citation2015; Prohl et al., Citation2015). The measurement of cytokine expression in blood cells is an important tool and real-time RT-PCR, ELISA, Northern Blotting and flowcytometry are generally used to determine the level of cytokine expression (Brodzki, Kostro, Krakowski, & Marczuk, Citation2015; Konnai et al., Citation2003; Pacheco et al., Citation2015; Prohl et al., Citation2015). Many studies to measure cytokine expression in humans using real-time RT-PCR was performed (Brendler & van Wyk, Citation2008; Dapas et al., Citation2014; Senchina et al., Citation2006), whereas only a few studies investigated the level of cytokine expression in cattle after administering phytotherapy (Ayrle et al., Citation2016; Wu, Nardone, & Lacetera, Citation2009).
Pelargonium sidoides and Echinacea extracts are frequently used for the treatment of certain viral and bacterial infections in humans and it has been demonstrated by many researchers that these herbs improve the innate and adaptive immunity. However, the effects of these herbs on calf health and immunity are not fully understood. Therefore, this study was designed to investigate the effects of Echinacea and Pelargonium on the cytokine gene expression, total IgG, γ-interferon and lactoferrin levels in calves.
Material and methods
Herbal preparation and study animals
In this study, a tablet form of the herbal medicinal product (CEVASTIM Tablet) containing the equivalent quantity of the ampoule formulation of Echinacea purpurae (500 mg) and Pelargonium sidoides (135 mg) was used orally.
The study consisted of the 25 days old, Holstein, nonvaccinated calves, living in a good husbandry conditions in an integrated farm unit located in the Thrace district of Turkey. Randomly selected calves were divided into 5 animal groups (4 treatment groups and 1 control) consisting of 12 calves in each group. Vaccination status was considered in dividing groups. For this, one control nonvaccinated, one vaccinated (½ tablet for 5 days), and three nonvaccinated groups (½ tablet for 5 days, 1 tablet for 5 days, ½ tablet for 10 days) were designed. The vaccinated and nonvaccinated groups received the treatment (CEVASTIM tablet) orally while control receiving placebo ().
Table 1. Animal groups, amount of product, samples and study scheme used in the study. *Blood for cytokine expression was taken 4 days after stopping oral administration (day 14). **Animals in this group received routine vaccination with a combined viral and bacterial vaccine.
All calves received the same feed and husbandry conditions like the other calves on the farm. The animal groups, amount of product administered, sample collection and study scheme are shown in . Blood was collected in tubes with EDTA for determination of γ-interferon by ELISA, in TEMPUS Blood RNA tubes (Applied Biosystems, Cat No. 4342792) for evaluation of cytokine gene expression and in serum tubes to obtain sera for Lactoferrin and total IgG analyses as indicated in .
Determination of γ-interferon, lactoferrin and total IgG levels by ELISA
γ-interferon levels in blood were determined by using a commercial test kit (AniGen TB-feron, Bionote, 3801P0001) as described by the manufacturer. Serum lactoferrin and total IgG levels were also determined using commercial test kits as described by the manufacturers (BETHYL, Bovine Lactoferrin-ELISA Quantitation Set, E10-126, and (Bovine IgG-ELISA Quantitation Kit, BETHYL, E10-118). All sera were analysed in duplicates.
RNA extraction and reverse transcription
Total RNA was extracted from blood samples by using the Tempus Spin RNA Isolation Kit as described by the manufacturer (Thermo Fisher Scientific, Cat No. 4380204). The amount of RNA in the extracted material (90 µl) was measured using a NanoDrop spectrophotometer (NanoDrop 1000c, Thermo Scientific, Waltham, MA, USA). The extracted RNA (about 300 ng) was used for cDNA synthesis.
Reverse transcription and generation of cDNA were performed with 10 µl RNA using a high-capacity Reverse Transcription Kit (ThermoFischer Scientific, Cat No: 4368813). Twenty (20) microlitre of cDNA was generated according to the manufacturer’s instruction.
SYBR-green real-time RT-PCR assay for β-actin and cytokine gene expression
The method used for β-actin, γ-interferon and IL-1-β gene expression analyses was a modification of the method described previously (Prohl et al., Citation2015). The optimized SYBR-green real-time RT-PCR consisted of a total volume of 25 µl reaction mixture, containing (i) 12.5 µl Power SYBR-Green PCR Master Mix (Applied biosystems ThermoFisher Scientific, Cat No. 4367659), 0.4 µl F primer (10 pMol/µl), 0.4 µl R primer (10 pMol/µl), 0.25 µl MgCl2 (25 mMol), 9.45 µl nuclease free water and 2 µl cDNA for β-actin as the housekeeping gene, (ii) 12.5 µl Power SYBR-Green PCR Master Mix (Applied biosystems ThermoFisher Scientific, Cat No. 4367659), 1 µl F primer (100 pMol/µl), 1 µl R primer (100 pMol/µl), 0.5 µl MgCl2 (25 mMol), 8 µl nuclease free water and 2 µl cDNA for γ-interferon and (iii) 12.5 µl Power SYBR-Green PCR Master Mix (Applied biosystems ThermoFisher Scientific, Cat No. 4367659), 2 µl F primer (10 pMol/µl), 2 µl R primer (10 pMol/µl), 0.5 µl MgCl2 (25 mMol), 6 µl nuclease free water and 2 µl cDNA for IL-1-β. The mixture was placed in a thermal cycler (Stratagene Mx3005P) and the polymerase activated, by incubation at 95°C for 10 min. Cycling conditions were 95°C for 15 s, 63°C for 20 s and 72°C for 15 s for 45 cycles. In order to determine the melting curve, the thermal cycler was programmed to read the fluorescence from 60°C to 99°C in 1°C increments every 10 s.
For IL-2 and IL-4, an optimized SYBR-green real-time RT-PCR reaction was performed by a modified protocol described previously (Konnai et al., Citation2003). Total volume of 25 µl reaction mixture containing (i) 12.5 µl Power SYBR-Green PCR Master Mix (Applied biosystems Thermo Fisher Scientific, Cat No. 4367659), 1 µl F primer (20 pMol/µl), 1 µl R primer (20 pMol/µl), 0.5 µl MgCl2 (25 mMol), 8 µl nuclease free water and 2 µl cDNA for IL-2 and (ii) 12.5 µl Power SYBR-Green PCR Master Mix (Applied biosystems ThermoFisher Scientific, Cat No. 4367659), 0.4 µl F primer (20 pMol/µl), 0.4 µl R primer (20 pMol/µl), 9.7 µl nuclease free water and 2 µl cDNA for IL-4. Cycling conditions were 94°C for 1 s, 52°C for 5 s and 72°C for 10 s for 50 cycles. In order to determine the melting curve, the thermal cycler was programed to read the fluorescence from 60°C to 99°C in 1°C increments every 10 s.
Data and statistical analyses
For the gene expressions study, to control suitability of selected internal control gene, PCR efficiency was calculated for cytokine genes and β-actin gene by tenfold serial dilution of cDNA. A plot was generated with the CT (y-axis) versus log cDNA dilution (x-axis) and slope was determined. PCR efficiency (E) was calculated by the equation slope = −(1/LogE). The mRNA expression was analysed triplicate for each cytokine genes and β-actin gene. Delta CT (ΔCT) was calculated between each cytokine gene and β-actine gene and fold changes between treated and control groups was calculated using 2−ΔΔCT formula (Schmittgen & Livak, Citation2008). The P-value (P < .05) were determined based on Student’s t-test for checking internal control gene (β-actine) changes under the experimental conditions and between ΔCT values for control and treatment groups. Student’s t-test was performed using GraphPad Prism version 7.00 (Yuan, Reed, Chen, & Stewart Jr, Citation2006).
Results
γ-interferon, lactoferrin and total IgG levels
γ-interferon levels
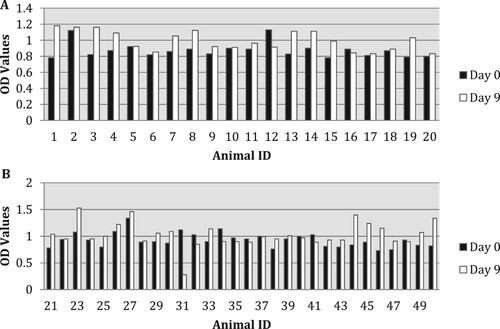
γ-interferon levels varied amongst experimental and control animals. The highest Optical Density (OD) obtained after day 9 was 1500 ((A,B)). The increase in γ-interferon levels on day 9 was statistically significant in groups received ½ tablet for 5 days vaccinated (ID 1–10), ½ tablet for 5 days (ID 21–30) and ½ tablet for 10 days (ID 41–50) ((A,B)).
Figure 1. (A,B) OD of γ-interferon levels of all groups before (day 0) and after (day 9) oral administration. Animal ID: from 1 to 10 – ½ tablet for 5 days vaccinated; from 11 to 20 – controls; from 21 to 30 – ½ tablet for 5 days; from 31 to 40 – 1 tablet for 5 days; from 41 to 50 – ½ tablet for 10 days. Light bars: day 0; dark bars: day 9.
Lactoferrin levels
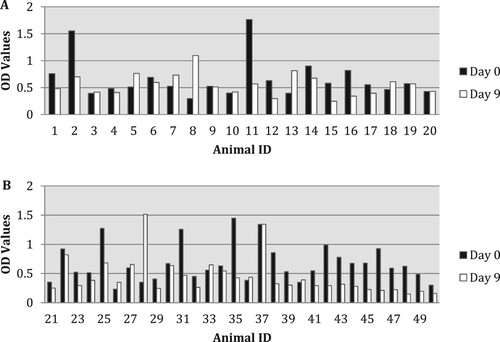
Lactoferrin levels varied amongst experimental and control animals. The highest OD obtained after day 9 was 1590 ((A,B)). The increase in lactoferrin levels from days 0 to 9 in all treatment groups was not statistically significant. However, a decrease seen in animals ½ tablet administered for 5 days (ID 21–30) was statistically significant.
Figure 2. (A,B) OD of Lactoferrin levels of all groups before (day 0) and after (day 9) oral administration. Animal ID: from 1 to 10-½ tablet for 5 days vaccinated; from 11 to 20 – controls; from 21 to 30 – ½ tablet for 5 days; from 31 to 40 – 1 tablet for 5 days; from 41 to 50 – ½ tablet for 10 days. Light bars: day 0; dark bars: day 9.
Total IgG levels
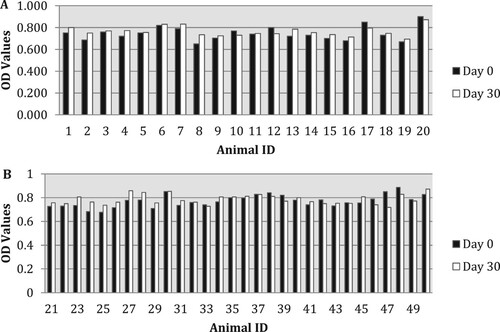
Total IgG levels varied amongst experimental and control animals. The highest OD obtained after day 9 was 0.900 ((A,B)). The difference in total IgG levels between the days 0 and 9 was statistically significant only in animals given ½ tablets for 5 days (ID 21–30; (A,B)). There was an increase in the total IgG level in animals received ½ tablet for 5 days vaccinated (ID 1–10), but this was statistically not significant (P = .08).
Figure 3. (A,B) OD of total IgG levels of all groups before (day 0) and after (day 9) oral administration. Animal ID: from 1 to 10-½ tablet for 5 days vaccinated; from 11 to 20 – controls; from 21 to 30 – ½ tablet for 5 days; from 31 to 40 – 1 tablet for 5 days; from 41 to 50 – ½ tablet for 10 days. Light bars: day 0; dark bars: day 9.
β-actin and cytokine gene expression
PCR efficiency of the β-actin and cytokine genes were found to be between 1.8 and 2.2 which is sufficient for comparison. The mean and 95% of confidence intervals of fold changes for all cytokine genes are given in and . Results of the statistical analyses of the delta CT values between reference and target (cytokine) genes for both control and treatment groups are given in . There were no significant changes in β-actin gene expression before (day 0) and after treatment (day 9) except the group of animals received ½ tablet treatment for 10 days (). The results of the animal groups in target gene expression are explained below.
Figure 4. The mean and 95% of confidence intervals of fold changes for all cytokine genes in animal treatment groups.
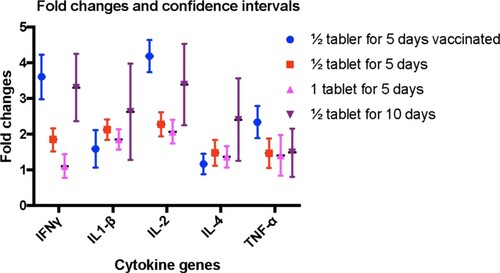
Table 2. The mean and 95% of confidence intervals of fold changes for all cytokine genes in animal treatment groups.
Table 3. Summary of the results from the statistical analyses of the delta CT values between reference and cytokine genes for both control and treatment groups. NS: statistically not significant; S: statistically significant (P < .05).
Animal treatment groups for cytokine gene expression
½ tablet 5 days-vaccinated group
Interferon γ, IL-1-β and IL-2, IL-4 and TNF-α gene expression were upregulated in the animals treated with ½ tablet product for 5 days and received routine vaccination (, ). The gene fold expression calculated by using the values in control (day 0) and after (day 9) treatment for interferon γ, IL-1-β, IL-2 and TNF-α were statistically significant (). Changes in control groups were not statistically significant ().
½ tablet for 5 days-nonvaccinated group
Interferon γ, IL-1-β and IL-2, IL-4 and TNF-α gene expression were upregulated in the animals treated with ½ tablet product for 5 days (, ). The gene fold expression calculated by using the values in control (day 0) and after (day 9) treatment for interferon γ, IL-1-β, IL-2 and TNF-α were statistically significant (). Changes in control groups were not statistically significant ().
1 tablet for 5 days-nonvaccinated group
Interferon γ, IL-1-β and IL-2, IL-4 and TNF-α gene expression were upregulated in the animals treated with 1 tablet product for 5 days (, ). The gene fold expression calculated by using the values in control (day 0) and after (day 9) treatment for IL-1-β, IL-2 and TNF-α were statistically significant (). Changes in control groups were not statistically significant ().
½ tablet for 10 days-nonvaccinated group
Interferon γ, IL-1-β and IL-2, IL-4 and TNF-α gene expression were upregulated in the animals treated with 1 tablet product for 5 days (, ). The gene fold expression calculated by using the values in control (day 0) and after (day 9) treatment for interferon γ, IL-1-β, IL-2, IL-4 and TNF-α was statistically significant (). Changes in control groups were also statistically significant (). Therefore, the upregulation in the treated group cannot be concluded as upregulation.
Summary of the comparison of all groups for all parameters analysed
Summary of the statistically significance and nonsignificance for all parameters are shown in and .
The increase in γ-interferon levels on day 9 was statistically significant in groups received ½ tablet for 5 days-vaccinated, ½ tablet for 5 days and ½ tablet for 10 days (). The difference in total IgG levels between the days 0 and 9 was statistically significant only in animals given ½ tablets for 5 days (). However, lactoferrin levels were decreased in all groups ().
Table 4. Summary of the results from ELISA for γ-interferon, lactoferrin and toatl IgG levels in all groups. NS: statistically not significant; S: statistically significant (P < .05).
For the cytokine gene expression; in ½ tablet 5 days-vaccinated group, the gene fold expression for interferon γ, IL-1-β, IL-2 and TNF-α was statistically significant (). In ½ tablet for 5 days-nonvaccinated group, the gene fold expression for interferon γ, IL-1-β, IL-2 and TNF-α was statistically significant (). In 1 tablet for 5 days-nonvaccinated group, the gene fold expression for IL-1-β, IL-2 and TNF-α was statistically significant (). In ½ tablet for 10 days-nonvaccinated group, the gene fold expression for interferon γ, IL-1-β, IL-2, IL-4 and TNF-α was statistically significant in both study group and control group (). Therefore, the upregulation in this group cannot be calculated and therefore cannot be considered to be as upregulation.
Discussion
Respiratory and mucosal pathogens have a significant impact on the cattle health (Cho & Yoon, Citation2014; Pfützner & Ozsvari, Citation2017; Windeyer et al., Citation2014). Neonatal calf diarrhoea and respiratory infections are found to be the most frequent cause of calf losses with a mortality up to 55% in many countries (Ayrle et al., Citation2016 Bähler et al., Citation2012; Cho & Yoon, Citation2014; Lorenz et al., Citation2011;; Meganck, Hoflack, & Opsomer, Citation2014; Windeyer et al., Citation2014). Vaccines, antibiotics, biosecurity and good husbandry are generally applied to combat those infections in calves. In addition to these, alternative approaches like herbal products are needed to promote calf immune system to combat pathogens in calves. In contrast to human and experimental animals, there are not many studies related to use of phytotherapy to investigate immunomodulatory effect in farm animals (Basmacioğlu Malayoğlu et al., Citation2010; Ayrle et al., Citation2016; Baruh & Kacabağlı, Citation2017). In the absence of comprehensive information on the effect of Echinacea and Pelargonium in cattle immunity, this study was performed to investigate potential efficacy of Echinacea and Pelargonium on the cytokine expression, total IgG, γ-interferon and lactoferrin levels in calves.
Up to date, the effect of Echinacea, Ginseng and Tinospora on the immune modulation of cattle to pathogens have been investigated (Hu, Concha, Lin, & Persson Waller, Citation2003; Mukherjee, De, & Ram, Citation2010; Wu et al., Citation2009). In one study, extract of Echinacea angustifolia increased the PBMNC count and interferon production in cattle (Wu et al., Citation2009). In another study, using the Ginseng extract in cattle with mastitis has formed an adjuvant effect when combined with ovalbumin and Staphylococcus aureus bacterin by increasing lymphocyte count and the antibody response (Hu et al., Citation2003). In the other study, in cattle with mastitis, the extract of Tinospora cordifolia has increased the somatic cell count, phagocytic and lysosomal enzyme activity and IL-8 level, and caused reduction of the total bacterial count in milk (Mukherjee et al., Citation2010). Results of these studies indicated that medicinal herbs have potential to modulate immune system in cattle.
In the present study, using the Echinacea and Pelargonium extract in calves have increased total IgG level, γ-interferon level and cytokine gene expression. Echinacea also caused an increase in immunological parameters in dogs and sheep. In dogs which received Echinacea formulation, PCV, Hb, RBC count, WBC count, Lym, Nut, the per cent of phagocytosis and IgM level were significantly increased (P < .05) (Torkan, Khamesipour, & Katsande, Citation2015). In sheep, Salmonella enteritidis (SE) bacterin and dried roots of Echinacea purpurea (EP) were used together and enhancement in antibody production was reported (Barbour et al., Citation2015).
Species of an herb, the amount of the product, duration of administration and the method analysed will effect the immunomodulation of the medicinal herbs in a given animal (Ayrle et al., Citation2016). In the present study, Echinacea and Pelargonium were used since the results of previous studies have shown that these herbs modulate the immune system (Ayrle et al., Citation2016; Barrett, Citation2003; Brendler & van Wyk, Citation2008; Kayser, Kolodziej, & Kiderlen, Citation2001). The amount and duration of these herbs were tested in this study by using a different amount of CEVASTIM in different durations. The method, real-time RT-PCR to estimate cytokine expression levels used in this study was also used by many investigators (Dapas et al., Citation2014; Konnai et al., Citation2003; Puech, Dedieu, Chantal, & Rodrigues, Citation2015). Results of previous studies have indicated that cytokine gene expression usually increases after 72–96 hours of immunization (Dar, Hajam, Suryanarayana, Kishore, & Kondabattula, Citation2015). Therefore, in the present study, blood was taken to measure cytokine gene expression level 96 hours after stopping oral administration of CEVASTIM.
In contrast to calves, immunomodulatory effect of Echinacea and Pelargonium has been widely investigated in human and experimental animals (Agbabiaka et al., Citation2008; Moyo & Van Staden, Citation2014; Uluısık & Keskin, Citation2012; Wagner et al., Citation2015). It has been demonstrated that extract of both plants especially Pelargonium extract (EPs 7630) have anti-infective properties (Brendler & van Wyk, Citation2008; Conrad & Frank, Citation2008; Timmer et al., Citation2013). In a study performed by Hall and others (Citation2007), Echinacea purpurea reduced the duration of upper respiratory infections in human. In influenza vaccinated human, four Echinacea species (E. angustifolia, E. purpurea, E. simulata, E. tennesseensis) had no effect on IFN-γ production, diminished the IL-2 production but augmented the IL-10 production. However, Echinacea pallida suppressed expression of all cytokines (Senchina et al., Citation2006). In the present study, in treatment groups of animals, Echinacea and Pelargonium combination had no effect on IL-4 gene upregulation but upregulated the other targeted cytokine genes except the group which received ½ tablet fro 10 days. In one study, Echinacea was found to have anti-inflammatory properties since reduced severity of symptoms have been seen in vivo during the treatment of upper respiratory tract infections with Echinacea (Fast, Balles, Scholten, Mulder, & Rana, Citation2015). However, TNF-α production was decreased. In the present study, the TNF-α gene expression was upregulated in 3 treated groups (1/2 tablet for 5 days vaccinated, ½ tablet for 5 days and 1 tablet for 5 days) when compared to controls. In another study in human, a syrup containing Echinacoside and polysaccharide from Echinacea was administered to 10 people once a day for 1 month. Results showed that IL-2 and IL-8 were upregulated while the mRNA levels of the pro-inflammatory cytokines TNF-α and IL6 downregulated. This regulation was correlated with the cytokine levels in plasma (Dapas et al., Citation2014). In the present study, similar results were obtained that IL-2 expression was upregulated except in a group of animals received ½ tablet products for 10 days. In one study, the efficacy of 5 days of Pelargonium sidoides therapy for preventing asthma attack during upper respiratory tract viral infections was investigated. Sixty-one asthmatic children with upper respiratory tract viral infection were enrolled in the study which indicated the children administered Pelargonium sidoides, had less frequency of asthma attack (Tahan and Yaman, Citation2013). Similarly, in the present study, the 5 days regime had a better effect on targeted cytokine gene expression in calves except IL-4. In another study in human, EPs® 7630 (100 μg/ml) interfered with replication of seasonal influenza A virus strains (H1N1, H3N2), human coronavirus, respiratory syncytial virus, parainfluenza virus, and coxsackie virus but did not have any effect on the replication of highly pathogenic avian influenza A virus (H5N1), rhinovirus or adenovirus (Michaelis, Doerr, & Cinatl, Citation2011).
The EPs-7630 experiments with regard to cytokine expression gene (iNOS, IFN-α, IFN-γ, TNF-α, IL-1, IL-10, IL12, IL-18) have shown the immunomodulatory effect of Pelargonium in response to infected macrophages (Kolodziej & Kiderlen, Citation2007). Similar results were obtained in experimental animals considering the anti-infective and immunomodulatory effect of Echinacea and Pelargonium. In one study, mice were administered once a day (for 7 days) with Echinacea extracts and immunized with sheep red blood cells (sRBCs). Antibody response to sRBC was significantly increased by three Echinacea species. They caused a significant increase in interferon-α production, but inhibited the release of TNF-γ and IL-1-β. The inhibition of TNF-α was also seen in this study except in one study group. E. angustifolia and E. pallida administered mice demonstrated significantly higher production of IL-4 and IL-10. These results indicated that Echinacea modulates both innate and adaptive immune responses (Zhai et al., Citation2007a). In a murine model, E. purpurea activated macrophages to stimulate IFN-γ production (Mishima et al., Citation2004).
In a study performed in rats by using Echinacea and Ginseng, an increase in expression of IL-10 and TNF-α genes were found (Uluısık & Keskin, Citation2012). In mice, IMMUNAL was found to be effective in enhancing antibody production to sRBCs but no such effect was seen when ECHINACEA FORTE drops used (Bałan, Sokolnicka, Skopińska-Różewska, & Skopiński, Citation2016). In one study, all the Pelargonium extracts (EC(50), gallic acid (EC(50) and its methyl ester (EC(50) significantly decreased the intracellular survival of L. donovani amastigotes within murine macrophages by triggering macrophage activation (Kayser et al., Citation2001). As a murine model of tuberculosis, Pelargonium sidoides stimulated macrophage killing, but not uptake of M. tuberculosis and M. fortuitum equally well (Kim, Griffiths, & Taylor, Citation2009).
Animal experiments have shown that a combination of Echinacea extracts demonstrated greater effects than extracts of a single plant (Bodinet et al., Citation2002). Therefore, two plants, Echinacea and Palergonium were used in this study. However, using a mixture of plants makes it difficult to distinguish the biological significance of each plant or identify redundancy in effects (Bodinet et al., Citation2002). Results of this study, combination of both plants were tested, indicated that this combination resulted in increase in γ-interferon levels in three groups of treated animals, and total IgG level in a group of treated animals which received CEVASTIM ½ tablet for 5 days as well as upregulation of targeted cytokine gene expressions except IL-4.
Interesting part of this study was that ½ tablet of the extract used for 10 days induced upregulation of cytokine gene expression but upregulation was also seen in the controls and therefore cannot be concluded as positively correlated with fold changes. This might be associated with several factors such as duration and dose of the extract used. This effect is most likely associated with duration since an increase was observed in all targeted cytokine gene expression, total IgG and γ-interferon levels when CEVASTIM used for ½ tablet for 5 days. All of these effects were not seen in other treated animal groups while some groups were partly responded.
Conclusion
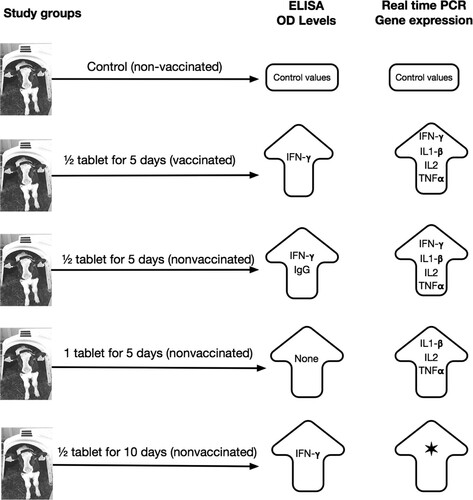
Using ½ tablet CEVASTIM in calves for 5 days has a potential to induce natural immune response as a result to modulate innate and adoptive immunity by increasing IgG and γ-interferon levels and upregulation of important cytokine (γ-interferon, IL-1-β, Il-2 and TNF-α) gene expression in calves. Summary of the statistically significant increase in ELISA and real-time PCR gene expression results are illustrated in .
Figure 5. Summary of the statistically significant increase in ELISA and real-time PCR gene expression results of study animals. *Indicates the increase in all groups including controls (accurate level of gene expression cannot be calculated in this group).
Disclosure statement
No potential conflict of interest was reported by the authors.
Additional information
Funding
Related Research Data
References
- Agbabiaka, T. B., Guo, R., & Ernst, E. (2008). Pelargonium sidoides for acute bronchitis: A systematic review and meta-analysis. Phytomedicine, 15, 378–385. doi: https://doi.org/10.1016/j.phymed.2007.11.023
- Ayrle, H., Mevissen, M., Kaske, M., Nathues, H., Gruetzner, N., Melzig, M., & Walkenhorst, M. (2016). Medicinal plants – prophylactic and therapeutic options for gastrointestinal and respiratory diseases in calves and piglets? A systematic review BMC Veterinary Research, 12, 31. doi: https://doi.org/10.1186/s12917-016-0714-8
- Bähler, C., Steiner, A., Luginbuhl, A., Ewy, A., Posthaus, H., Strabel, D., … Regula, G. (2012). Risk factors for death and unwanted early slaughter in Swiss veal calves kept at a specific animal welfare standard. Research in Veterinary Science, 92(1), 162–168. doi: https://doi.org/10.1016/j.rvsc.2010.10.009
- Bałan, B. J., Sokolnicka, I., Skopińska-Różewska, E., & Skopiński, P. (2016). The modulatory influence of some Echinacea-based remedies on antibody production and cellular immunity in mice. Central European Journal of Immunology, 1(1), 12–18. doi: https://doi.org/10.5114/ceji.2016.58813
- Barbour, E. K., Assi, C. A., Shaib, H., Hamadeh, S., Murtada, M., Mahmoud, G., … Kumosani, T. (2015). Evaluation of a Salmonella Enteritidis vaccine and related ELISA for respective induction and assessment of acquired immunity to the vaccine and/or Echinacea purpurea in Awassi Ewes. Vaccine, 33(19), 2228–2231. doi: https://doi.org/10.1016/j.vaccine.2015.03.035
- Barrett, B. (2003). Medicinal properties of Echinacea: A critical review. Phytomedicine, 10, 66–86. doi: https://doi.org/10.1078/094471103321648692
- Baruh, ÜA, & Kacabağlı, N. (2017). Effect of different levels of oregano essential Oil on some rumen parameters in lambs. İstanbul Üniv. Vet. Fak. Derg. / J. Fac. Vet. Med. Istanbul Univ, 43(2), 116–122. doi: https://doi.org/10.16988/iuvfd.322369
- Basmacioğlu Malayoğlu, H., Baysal, S., Misirlioğlu, Z., Polat, M., Yilmaz, H., & Turan, N. (2010). Effects of oregano essential oil with or without feed enzymes on growth performance, digestive enzyme, nutrient digestibility, lipid metabolism and immune response of broilers fed on wheat-soybean meal diets. British Poultry Science, 51(1), 67–80. doi: https://doi.org/10.1080/00071660903573702
- Beil, W., & Kilian, P. (2007). EPs® 7630, an extract from Pelargonium sidoides roots inhibits adherence of helicobacter pylori to gastric epithelial cells. Phytomedicine, 14(6), 5–8. doi: https://doi.org/10.1016/j.phymed.2006.11.024
- Bodinet, C., Lindequist, U., Teuscher, E., & Freudenstein, J. (2002). Effect of an orally applied herbal immunomodulator on cytokine induction and antibody response in normal and immunosuppressed mice. Phytomedicine, 9, 606–613. doi: https://doi.org/10.1078/094471102321616418
- Brendler, T., & van Wyk, B. E. (2008). A historical, scientific and commercial perspective on the medicinal use of Pelargonium sidoides (Geraniaceae). Journal of Ethnopharmacology, 119, 420–433. doi: https://doi.org/10.1016/j.jep.2008.07.037
- Brodzki, P., Kostro, K., Krakowski, L., & Marczuk, J. (2015). Inflammatory cytokine and acute phase protein concentrations in the peripheral blood and uterine washings of cows with subclinical endometritis in the late postpartum period. Veterinary Research Communications, 39(2), 143–149. doi: https://doi.org/10.1007/s11259-015-9635-4
- Cho, Y. I., & Yoon, K. J. (2014). An overview of calf diarrhea – infectious etiology, diagnosis, and intervention. Journal of Veterinary Science, 15(1), 1–17. doi: https://doi.org/10.4142/jvs.2014.15.1.1
- Conrad, A., & Frank, U. (2008). Extract of Pelargonium sidoides (EPs® 7630) displays anti-infective properties by enhanced phagocytosis and differential modulation of host-bacteria interactions. Planta Medica, 74(6), 682–685. doi: https://doi.org/10.1055/s-2008-1034287
- Cundell, D. R., Matrone, M. A., Ratajczak, P., & Jr, P. J. (2003). The effect of aerial parts of Echinacea on the circulating white cell levels and selected immune functions of the aging male Sprague-Dawley rat. International Immunopharmacology, 3, 1041–1048. doi: https://doi.org/10.1016/S1567-5769(03)00114-0
- Currier, N. L., & Miller, S. C. (2001). Echinacea purpurea and melatonin augment natural-killer cells in leukemic mice and prolong life span. The Journal of Alternative and Complementary Medicine, 7, 241–251. doi: https://doi.org/10.1089/107555301300328115
- Dapas, B., Dall’Acqua, S., Bulla, R., Agostinis, C., Perissutti, B., Invernizzi, S., … Voinovich, D. (2014). Immunomodulation mediated by a herbal syrup containing a standardized Echinacea root extract: A pilot study in healthy human subjects on cytokine gene expression. Phytomedicine, 21(11), 1406–1410. doi: https://doi.org/10.1016/j.phymed.2014.04.034
- Dar, P. A., Hajam, I. A., Suryanarayana, V. S., Kishore, S., & Kondabattula, G. (2015). Kinetics of cytokine expression in bovine PBMCs and whole blood after in vitro stimulation with foot-and-mouth disease virus (FMDV) antigen. Cytokine, 72(1), 58–62. doi: https://doi.org/10.1016/j.cyto.2014.12.011
- Fast, D. J., Balles, J. A., Scholten, J. D., Mulder, T., & Rana, J. (2015). Echinacea purpurea root extract inhibits TNF release in response to Pam3Csk4 in a phosphatidylinositol-3-kinase dependent manner. Cellular Immunology, 297(2), 94–99. doi: https://doi.org/10.1016/j.cellimm.2015.07.003
- Freier, D. O., Wright, K., Klein, K., Voll, D., Dabiri, K., Cosulich, K., & George, R. (2003). Enhancement of the humoral immune response by Echinacea purpurea in female Swiss mice. Immunopharmacology and Immunotoxicology, 25, 551–560. doi: https://doi.org/10.1081/IPH-120026440
- Goel, V., Chang, C., Slama, J., Barton, R., Bauer, R., Gahler, R., & Basu, T. (2002). Echinacea stimulates macrophage function in the lung and spleen of normal rats. The Journal of Nutritional Biochemistry, 13, 487–492. doi: https://doi.org/10.1016/S0955-2863(02)00190-0
- Hall, H., Fahlman, M. M., & Engels, H. J. (2007). Echinacea purpurea and mucosal immunity. International Journal of Sports Medicine, 28(9), 792–797. doi: https://doi.org/10.1055/s-2007-964895
- Hayashi, I., Ohotsuki, M., Suzuki, I., & Watanabe, T. (2001). Effects of oral administration of Echinacea purpurea (American herb) on incidence of spontaneous leukemia caused by recombinant leukemia viruses in AKR/J mice. Japanese Journal of Clinical Immunology, 24, 10–20. doi: https://doi.org/10.2177/jsci.24.10
- Helfer, M., Koppensteiner, H., Schneider, M., Rebensburg, S., Forcisi, S., Muller, C., … Brack-Werner, R. (2014). The root extract of the medicinal plant Pelargonium sidoides is a potent HIV-1 attachment inhibitor. PLoS One, 9, e87487. doi: https://doi.org/10.1371/journal.pone.0087487
- Hu, S., Concha, C., Lin, F., & Persson Waller, K. (2003). Adjuvant effect of ginseng extracts on the immune responses to immunisation against Staphylococcus aureus in dairy cattle. Veterinary Immunology and Immunopathology, 91(1), 29–37. doi: https://doi.org/10.1016/S0165-2427(02)00264-7
- Kayser, O., Kolodziej, H., & Kiderlen, A. F. (2001). Immunomodulatory principles of Pelargonium sidoides. Phytotherapy Research, 15(2), 122–126. doi: https://doi.org/10.1002/ptr.785
- Kim, C. E., Griffiths, W. J., & Taylor, P. W. (2009). Components derived from Pelargonium stimulate macrophage killing of mycobacterium species. Journal of Applied Microbiology, 106(4), 1184–1193. doi: https://doi.org/10.1111/j.1365-2672.2008.04085.x
- Kolodziej, H., & Kiderlen, A. F. (2007). In vitro evaluation of antibacterial and immunomodulatory activities of Pelargonium reniforme, Pelargonium sidoides and the related herbal drug preparation EPs® 7630. Phytomedicine, 14, 18–26. doi: https://doi.org/10.1016/j.phymed.2006.11.020
- Konnai, S., Usui, T., Ohashi, K., & Onuma, M. (2003). The rapid quantitative analysis of bovine cytokine genes by real-time RT-PCR. Veterinary Microbiology, 94(4), 283–294. doi: https://doi.org/10.1016/S0378-1135(03)00119-6
- LaLone, C. A., Hammer, K. D., Wu, L., Bae, J., Leyva, N., Liu, Y., … Wurtele, E. S. (2007).Echinacea species and alkamides inhibit prostaglandin E 2 production in RAW264.7 mouse macrophage cells. Journal of Agricultural and Food Chemistry, 55, 7314–7322. doi: https://doi.org/10.1021/jf063711a
- Lorenz, I., Earley, B., Gilmore, J., Hogan, I., Kennedy, E., & More, S. J. (2011). Calf health from birth to weaning. III. Housing and management of calf pneumonia. Irish Veterinary Journal, 64(1), 14. doi: https://doi.org/10.1186/2046-0481-64-14
- Matthys, H., Pliskevich, D. A., Bondarchuk, O. M., Malek, F. A., Tribanek, M., & Kieser, M. (2013). Randomised, doubleblind, placebo-controlled trial of EPs 7630 in adults with COPD. Respiratory Medicine, 107, 691–701. doi: https://doi.org/10.1016/j.rmed.2013.02.011
- Meganck, V., Hoflack, G., & Opsomer, G. (2014). Advances in prevention and therapy of neonatal dairy calf diarrhoea: A systematical review with emphasis on colostrum management and fluid therapy. Acta Veterinaria Scandinavica, 56, 231. doi: https://doi.org/10.1186/s13028-014-0075-x
- Michaelis, M., Doerr, H. W., & Cinatl, J. (2011). Investigation of the influence of EPs® 7630, a herbal drug preparation from Pelargonium sidoides, on replication of a broad panel of respiratory viruses. Phytomedicine, 18(5), 384–386. doi: https://doi.org/10.1016/j.phymed.2010.09.008
- Mishima, S., Saito, K., Maruyama, H., Inoue, M., Yamashita, T., Ishida, T., & Gu, Y. (2004). Antioxidant and immuno-enhancing effects of Echinacea purpurea. Biological & Pharmaceutical Bulletin, 27(7), 1004–1009. doi: https://doi.org/10.1248/bpb.27.1004
- Moyo, M., & Van Staden, J. (2014). Medicinal properties and conservation of Pelargonium sidoides DC. Journal of Ethnopharmacology, 152(2), 243–255. doi: https://doi.org/10.1016/j.jep.2014.01.009
- Mukherjee, R., De, U. K., & Ram, G. C. (2010). Evaluation of mammary gland immunity and therapeutic potential of Tinospora cordifolia against bovine subclinical mastitis. Tropical Animal Health and Production, 42(4), 645–651. doi: https://doi.org/10.1007/s11250-009-9471-z
- O’Neill, W., McKee, S., & Clarke, A. F. (2002). Immunological and haematinic consequences of feeding a standardised Echinacea (Echinacea angustifolia) extract to healthy horses. Equine Veterinary Journal, 34, 222–227. doi: https://doi.org/10.2746/042516402776186001
- Pacheco, J. M., Smoliga, G. R., O’Donnell, V., Brito, B. P., Stenfeldt, C., Rodriguez, L. L., & Arzt, J. (2015). Persistent foot-and-mouth disease virus infection in the nasopharynx of cattle; tissue-specific distribution and local cytokine expression. PLoS One, 10(5), e0125698. doi: https://doi.org/10.1371/journal.pone.0125698
- Pfützner, M., & Ozsvari, L. (2017). The financial impact of decreased milk production due to subclinical mastitis in German dairy herds. İstanbul Üniv. Vet. Fak. Derg. / J. Fac. Vet. Med. Istanbul Univ., 43(2), 110–115. doi: https://doi.org/10.16988/iuvfd.322545
- Prohl, A., Wolf, K., Weber, C., Müller, K. E., Menge, C., Sachse, K., … Berndt, A. (2015). Kinetics of local and systemic leucocyte and cytokine reaction of calves to intrabronchial infection with chlamydia psittaci. PLoS One., 10(8), e0135161. doi: https://doi.org/10.1371/journal.pone.0135161
- Puech, C., Dedieu, L., Chantal, I., & Rodrigues, V. (2015). Design and evaluation of a unique SYBR green real-time RT-PCR assay for quantification of five major cytokines in cattle, sheep and goats. BMC Veterinary Research, 11, 65. doi: https://doi.org/10.1186/s12917-015-0382-0
- Rehman, J., Dillow, J. M., Carter, S. M., Chou, J., Le, B., & Maisel, A. S. (1999). Increased production of antigen-specific immunoglobulins G and M following in vivo treatment with the medicinal plants Echinacea angustifolia and hydrastis canadensis. Immunology Letters, 68, 391–395. doi: https://doi.org/10.1016/S0165-2478(99)00085-1
- Rininger, J. A., Kickner, S., Chigurupati, P., McLean, A., & Franck, Z. (2000). Immunopharmacological activity of Echinacea preparations following simulated digestion on murine macrophages and human peripheral blood mononuclear cells. Leukoc Biol, 68, 503–510.
- Robbers, J. E., & Tyler, V. E. (1999). Herbs of choise: The therapeutic use of phytomedicinals. New York, NY: Haworth Herbal Press.
- Roesler, J., Steinmuller, C., Kiderlen, A., Emmendorffer, A., Wagner, H., & Lohmann-Matthes, M. L. (1991). Application of purified polysaccharides from cell cultures of the plant Echinacea purpurea to mice mediates protection against systemic infections with Listeria monocytogenes and Candida albicans. International Journal of Immunopharmacology, 13, 27–37. doi: https://doi.org/10.1016/0192-0561(91)90022-Y
- Schmittgen, T. D., & Livak, K. J. (2008). Analyzing real-time PCR data by the comparative CT method. Nature Protocols, 3(6), 1101–1108. doi: https://doi.org/10.1038/nprot.2008.73
- Senchina, D. S., Wu, L., Flinn, G. N., Konopka del, N., McCoy, J. A., Widrlechner, M. P., … Kohut, M. L. (2006). Year-and-a-Half Old, Dried Echinacea roots retain cytokine-modulating capabilities in an in vitro human older adult model of influenza vaccination. Planta Medica, 72(13), 1207–1215. doi: https://doi.org/10.1055/s-2006-947254
- Steinmuller, C., Roesler, J., Grottrup, E., Franke, G., Wagner, H., & Lohmann-Matthes, M. L. (1993). Polysaccharides isolated from plant cell cultures of Echinacea purpurea enhance the resistance of immunosuppressed mice against systemic infections with candida albicans and listeria monocytogenes. International Journal of Immunopharmacology, 15, 605–614. doi: https://doi.org/10.1016/0192-0561(93)90078-D
- Stevenson, L. M., Matthias, A., Banbury, L., Penman, K. G., Bone, K. M., Leach, D., & Lehmann, R. P. (2005). Modulation of macrophage immune responses by Echinacea. Molecules, 10, 1279–1285. doi: https://doi.org/10.3390/10101279
- Tahan, F., & Yaman, M. (2013). Can the Pelargonium sidoides root extract EPs® 7630 prevent asthma attacks during viral infections of the upper respiratory tract in children?. Phytomedicine, 20(2), 148–150. doi: https://doi.org/10.1016/j.phymed.2012.09.022
- Thale, C., Kiderlen, A. F., & Kolodziej, H. (2011). Anti-infective activities of Pelargonium sidoides (EPS® 7630): effects of induced NO production on leishmania major in infected macrophages and antiviral effects as assessed in a fibroblast-virus protection assay. Planta Medica, 77, 718–725. doi: https://doi.org/10.1055/s-0030-1250567
- Theisen, L. L., & Muller, C. P. (2012). EPs® 7630 (umckaloabo®), an extract from Pelargonium sidoides roots, exerts anti-influenza virus activity in vitro and in vivo. Antiviral Research, 94, 147–156. doi: https://doi.org/10.1016/j.antiviral.2012.03.006
- Timmer, A., Günther, J., Motschall, E., Rücker, G., Antes, G., & Kern, W. V. (2013). Pelargonium sidoides extract for treating acute respiratory tract infections. Cochrane Database of Systematic Reviews, 10, CD006323.
- Torkan, S., Khamesipour, F., & Katsande, S. (2015). Evaluating the effect of oral administration of Echinacea hydroethanolic extract on the immune system in dog. Autonomic and Autacoid Pharmacology, 35(1-2), 9–13. doi: https://doi.org/10.1111/aap.12024
- Trun, W., Kiderlen, A. F., & Kolodziej, H. (2006). Nitric oxide synthase and cytokines gene expression analyses in leishmania-infected RAW 264.7 cells treated with an extract of Pelargonium sidoides (Eps® 7630). Phytomedicine, 13, 570–575. doi: https://doi.org/10.1016/j.phymed.2005.07.004
- Uluısık, D., & Keskin, E. (2012). Effects of ginseng and Echinacea on cytokine mRNA expression in rats. ScientificWorldJournal, 2012. doi:10.1100/2012/942025. Epub 2012 May 22.
- Wagner, L., Cramer, H., Klose, P., Lauche, R., Gass, F., Dobos, G., & Langhorst, J. (2015). Herbal medicine for cough: A systematic review and meta-analysis. Forschende Komplementarmedizin (2006), 22(6), 359–368.
- Windeyer, M. C., Leslie, K. E., Godden, S. M., Hodgins, D. C., Lissemore, K. D., & LeBlanc, S. J. (2014). Factors associated with morbidity, mortality, and growth of dairy heifer calves up to 3 months of age. Preventive Veterinary Medicine, 113(2), 231–240. doi: https://doi.org/10.1016/j.prevetmed.2013.10.019
- Wu, M., He, M., & Kang, Y. (2017). Vitamin C supplementation improved the efficacy of foot-and-mouth disease vaccine. Food and Agricultural Immunology, 1, 14. doi: https://doi.org/10.1080/09540105.2017.1406459
- Wu, H., Nardone, A., & Lacetera, N. (2009). Effects of a standardized purified dry extract from Echinacea angustifolia on proliferation and interferon gamma secretion of peripheral blood mononuclear cells in dairy heifers. Research in Veterinary Science, 87(3), 396–398. doi: https://doi.org/10.1016/j.rvsc.2009.05.005
- Xiong, Q., Kadota, S., Tani, T., & Namba, T. (1996). Antioxidative effects of phenylethanoids from Cistanche deserticola. Biological & Pharmaceutical Bulletin, 19, 1580–1585. doi: https://doi.org/10.1248/bpb.19.1580
- Yuan, J. S., Reed, A., Chen, F., & Stewart Jr, C. N. (2006). Statistical analysis of real-time PCR data. BMC Bioinformatics, 7, 85. doi: https://doi.org/10.1186/1471-2105-7-85
- Zhai, Z., Haney, D., Wu, L., Solco, A., Murphy, P. A., Wurtele, E. S., … Cunnick, J. E. (2007b). Alcohol extracts of Echinacea inhibit production of nitric oxide and tumor necrosis factor-alpha by macrophages in vitro. Food and Agricultural Immunology, 18(3-4), 221–236. doi: https://doi.org/10.1080/09540100701797363
- Zhai, Z., Liu, Y., Wu, L., Senchina, D. S., Wurtele, E. S., Murphy, P. A., … Cunnick, J. E. (2007a). Enhancement of innate and adaptive immune functions by multiple Echinacea species. Journal of Medicinal Food, 10(3), 423–434. doi: https://doi.org/10.1089/jmf.2006.257