
ABSTRACT
Clonidine (CLO) preferentially stimulates central α-2-adrenoceptors and causes both desirable and undesirable effects. Undesirable effects include sedation and withdrawal reactions, which occur as a sudden rise in arterial pressure, nervousness, agitation, and increased heart rate. An immunochromatographic test strip was developed for the rapid simultaneous detection of CLO and its cross-reactivity with apraclonidine (ACLO) in pig urine. The antigen CLO-OVA and goat anti-mouse IgG were attached to a nitrocellulose membrane as control line and test line. The cut-off limits of the test strips for CLO and ACLO were found to be 2.5 ng/mL in both 0.01 M PBS (pH 7.4) and pig urine. All the results were obtained within 5 min. The results revealed that the developed method is a sensitive, rapid, and simple tool for the detection of CLO and ACLO.
Introduction
Clonidine (N-(2,6-dichlorophenyl)-4,5-dihydro-1H-imidazol-2-amine; CLO) () is a direct-acting alpha-2 (α-2) adrenergic agonist that is used in the management of hypertension and attention-deficit hyperactivity disorders, for prophylaxis of vascular headaches, and as an aid in the diagnosis of pheochromocytoma in humans and animals (Mueller et al., Citation2007; Wang et al., Citation2015; Zadori et al., Citation2016). Side effects associated with orally dosed CLO, which include a sudden increase in arterial pressure, nervousness, agitation, increased heart rate, drowsiness, dizziness, constipation, and sedation, are believed to be related to fluctuations of CLO concentration in the blood stream (Pelzer, Addison, Li, Jiang, & Weng, Citation2002; Rosansky, Johnson, & McConnell, Citation1993).
Figure 1. Chemical structure of clonidine (A) and apraclonidine (B).
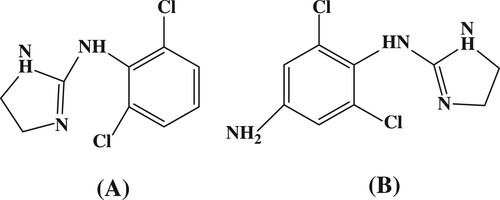
The residues of α-2 adrenergic agonist that accumulate in animal tissues could lead to cardiovascular and central nervous system effects in humans, including muscle tremors, palpitations, tachycardia, and dizziness (Brambilla et al., Citation2000). The effects of CLO and apraclonidine (ACLO) residues in food products for human consumption from treated animals have raised public health concerns. Intoxication and other side effects have been associated with meat or liver products containing CLO residues.
Several bioanalytical methods for the determination of CLO in different matrices, including plasma (Ghosh, Singh, Inamdar, Mote, & Chakraborty, Citation2009), urine (De Nicolo et al., Citation2017), and blood serum (Wenzl et al., Citation2002), have been reported. Sensitive and selective methods based on liquid chromatography-tandem mass spectrometry (Ghosh et al., Citation2009; Naidong et al., Citation2002; Parekh, Pudage, Joshi, Vaidya, & Gomes, Citation2008), gas chromatography (Yamahata, Dote, Ozawa, Nishikawa, & Maeda, Citation1994), and ultra-high performance liquid chromatography (De Nicolo et al., Citation2016; Citation2017; Veigure et al., Citation2017) have been reported. These methods, however, are time-consuming and expensive because they require long to clean-up procedures and sophisticated analytical instruments (Chen et al., Citation2017; Isanga et al., Citation2017; Liu, Suryoprabowo, Zheng, Song, & Kuang, Citation2017).
Immunoassays have been widely used as screening methods due to their high sensitivity, specificity, fast detection speed, and low cost. An electrochemical immunoassay based on the use of gold nanoparticle (GNP) and immunochromatographic strips offer attractive approaches to the detection and identification of biomolecules. It had been widely used as a diagnosis tool to detect and identify infectious diseases, cancer, cardiovascular problems, and biological warfare agents (Mao, Baloda, Gurung, Lin, & Liu, Citation2008; Weller, Citation2000). GNPs of different coloured latex particles also have been used in formats such as the dot blot immunoassay. This approach simplifies interpretation of the results of a multiparameter assay, as each binding zone and the corresponding analyte can be identified based on the colour of the maker (Taranova, Berlina, Zherdev, & Dzantiev, Citation2015). Chemiluminescence immunoassay (CLIA) also has been widely used in different fields including clinical diagnosis, food safety, and environmental. CLIA is a technique of chemiluminescence combined with immunoassay. Its high sensitivity, good specificity, rapid analysis, and simple operation (Xiao & Lin, Citation2015; Wang, Liu, Shao, et al., Citation2017).
An immunoassay, based on the highly specific interaction between an antigen and an antibody, could provide a sensitive method for the detection of CLO. Immunochromatographic assay test strips, also known as lateral flow immunoassay (LFIA) test strips, are becoming increasingly popular as diagnostic tools for detecting target analytes because they are simple to use, rapid, specific, and sensitive. The advantages of this method are that all of the reagents are included in the strip and results can be obtained within 5–10 min (Ding, Liu, Song, Kuang, & Xu, Citation2017; Kong et al., Citation2017a, Citation2017b; Wang, Xie, et al., Citation2017).
Although immunochromatographic lateral flow testing is widely applicable to the best of our knowledge, no immunochromatographic lateral flow test device for the detection of CLO and ACLO residues has been described. The aim of this study was to develop an immunochromatographic lateral flow test strip for the detection of CLO and ACLO in pig urine.
Materials and methods
Chemical and reagents
CLO and ACLO were purchased from J&K Scientific (Shanghai, China). Complete Freund’s adjuvant (FCA), incomplete Freund’s adjuvant (FIA), and enzyme immunoassay-grade horseradish peroxidase-labelled goat anti-mouse immunoglobulin were obtained from Sigma-Aldrich (St. Louis, MO, USA). Gelatin was supplied by Beijing Biodee Biotechnology Co., Ltd. (Beijing, China). Tetramethylbenzidine and horseradish peroxidase were acquired from Aladdin Chemistry Co., Ltd. (Shanghai, China). All reagents used for cell fusion were purchased from Sunshine Biotechnology Co., Ltd. (Nanjing, China). Ovalbumin (OVA) and keyhole-limpet haemocyanin (KLH) were obtained from Solarbio Science & Technology, Co, Ltd. (Beijing, China). All other reagent and chemicals were supplied by the National Pharmaceutical Group Chemical Reagent Co, Ltd. (Shanghai, China).
Nitrocellulose (NC) high-flow plus membranes (Pura-bind RP) were obtained from Whatman-Xinhua Filter Paper Co., Ltd. (Hangzhou, China). Glass fibre membrane (CB-SB08) used for the sample pad, polyvinylchloride (PVC) backing material and absorbance pad (SX18) were supplied by Goldbio Tech Co., Ltd. (Shanghai, China). The conjugated coating antigens (CLO-OVA) and specific monoclonal antibodies (anti-CLO mAb, No. 2E7) were generated in our laboratory.
All buffer solutions were prepared using ultrapure water (Milli-Q purification system, Millipore Co., Bedford, MA, USA). The strip cutting instrument was a CM 4000 guillotine cutting system (Gene, Shanghai, China), and the dispensers were an Airjet Quanti 3000™ and a Biojet Quanti 3000™ (XinqidianGene Technology Co., Ltd., Beijing, China).
Preparation and characterization of anti-CLO monoclonal antibody
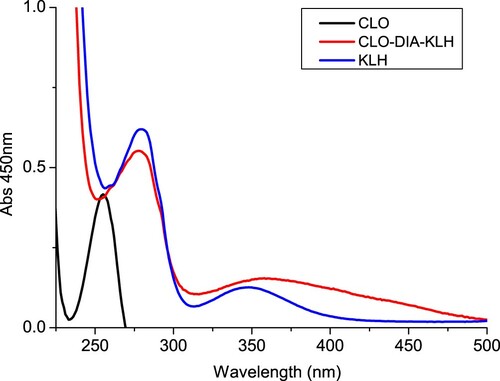
CLO was conjugated to OVA () and KLH () using the diazobenzidine method. Briefly, CLO was dissolved in 1 M hydrochloric acid (HCl) and methanol solution. The mixture was stored at 4°C for 0.5 h, and then 30% sodium nitrite (5 µL) was added and the mixture was stirred at 4°C for 1 h in the dark (solution I). OVA or KLH was dissolved in 0.1 M carbonate–bicarbonate buffer (pH 9.6). Solution 1 was added to the protein solution and stirred for 4 h in the dark. The conjugate was dialysed against 0.01 M PBS for 3 d and subsequently against distilled water for 3 d. The antigen was stored at −20°C before use.
Figure 2. The UV spectra characterization for clonidine (CLO), clonidine was conjugated to OVA by the diazobenzidine method (CLO-DIA-OVA), and OVA.
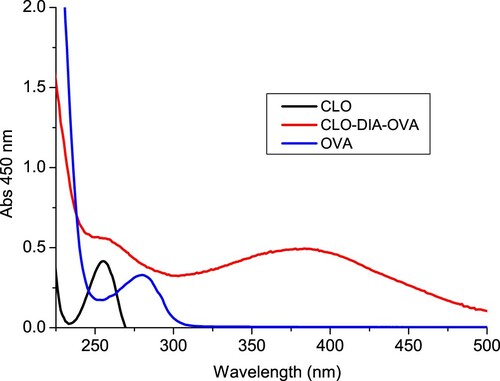
Figure 3. The UV spectra characterization for clonidine (CLO), clonidine was conjugated to KLH by the diazobenzidine method (CLO-DIA-KLH), and KLH.
Female BALB/c mice (6–8 weeks of age) were used to produce anti-CLO monoclonal antibody (mAb). The mice were immunized subcutaneously with CLO-KLH. FCA was used in the first immunization, and FIA was used in subsequent immunization. The mice were immunized every 3 weeks, using 100 µg for the first immunization and 50 µg for the remaining (2–5 immunizations times). Blood samples from the mice were analysed by ELISA. The mouse with the highest titre was sacrificed and its splenocytes were fused with Sp 2/0 murine myeloma cells. The hybridomas were screened by indirect ELISA. The selected hybridoma cells were expanded and injected into BALB/c mice to produce mAbs (Deng et al., Citation2012; Suryoprabowo, Liu, Peng, Kuang, & Xu, Citation2014). The ascites were harvested and purified using the caprylic acid–ammonium sulphate precipitation method (Kong et al., Citation2017a; Wang, Liu, Song, et al., Citation2017). The purified antibody solution was stored at −20°C until further use.
Development of the lateral flow immunochromatographic test strip device
Preparation of colloidal gold particles: All solutions were prepared using ultrapure water and passed through a 0.22 µm membrane filter. Chlorauric acid solution (0.1 g/L; 25 mL) was heated to boiling under constant stirring and mixed with sodium citrate tribasic dehydrate solution (1% w/v; 1.0 mL) under constant stirring for 30 min. When the colour of the solution turned wine-red, it was cooled to room temperature, and stored at 4°C. Analysis by transmission electron microscopy revealed that the GNPs had a nearly uniform particle size of 15 nm.
Preparation of colloidal gold-labelled mAb: The half-maximal inhibitory concentration (IC50) of anti-CLO mAb (no. 2E7) was 2 ng/mL. Colloidal GNP solution (10 mL) was adjusted to pH 7 with 0.1 M K2CO3, and mAb (0.50 mL) was added to the solution dropwise. Thirty-five minutes later, 10% (w/v) bovine serum albumin (BSA; 1 mL) was added. The mixture was stirred for 2 h and then centrifuged at 8000 rpm for 45 min to remove any GNP aggregates. The solution separated into two layers: the lower layer (red gold-labelled mAb) was collected and washed with 0.02 M phosphate buffer containing 5% sucrose, 1% BSA, and 0.5% polyethylene glycol (PEG) 6000 (at pH 7.4). The conjugation products were reconstituted to 1 mL with gold-labelled resuspension buffer (0.02 M PBS, 5% sucrose, 2% sorbitol, 1% mannitol, 0.1% PEG, 0.1% Tween-20, and 0.04% NaN3) and stored at 4°C.
Preparation of NC capture membranes: For the preparation of the immunochromatographic test strip, the NC membrane coated with capture reagents was pasted onto the centre of the plastic backing plate (PVC) and the conjugate pad, sample pad, and absorbent pad were laminated and pasted onto the plate. Goat anti-mouse IgG was sprayed onto NC membrane 1 µL/cm using a dispenser to form the control line (C line). Coating antigen was sprayed onto the NC membrane at 1 µL/cm to form the test line (T line). The card was dried at 37°C for 2 h. Finally, the plate was cut into strips (2.8 mm-wide) using a strip cutter.
Test procedure and principle
Before the test, of gold-labelled mAb (50 µL) was mixed with of sample solution (150 µL), allowed to react for about 5 min, and then applied to the sample pad. The solution migrated along the absorbent pad and the test results were obtained within 5 min. If CLO was present in the sample, it competed with the CLO-OVA conjugates embedded in the test line for the finite amount of anti-CLO mAb. When a sufficient amount of CLO was present, the free CLO bound all of the labelled mAb, preventing the mAb binding to the CLO-OVA in the test line. Therefore, the more the CLO, the weaker the colour of the test line. If there was no CLO, the limited amount of colloidal gold-labelled mAb was trapped by the immobilized CLO-OVA conjugate, and a clearly visible red test line appeared.
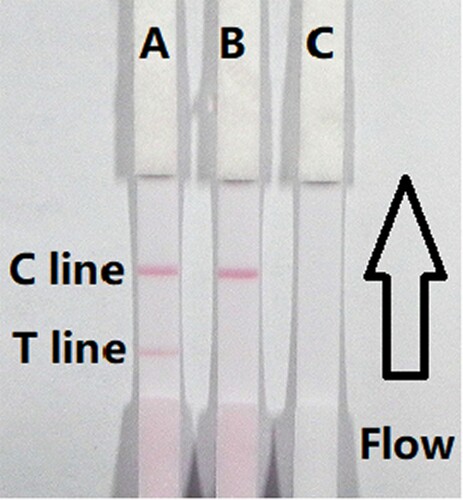
The flow must reach the control line, which contained goat anti-mouse IgG antibody, and also produced an indicator reaction. Therefore, the control line must always appear in a successful test, whereas the test line only will appear when the sample was negative ((A)). The appearance of the control line alone was a positive result ((B)), whereas if neither the control line nor the test line appeared ((C)), the test procedure was incorrect or the strip was invalid, indicating that the test should be repeated with a new strip.
Figure 4. The illustration of strip test results. (A) The sample is negative; (B) if only the C line appears indicates a positive result; (C) invalid result if the control and test line does not appears. C = control line. T = test line.
Determination of strip performance
Sensitivity of the test strip: The sensitivity of the test strip was determined by testing CLO and ACLO samples. Firstly, both the CLO standard and ACLO standard were diluted to concentrations of 0, 0.1, 0.25, 0.5, 1, and 2.5 ng/mL in 0.01 M PBS (pH 7.4) and the detection limit was determined. The sample solution (100 µL) was mixed with gold-labelled mAb (50 µL), allowed to react for 5 min and then added to the sample pad. After 5 min, the colour intensities of the different strips were recorded using a test strip reader. The lowest detection limit (LDL) that could be detected with the naked eye was defined as the amount of CLO and ACLO that produced a colour reaction on the strip that clearly visibly differed in intensity from the negative sample of 0 ng/mL. Six replicate samples for each concentration were analysed on the same day.
Detection of CLO and ACLO in pig urine: Detection of CLO and ACLO in pig urine was carried out using samples with the stated concentration in negative pig urine. The samples to be analysed were spiked with CLO and ACLO standard solution (10 µg/mL, prepared with 0.01 M PBS, pH 7.4). The CLO and ACLO concentrations in pig urine were 0.1, 0.25, 0.5, 1, and 2.5 ng/mL. An un-spiked (blank) sample was used as the control. Six replicates of each concentration were analysed using the test strips.
Results and discussion
Optimization of the strip test
In order to function as the reaction matrix in a LFIA system, a material must be hydrophilic and have good flow characteristics. NC is hydrophobic, but can be made hydrophilic by the addition of rewetting agents during the membrane production process. These rewetting agents are surfactants and the type, amount used, and addition method differs from manufacturer to manufacturer and also from brand to brand within a manufacturer. These factors can affect the performance of the assay.
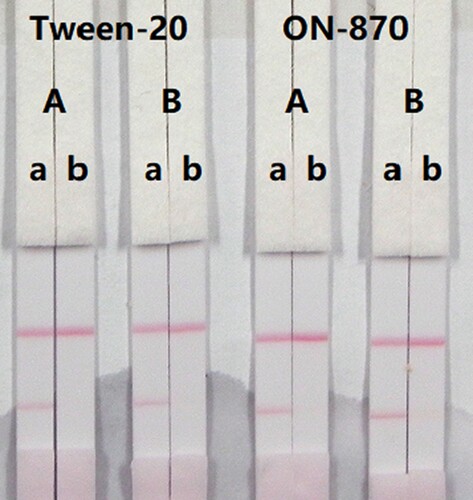
In this study, suspension buffer (0.02 M PBS, 5% sucrose, 2% sorbitol, 1% mannitol, 0.1% PEG, 0.1% Tween-20, and 0.04% NaN3) was added to 12 different rewetting agents polyvinylpyrolidone (PVP), PEG, BSA, casein, sucrose, trehalose, sorbitol, mannitol, Tween-20, Brij-35, Triton X-100, and Rhodasurf® ON-870 (an ethoxylated oleyl alcohol). Solutions containing the surfactants Tween-20 and Rhodasurf® ON-870 resulted in adequate and stable colour reactions (). Immunochromatographic assay test strips with different antigen coating concentrations (0.5 and 1 mg/mL) on the test line were evaluated using negative (0 ng/mL) and positive (5 ng/mL) samples of 0.01 M PBS (pH 7.4) (). An antigen concentration of 1 mg/mL gave a slightly deeper colour intensity than 0.5 mg/mL, suggesting that more sensitive detection could be achieved with 1 mg/mL of coating antigen. The optimum conditions of our developed immunochromatographic assay were 1 mg/mL of coating antigen with a suspension buffer that contained 5% Tween-20.
Figure 5. Result of optimization by using 13 kinds of surfactants. 1 = suspension buffer, 2 = PVP, 3 = PEG, 4 = BSA, 5 = Casein, 6 = Sucrose, 7 = Trehalose, 8 = Sorbitol, 9 = Mannitol, 10 = Tween-20, 11 = Brij-35, 12 = Triton X-100, and 13 = On-870. a = negative (0 ng/mL). b = positive (25 ng/mL).
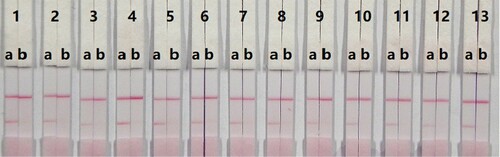
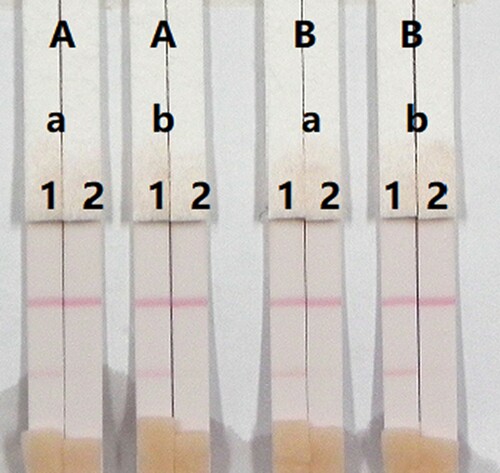
Figure 6. Result of optimization by using two kinds of surfactant and two kinds of coating concentration. A = 0.5 mg/mL of coating concentration; B = 1 mg/mL of coating concentration. a = 0 ng/mL; b = 5 ng/mL.
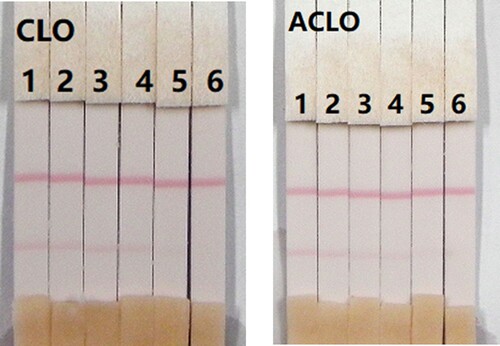
The assay sensitivity was investigated using a series of diluted CLO standards. The LDL with the naked eye was set as the amount of CLO that produced a clearly visible change in intensity of the test strip compared with that negative control that had no added CLO. As shown in , the signal colour on the test lines changed from strong to weak and disappeared completely at 2.5 ng/mL when using 0.01 M PBS (pH 7.4). The cross-reactivity of the assay was determined by running ACLO at concentrations of 0, 0.1, 0.25, 0.5, 1, and 2.5 ng/mL in 0.01 M PBS (pH 7.4). As shown in , a strong colour was observed at 0 and 0.1 ng/mL, but completely disappeared at 2.5 ng/mL.
Figure 7. Colloidal gold immunochromatographic strip for CLO in 0.01 M PBS (pH 7.4). CLO concentration: 1 = 0 ng/mL; 2 = 0.1 ng/mL; 3 = 0.25 ng/mL; 4 = 0.5 ng/mL; 5 = 1 ng/mL; and 6 = 2.5 ng/mL.
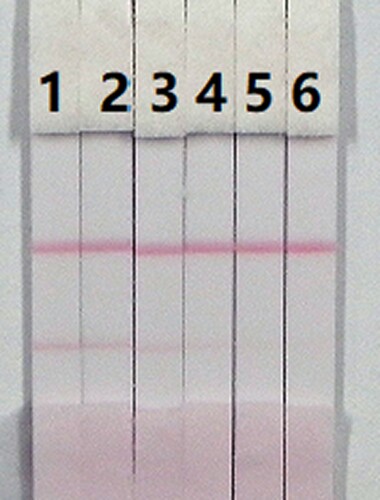
Figure 8. Colloidal gold immunochromatographic strip for ACLO in 0.01 M PBS (pH 7.4). ACLO concentration: 1 = 0 ng/mL; 2 = 0.1 ng/mL; 3 = 0.25 ng/mL; 4 = 0.5 ng/mL; 5 = 1 ng/mL; and 6 = 2.5 ng/mL.
Detection of CLO and ACLO in pig urine
The concentrations of mAbs in the GNPs and of the coating antigen affect the sensitivity of the assay. Two different concentrations of mAbs (8 or 10 µg/mL) were allowed to react with CLO-negative samples (0 ng/mL) and CLO-positive samples (5 ng/mL). There was also a significant different in colour intensity between 0.5 and 1 mg/mL coating antigen. The colour intensity of the test line at 0.5 mg/mL was weaker than at 1 mg/mL, suggesting that more sensitive detection could be achieved at 1 mg/mL coating antigen. As shown in , the optimum conditions for determination of CLO in pig urine were 1 mg/mL coating antigen and 10 µg/mL mAb in the GNPs.
Figure 9. Optimization of the immunochromatographic strip in pig urine. Concentration of coating antigen (A) 0.5 mg/mL and (B) 1 mg/mL. The dosage of the mAb that add in GNP: (a) 8 µg/L and (b) 10 µg/L. The standard concentration: (1) 0 ng/mL and (2) 5 ng/mL.
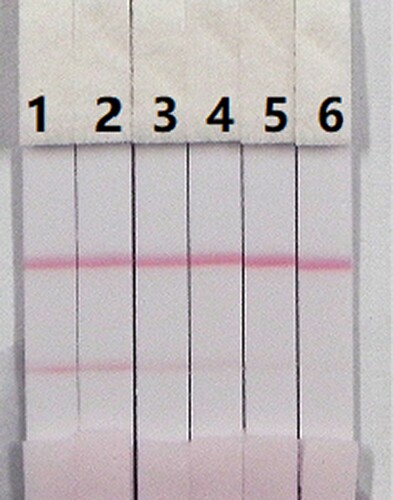
In this study, we determined the effects of matrix on our immunochromatographic assay for CLO and ACLO using pig urine. The advantages of the immunochromatographic assay are rapid and easy to use. The pig urine was spiked with CLO and ACLO standards 10 µg/mL, prepared with 0.01 M PBS, pH 7.4 at final concentrations of CLO and ACLO in pig’s urine of 0.1, 0.25, 0.5, 1, and 2.5 ng/mL. Under the optimized conditions (), the colour intensity decreased as the CLO and ACLO concentration increased. The signal colour changed from strong to weak, and disappeared completely at 2.5 ng/mL for both CLO and ACLO.
Figure 10. Result of CLO and ACLO spiked in pig urine. CLO and ACLO standard concentration: 1= 0 ng/mL; 2 = 0.1 ng/mL; 3 = 0.25 ng/mL; 4= 0.5 ng/mL; 5 = 1 ng/mL; and 6= 2.5 ng/mL.
Conclusions
A sensitive, rapid, and simple analytical method for determination of CLO and ACLO was developed using a colloidal gold-based lateral flow immunochromatographic assay. The cut-off limits of the semi-quantitative test strip for CLO and ACLO were as low as 2.5 ng/mL in both PBS and pig urine and the results could be obtained in 5 min.
Disclosure statement
No potential conflict of interest was reported by the authors.
Additional information
Funding
Related Research Data
References
- Brambilla, G., Cenci, T., Franconi, F., Galarini, R., Macri, A., Rondoni, F., … Loizzo, A. (2000). Clinical and pharmacological profile in a clenbuterol epidemic poisoning of contaminated beef meat in Italy. Toxicology Letters, 114(1–3), 47–53. doi: https://doi.org/10.1016/S0378-4274(99)00270-2
- Chen, Y., Guo, L., Liu, L., Song, S., Kuang, H., & Xu, C. (2017). Ultrasensitive immunochromatographic strip for fast screening of 27 sulfonamides in honey and pork liver samples based on a monoclonal antibody. Journal of Agricultural and Food Chemistry, 65(37), 8248–8255. doi: https://doi.org/10.1021/acs.jafc.7b03190
- Deng, X., Liu, L., Ma, W., Xu, C., Wang, L., & Kuang, H. (2012). Development and validation of a sandwich ELISA for quantification of peanut agglutinin (PNA) in foods. Food and Agricultural Immunology, 23(3), 265–272. doi: https://doi.org/10.1080/09540105.2011.617358
- De Nicolo, A., Avataneo, V., Rabbia, F., Bonifacio, G., Cusato, J., Tomasello, C., … D’Avolio, A. (2016). UHPLC-MS/MS method with protein precipitation extraction for the simultaneous quantification of ten antihypertensive drugs in human plasma from resistant hypertensive patients. Journal of Pharmaceutical and Biomedical Analysis, 129, 535–541. doi: https://doi.org/10.1016/j.jpba.2016.07.049
- De Nicolo, A., Avataneo, V., Rabbia, F., Sciandra, M., Tosello, F., Cusato, J., … D’Avolio, A. (2017). UHPLC-MS/MS method with sample dilution to test therapeutic adherence through quantification of ten antihypertensive drugs in urine samples. Journal of Pharmaceutical and Biomedical Analysis, 142, 279–285. doi: https://doi.org/10.1016/j.jpba.2017.05.018
- Ding, X., Liu, L., Song, S., Kuang, H., & Xu, C. (2017). Rapid and ultrasensitive detection of 3-amino-2-oxazolidinone in catfish muscle with indirect competitive enzyme-linked immunosorbent and immunochromatographic assays. Food and Agricultural Immunology, 28(3), 463–475. doi: https://doi.org/10.1080/09540105.2017.1297778
- Ghosh, C., Singh, R. P., Inamdar, S., Mote, M., & Chakraborty, B. S. (2009). Sensitive, selective, precise and accurate LC-MS method for determination of clonidine in human plasma. Chromatographia, 69(11–12), 1227–1232. doi: https://doi.org/10.1365/s10337-009-1102-3
- Isanga, J., Mukunzi, D., Chen, Y., Suryoprabowo, S., Liu, L., Kuang, H., & Xu, C. (2017). Development of a monoclonal antibody assay and a lateral flow strip test for the detection of paromomycin residues in food matrices. Food and Agricultural Immunology, 28(3), 355–373. doi: https://doi.org/10.1080/09540105.2016.1272551
- Kong, D., Xie, Z., Liu, L., Song, S., Kuang, H., Cui, G., & Xu, C. (2017a). Development of indirect competitive ELISA and lateral-flow immunochromatographic assay strip for the detection of sterigmatocystin in cereal products. Food and Agricultural Immunology, 28(2), 260–273. doi: https://doi.org/10.1080/09540105.2016.1263985
- Kong, D., Xie, Z., Liu, L., Song, S., Kuang, H., & Xu, C. (2017b). Development of ic-ELISA and lateral-flow immunochromatographic assay strip for the detection of vancomycin in raw milk and animal feed. Food and Agricultural Immunology, 28(3), 414–426. doi: https://doi.org/10.1080/09540105.2017.1293014
- Liu, L., Suryoprabowo, S., Zheng, Q., Song, S., & Kuang, H. (2017). Rapid detection of aldicarb in cucumber with an immunochromatographic test strip. Food and Agricultural Immunology, 28(3), 427–438. doi: https://doi.org/10.1080/09540105.2017.1293015
- Mao, X., Baloda, M., Gurung, A. S., Lin, Y., & Liu, G. (2008). Multiplex electrochemical immunoassay using gold nanoparticle probes and immunochromatographic strips. Electrochemistry Communications, 10(10), 1636–1640. doi: https://doi.org/10.1016/j.elecom.2008.08.032
- Mueller, C., Ramic, M., Halfinger, S., Huenseler, C., Theisohn, A., & Roth, B. (2007). Sensitive and convenient method for the quantification of clonidine in serum of pediatric patients using liquid chromatography/tandem mass spectrometry. Journal of Chromatography A, 1139(2), 221–227. doi: https://doi.org/10.1016/j.chroma.2006.11.020
- Naidong, W., Bu, H., Chen, Y. L., Shou, W. Z., Jiang, X., & Halls, T. D. J. (2002). Simultaneous development of six LC-MS-MS methods for the determination of multiple analytes in human plasma. Journal of Pharmaceutical and Biomedical Analysis, 28(6), 1115–1126. doi: https://doi.org/10.1016/S0731-7085(02)00002-X
- Parekh, S. A., Pudage, A., Joshi, S. S., Vaidya, V. V., & Gomes, N. A. (2008). Rapid and sensitive liquid chromatography-tandem mass spectrometry (LC-MS/MS) method for the determination of clonidine in human plasma. Journal of Chromatography B, 867(2), 172–178. doi: https://doi.org/10.1016/j.jchromb.2008.03.030
- Pelzer, M., Addison, T., Li, W. B., Jiang, X. Y., & Weng, N. D. (2002). Development and validation of a liquid chromatography-tandem mass spectrometry method, using silica column and aqueous-organic mobile phase, for the analysis of clonidine as low as 10 pg/mL in human serum. Journal of Liquid Chromatography & Related Technologies, 25(7), 1019–1032. doi: https://doi.org/10.1081/JLC-120003421
- Rosansky, S. J., Johnson, K. L., & McConnell, J. (1993). Use of transdermal clonidine in chronic-hemodialysis patients. Clinical Nephrology, 39(1), 32–36.
- Suryoprabowo, S., Liu, L. Q., Peng, J., Kuang, H., & Xu, C. L. (2014). Development of a broad specific monoclonal antibody for fluoroquinolone analysis. Food Analytical Methods, 7(10), 2163–2168. doi: https://doi.org/10.1007/s12161-014-9863-1
- Taranova, N. A., Berlina, A. N., Zherdev, A. V., & Dzantiev, B. B. (2015). “Traffic light” immunochromatographic test based on multicolor quantum dots for the simultaneous detection of several antibiotics in milk. Biosensors and Bioelectronics, 63, 255–261. doi: https://doi.org/10.1016/j.bios.2014.07.049
- Veigure, R., Aro, R., Metsvaht, T., Standing, J. F., Lutsar, I., Herodes, K., … CloSed, C. (2017). A highly sensitive method for the simultaneous UHPLC-MS/MS analysis of clonidine, morphine, midazolam and their metabolites in blood plasma using HFIP as the eluent additive. Journal of Chromatography B, 1052, 150–157. doi: https://doi.org/10.1016/j.jchromb.2017.03.007
- Wang, X., Liu, F., Shao, Q., Yin, Z., Wang, L., & Fu, Z. (2017). A novel chemiluminescent immunochromatographic assay strip for rapid detection of mercury ions. Analytical Methods, 9(16), 2401–2406. doi: https://doi.org/10.1039/C7AY00231A
- Wang, W., Liu, L., Song, S., Xu, L., Zhu, J., & Kuang, H. (2017). Gold nanoparticle-based paper sensor for multiple detection of 12 listeria spp. By P60-mediated monoclonal antibody. Food and Agricultural Immunology, 28(2), 274–287. doi: https://doi.org/10.1080/09540105.2016.1263986
- Wang, J., She, Y., Wang, M., Jin, M., Li, Y., Wang, J., & Liu, Y. (2015). Multiresidue method for analysis of beta agonists in swine urine by enzyme linked receptor assay based on beta(2) adrenergic receptor expressed in HEK293 cells. Plos One, 10(9). doi: https://doi.org/10.1371/journal.pone.0139176
- Wang, Z., Xie, Z., Cui, G., Liu, L., Song, S., Kuang, H., & Xu, C. (2017). Development of an indirect competitive enzyme-linked immunosorbent assay and immunochromatographic assay forhydrocortisone residues in milk. Food and Agricultural Immunology, 28(3), 476–488. doi: https://doi.org/10.1080/09540105.2017.1297779
- Weller, M. G. (2000). Immunochromatographic techniques – a critical review. Fresenius’ Journal of Analytical Chemistry, 366(6–7), 635–645. doi: https://doi.org/10.1007/s002160051558
- Wenzl, T., Lankmayr, E. P., Wintersteiger, R., Sadjak, A., Likar, R., & Zakel, D. (2002). Determination and quantification of clonidine in human blood serum. Journal of Biochemical and Biophysical Methods, 53(1–3), 131–139. doi: https://doi.org/10.1016/S0165-022X(02)00101-X
- Xiao, Q., & Lin, J.-M. (2015). Advances and applications of chemiluminescence immunoassay in clinical diagnosis and foods safety. Chinese Journal of Analytical Chemistry, 43(6), 929–938. doi: https://doi.org/10.1016/S1872-2040(15)60831-3
- Yamahata, T., Dote, S., Ozawa, Y., Nishikawa, H., & Maeda, S. (1994). Determination of clonidine in human plasma by gas-chromatography electron-impact mass-spectrometry. Journal of Chromatography B: Biomedical Sciences and Applications, 653(1), 92–97. doi: https://doi.org/10.1016/0378-4347(93)E0417-O
- Zadori, Z. S., Toth, V. E., Feher, A., Al-Khrasani, M., Puskar, Z., Kozsurek, M., … Gyires, K. (2016). Inhibition of alpha(2A)-adrenoceptors ameliorates dextran sulfate sodium-induced acute intestinal inflammation in mice. Journal of Pharmacology and Experimental Therapeutics, 358(3), 483–491. doi: https://doi.org/10.1124/jpet.116.235101